Topic Metrics
Topic Metrics tracks message activity for selected MQTT topics. You can use the Dashboard to monitor a specific topic. Starting from EMQX 6.3, you can also use the REST API to create named metric collections with wildcard topic filters and export their counters to Prometheus.
Topic Metrics Interfaces
EMQX 6.3 provides the following Topic Metrics interfaces:
| Interface | Topic Selection | Metrics | Use Case |
|---|---|---|---|
| Dashboard | One topic name without + or # | Message counters, rates, and per-QoS metrics | View and diagnose activity for a specific topic. |
| REST API | A topic filter that can contain + or # | Message and byte counters | Create named collections for programmatic monitoring and Prometheus integration. |
Compatibility
The REST API under /api/v5/mqtt/topic_metrics remains available for compatibility but is deprecated starting from EMQX 6.3. EMQX does not migrate monitoring records created through this API to named collections.
View Topic Metrics on Dashboard
In the Dashboard, click Diagnose -> Topic Metrics. Click Add Topic, enter the topic name to monitor, and click Add.
Enter a specific topic name, such as devices/001/status. The Dashboard does not support topic filters that contain + or #. Wildcard topic metric collections created through the REST API are not displayed on the Dashboard.
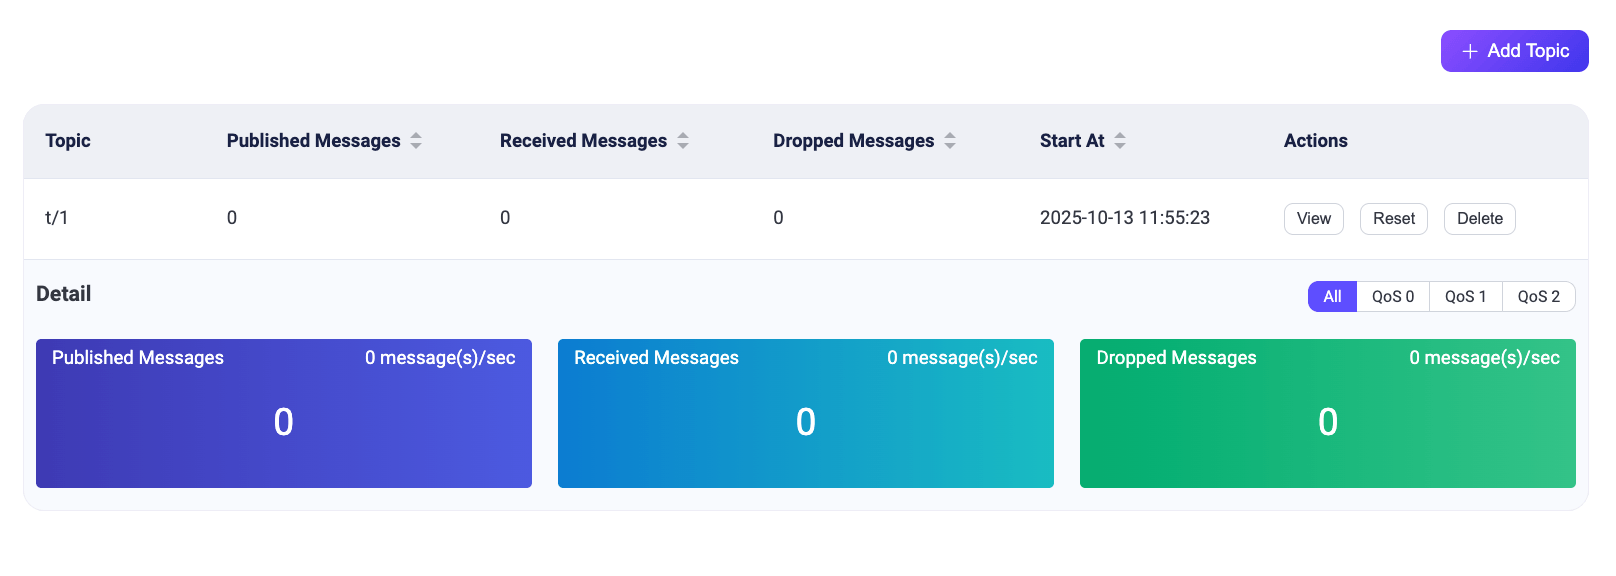
The Topic Metrics list includes the following fields:
- Topic: Topic name being monitored.
- Incoming Messages: Total incoming messages and the incoming message rate.
- Outgoing Messages: Total outgoing messages and the outgoing message rate.
- Dropped Messages: Total dropped messages and the dropped message rate.
- Start At: Time when the monitoring record was created.
- Actions:
- View: View metrics by QoS level.
- Reset: Reset the metrics for the topic.
- Delete: Delete the monitoring record.
Manage Topic Metric Collections with the REST API
Starting from EMQX 6.3, the REST API supports named topic metric collections. Each collection has an independent name and an MQTT topic filter. Multiple filters can overlap, and one message increments every collection whose filter matches the message topic.
For information about REST API authentication, see REST API.
Collection Limits
Topic metric collections have the following limits:
- A collection name must contain 1 to 64 letters, digits, underscores (
_), or hyphens (-). - A topic filter must be a valid MQTT topic filter and can contain
+or#. - A cluster can contain up to 512 collections.
Create a Collection
Send POST /api/v5/mqtt/topic_metrics2 with a collection name and topic filter. The following request creates a collection that matches temperature messages from every sensor:
curl -u '<API_KEY>:<SECRET_KEY>' \
  -H 'Content-Type: application/json' \
  -X POST 'http://localhost:18083/api/v5/mqtt/topic_metrics2' \
  -d '{
    "name": "sensor-temperatures",
    "topic_filter": "sensors/+/temperature"
  }'
The response contains the collection metadata and counters:
{
  "name": "sensor-temperatures",
  "topic_filter": "sensors/+/temperature",
  "namespace": null,
  "create_time": "2026-06-02T12:34:56+00:00",
  "metrics": {
    "messages.in.count": 0,
    "messages.out.count": 0,
    "messages.dropped.count": 0,
    "bytes.in": 0,
    "bytes.out": 0
  }
}
Query and Manage Collections
Use the following endpoints to query and manage collections:
| Method and Endpoint | Operation |
|---|---|
GET /api/v5/mqtt/topic_metrics2 | List the collections visible to the authenticated administrator. |
POST /api/v5/mqtt/topic_metrics2 | Create a collection. |
DELETE /api/v5/mqtt/topic_metrics2 | Delete all collections visible to the authenticated administrator. |
GET /api/v5/mqtt/topic_metrics2/:name | Get one collection and its cluster-aggregated counters. |
DELETE /api/v5/mqtt/topic_metrics2/:name | Delete one collection. |
PUT /api/v5/mqtt/topic_metrics2/:name/reset | Reset the counters for one collection. |
Collection Counters
Each collection contains the following counters:
| Counter | Description |
|---|---|
messages.in.count | Number of messages published to topics that match the filter. |
messages.out.count | Number of matching messages delivered to subscribers. |
messages.dropped.count | Number of matching messages dropped by EMQX. |
bytes.in | Combined size of the topic and payload for matching published messages. |
bytes.out | Combined size of the topic and payload for matching delivered messages. |
The byte counters do not include MQTT properties, user properties, or other protocol overhead. The REST API does not calculate message rates or expose per-QoS counters. To calculate rates, export the counters to Prometheus and use the PromQL rate() function.
Namespace Isolation
Topic metric collections follow the namespace of the administrator who creates them:
- A namespaced administrator creates collections owned by that namespace. These collections count only messages whose publisher belongs to the same namespace.
- A namespaced administrator can list, query, reset, and delete only collections in that namespace.
- A global administrator creates global collections. Global collections count messages from all publishers, regardless of namespace.
- A global administrator can list collections from all namespaces. Collections with the same name can exist in different namespaces.
For more information about namespaces, see Namespace Overview.
Export Topic Metrics to Prometheus
Starting from EMQX 6.3, Prometheus can scrape collection counters from GET /api/v5/prometheus/topic_metrics. For the metric names, labels, collection modes, and a Prometheus configuration example, see Integrate with Prometheus.