Here are the relevant configurations for EMQX Custom Resource. You can choose the corresponding APIVersion based on the version of EMQX you wish to deploy. For specific compatibility relationships, please refer to EMQX Operator Compatibility:
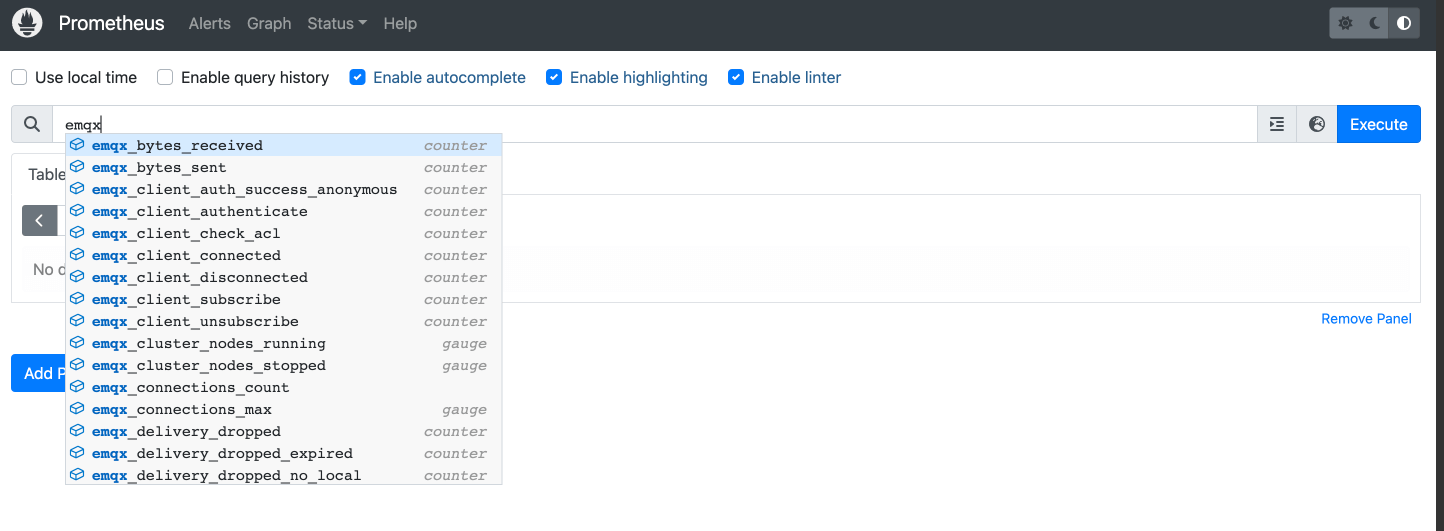
EMQX supports exposing indicators through the http interface. For all statistical indicators under the cluster, please refer to the document: HTTP API(opens new window)
apiVersion: apps.emqx.io/v2alpha1
kind: EMQX
metadata:name: emqx
spec:image: emqx:5.0coreTemplate:spec:ports:# prometheus monitor requires the pod must name the target port-name: dashboard
containerPort:18083replicantTemplate:spec:ports:-name: dashboard
containerPort:18083
1 2 3 4 5 6 7 8 9 10 11 12 13 14 15 16 17
Save the above content as emqx.yaml and execute the following command to deploy the EMQX cluster:
$ kubectl apply -f emqx.yaml

emqx.apps.emqx.io/emqx created
1 2 3
Check the status of the EMQX cluster and make sure that STATUS is Running, which may take some time to wait for the EMQX cluster to be ready.
$ kubectl get emqx emqx

NAME   IMAGE      STATUS    AGE
emqx   emqx:5.0   Running   10m
1 2 3 4
EMQX supports exposing indicators through the http interface. For all statistical indicators under the cluster, you can refer to the document: HTTP API(opens new window)
apiVersion: apps.emqx.io/v1beta4
kind: EmqxEnterprise
metadata:name: emqx-ee
spec:template:spec:emqxContainer:image:repository: emqx/emqx-ee
version: 4.4.16
ports:# prometheus monitor requires the pod must name the target port-name: dashboard
containerPort:18083
1 2 3 4 5 6 7 8 9 10 11 12 13 14 15
Save the above content as emqx.yaml and execute the following command to deploy the EMQX cluster:
$ kubectl apply -f emqx.yaml

emqxenterprise.apps.emqx.io/emqx-ee created
1 2 3
Check the status of the EMQX cluster and make sure that STATUS is Running, which may take some time to wait for the EMQX cluster to be ready.
$ kubectl get emqxenterprises

NAME      STATUS   AGE
emqx-ee   Running  8m33s
1 2 3 4
If you are deploying EMQX 4.4 open-source, you need to enable plugin emqx_prometheus by EmqxPlugin CRD:
The emqx-exporter is designed to expose partial metrics that are not included in the EMQX Prometheus API. It is compatible with EMQX 4.4 and EMQX 5, both open-source and enterprise.
apiVersion: v1
kind: Service
metadata:labels:app: emqx-exporter
name: emqx-exporter-service
spec:ports:-name: metrics
port:8085targetPort: metrics
selector:app: emqx-exporter
---apiVersion: apps/v1
kind: Deployment
metadata:name: emqx-exporter
labels:app: emqx-exporter
spec:selector:matchLabels:app: emqx-exporter
replicas:1template:metadata:labels:app: emqx-exporter
spec:securityContext:runAsUser:1000containers:-name: exporter
image: emqx-exporter:latest
imagePullPolicy: IfNotPresent
args:# "emqx-dashboard-service-name" is the service name that creating by operator for exposing 18083 port---emqx.nodes=${emqx-dashboard-service-name}:18083---emqx.auth-username=${paste_your_new_api_key_here}---emqx.auth-password=${paste_your_new_secret_here}securityContext:allowPrivilegeEscalation:falserunAsNonRoot:trueports:-containerPort:8085name: metrics
protocol: TCP
resources:limits:cpu: 100m
memory: 100Mi
requests:cpu: 100m
memory: 20Mi
Set the arg "--emqx.nodes" to the service name that creating by operator for exposing 18083 port. Check out the service name by call kubectl get svc.
Save the above content as emqx-exporter.yaml, replace --emqx.auth-username and --emqx.auth-password with your new creating API secret, then execute the following command to deploy the emqx-exporter:
kubectl apply -f emqx-exporter.yaml
1
Check the status of emqx-exporter pod。
$ kubectl get po -l="app=emqx-exporter"

NAME      STATUS   AGE
emqx-exporter-856564c95-j4q5v   Running  8m33s
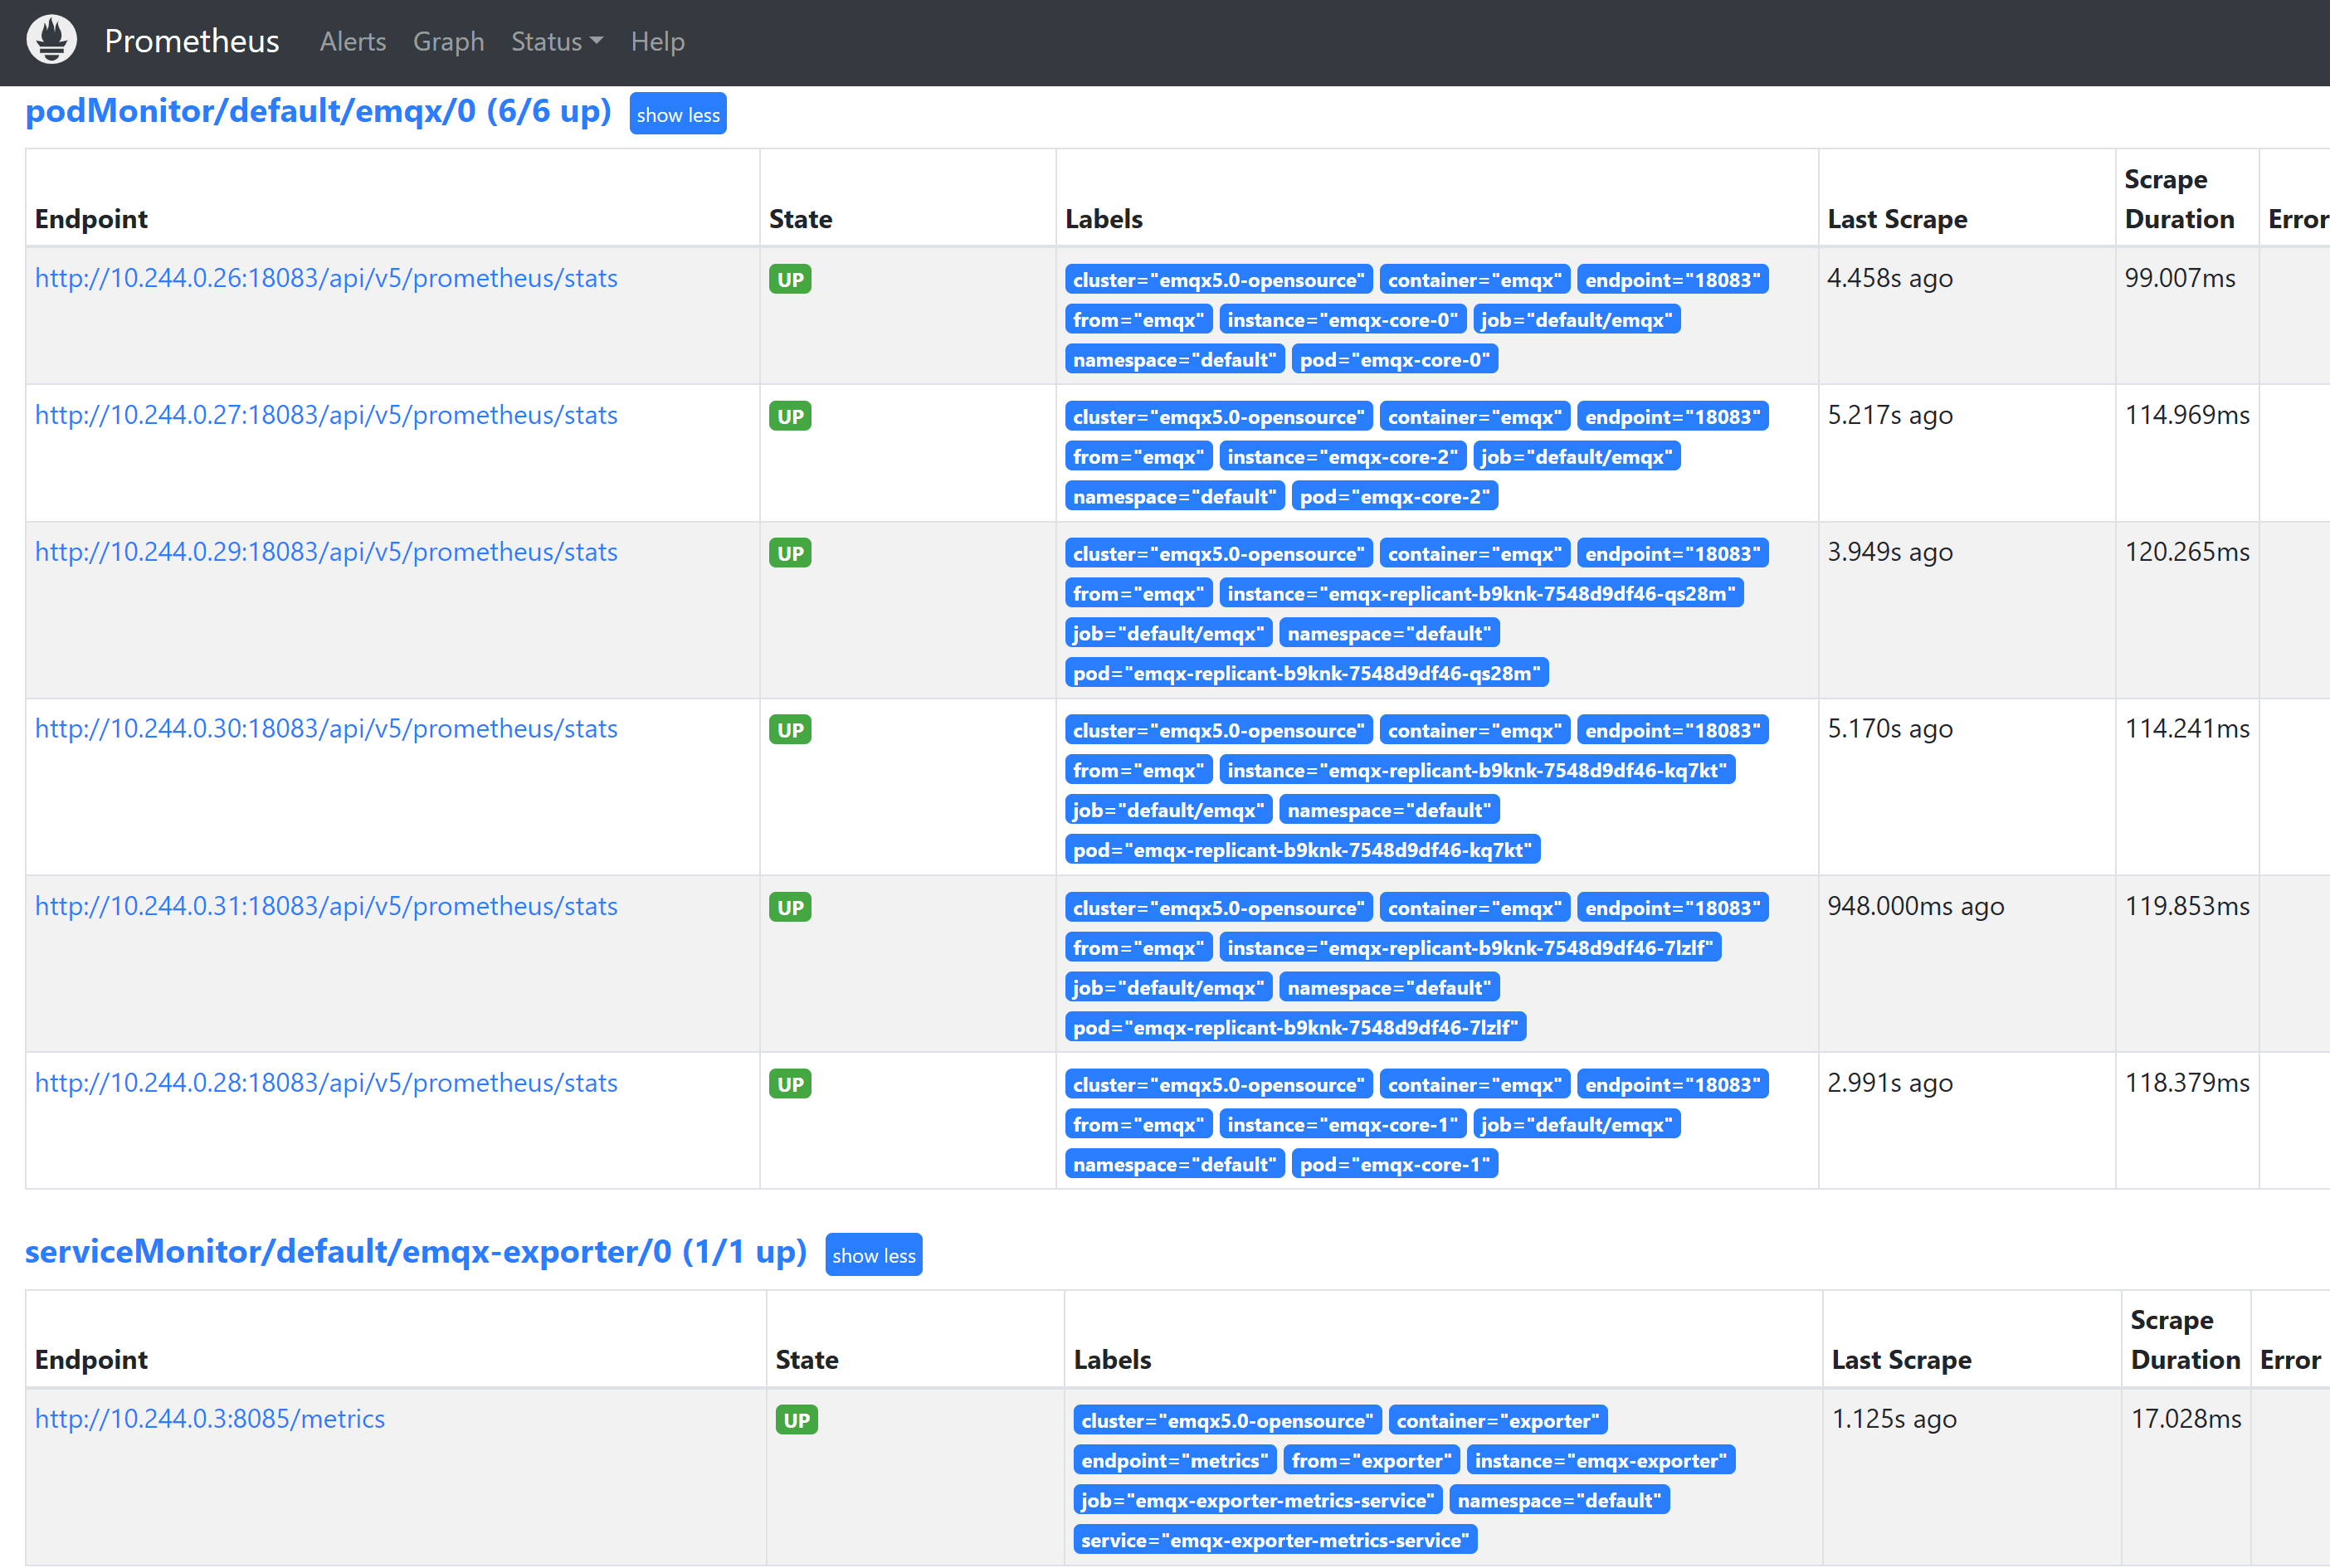
`path` indicates the path of the indicator collection interface. In EMQX 5, the path is: `/api/v5/prometheus/stats`. `selector.matchLabels` indicates the label of the matching Pod: `apps.emqx.io/instance: emqx`.
The value of targetLabel `cluster` represents the name of current cluster, make sure its uniqueness.
apiVersion: monitoring.coreos.com/v1
kind: PodMonitor
metadata:name: emqx
labels:app.kubernetes.io/name: emqx
spec:podMetricsEndpoints:-interval: 5s
params:type:- prometheus
path: /api/v4/emqx_prometheus
# the name of emqx dashboard containerPortport: dashboard
relabelings:-action: replace
# user-defined cluster name, requires uniquereplacement: emqx4
targetLabel: cluster
-action: replace
# fix value, don't modifyreplacement: emqx
targetLabel: from
-action: replace
# fix value, don't modifysourceLabels:['pod']targetLabel:"instance"selector:matchLabels:# the label is the same as the label of emqx podapps.emqx.io/instance: emqx
apps.emqx.io/managed-by: emqx-operator
namespaceSelector:matchNames:# modify the namespace if your EMQX cluster deployed in other namespace#- default---apiVersion: monitoring.coreos.com/v1
kind: ServiceMonitor
metadata:name: emqx-exporter
labels:app: emqx-exporter
spec:selector:matchLabels:# the label in emqx exporter svcapp: emqx-exporter
endpoints:-port: metrics
interval: 5s
path: /metrics
relabelings:-action: replace
# user-defined cluster name, requires uniquereplacement: emqx4
targetLabel: cluster
-action: replace
# fix value, don't modifyreplacement: exporter
targetLabel: from
-action: replace
# fix value, don't modifysourceLabels:['pod']regex:'(.*)-.*-.*'replacement: $1
targetLabel:"instance"-action: labeldrop
# fix value, don't modifyregex:'pod'namespaceSelector:matchNames:# modify the namespace if your exporter deployed in other namespace#- default
path indicates the path of the indicator collection interface. In EMQX 4, the path is: /api/v4/emqx_prometheus. selector.matchLabels indicates the label of the matching Pod: apps.emqx.io/instance: emqx-ee. The value of targetLabel cluster represents the name of current cluster, make sure its uniqueness.
Save the above content as monitor.yaml and execute the following command: