Integrate with OpenTelemetry
OpenTelemetry is an observability framework and toolkit designed to create and manage telemetry data such as traces, metrics, and logs. Crucially, OpenTelemetry is vendor- and tool-agnostic, meaning that it can be used with a broad variety of Observability backends, including open-source tools like Jaeger and Prometheus, as well as commercial offerings.
EMQX supports directly pushing telemetry data to the OpenTelemetry Collector via OTLP/gRPC, and then transferring, filtering, or converting the data through the Collector to any backend you want to integrate for storage and visualization, such as Jaeger and Prometheus. Starting from EMQX 6.3.0, EMQX also supports exporting OpenTelemetry logs and traces directly to Dynatrace through OTLP HTTP/protobuf with OAuth2 authentication.
By integrating with OpenTelemetry, EMQX's metric collection, distributed tracing of message publishing, and unified collection and context association of logs can be optimized. This integration can help users achieve visual monitoring and alert notifications for EMQX, tracking the flow of messages between different systems and services. This is very helpful for continuous performance optimization, quicker problem localization, and system monitoring.
TIP
Starting from EMQX 6.3.0, OpenTelemetry is controlled by the opentelemetry feature gate. If you set EMQX_FEATURES manually, enabling opentelemetry also enables its required dashboard dependency. For more information, see Feature Gates.
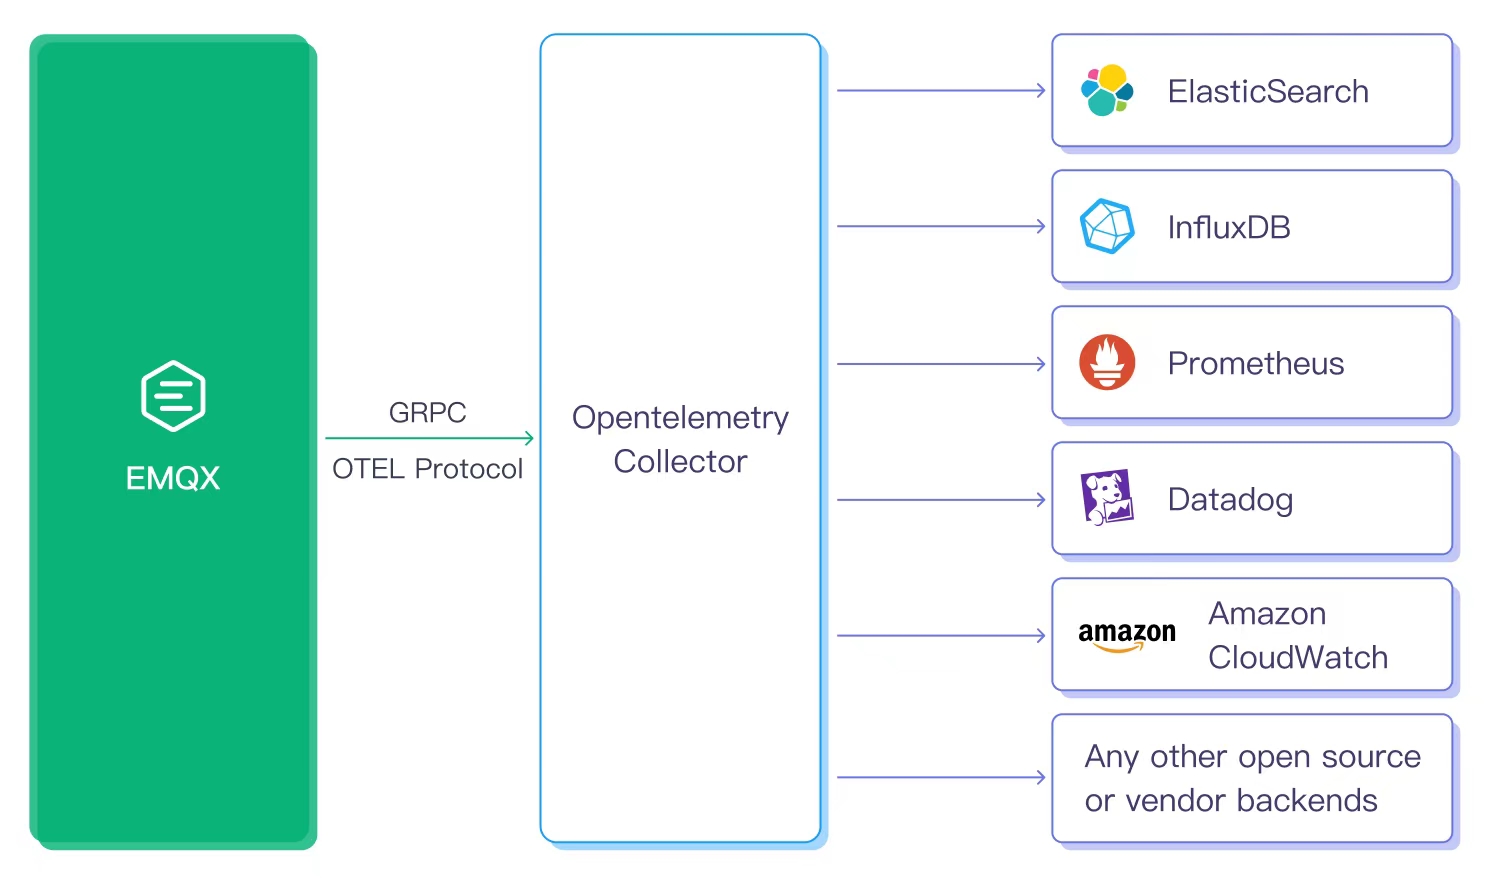
This section introduces how EMQX integrates the telemetry data with the OpenTelemetry Collector, enabling full built-in OpenTelemetry support for the following observability information:
In addition, starting from EMQX version 5.8.3, end-to-end tracing based on OpenTelemetry is also supported: