Integrate with Prometheus
EMQX supports integration with third-party monitoring systems such as Prometheus, an open-source monitoring solution originally developed by SoundCloud. Prometheus provides a multidimensional data model, flexible query language (PromQL), and powerful alerting capabilities.
Using a third-party monitoring system can bring the following advantages:
- A complete monitoring system, where the monitoring data of EMQX will be integrated with that of the other systems. For example, you can get the monitoring information of the server host.
- More intuitive monitoring report with figures and charts, such as using Grafana dashboard to visualize the EMQX metrics.
- Various alarm notification options, such as using Prometheus Alertmanager to set up alarm rules and notification methods.
EMQX supports two methods for integrating Prometheus metrics monitoring:
- Pull Mode: Prometheus directly collects metrics through EMQX's REST API.
- Push Mode: EMQX pushes metrics to the Pushgateway service, from which Prometheus collects the metrics.
To configure Prometheus integration:
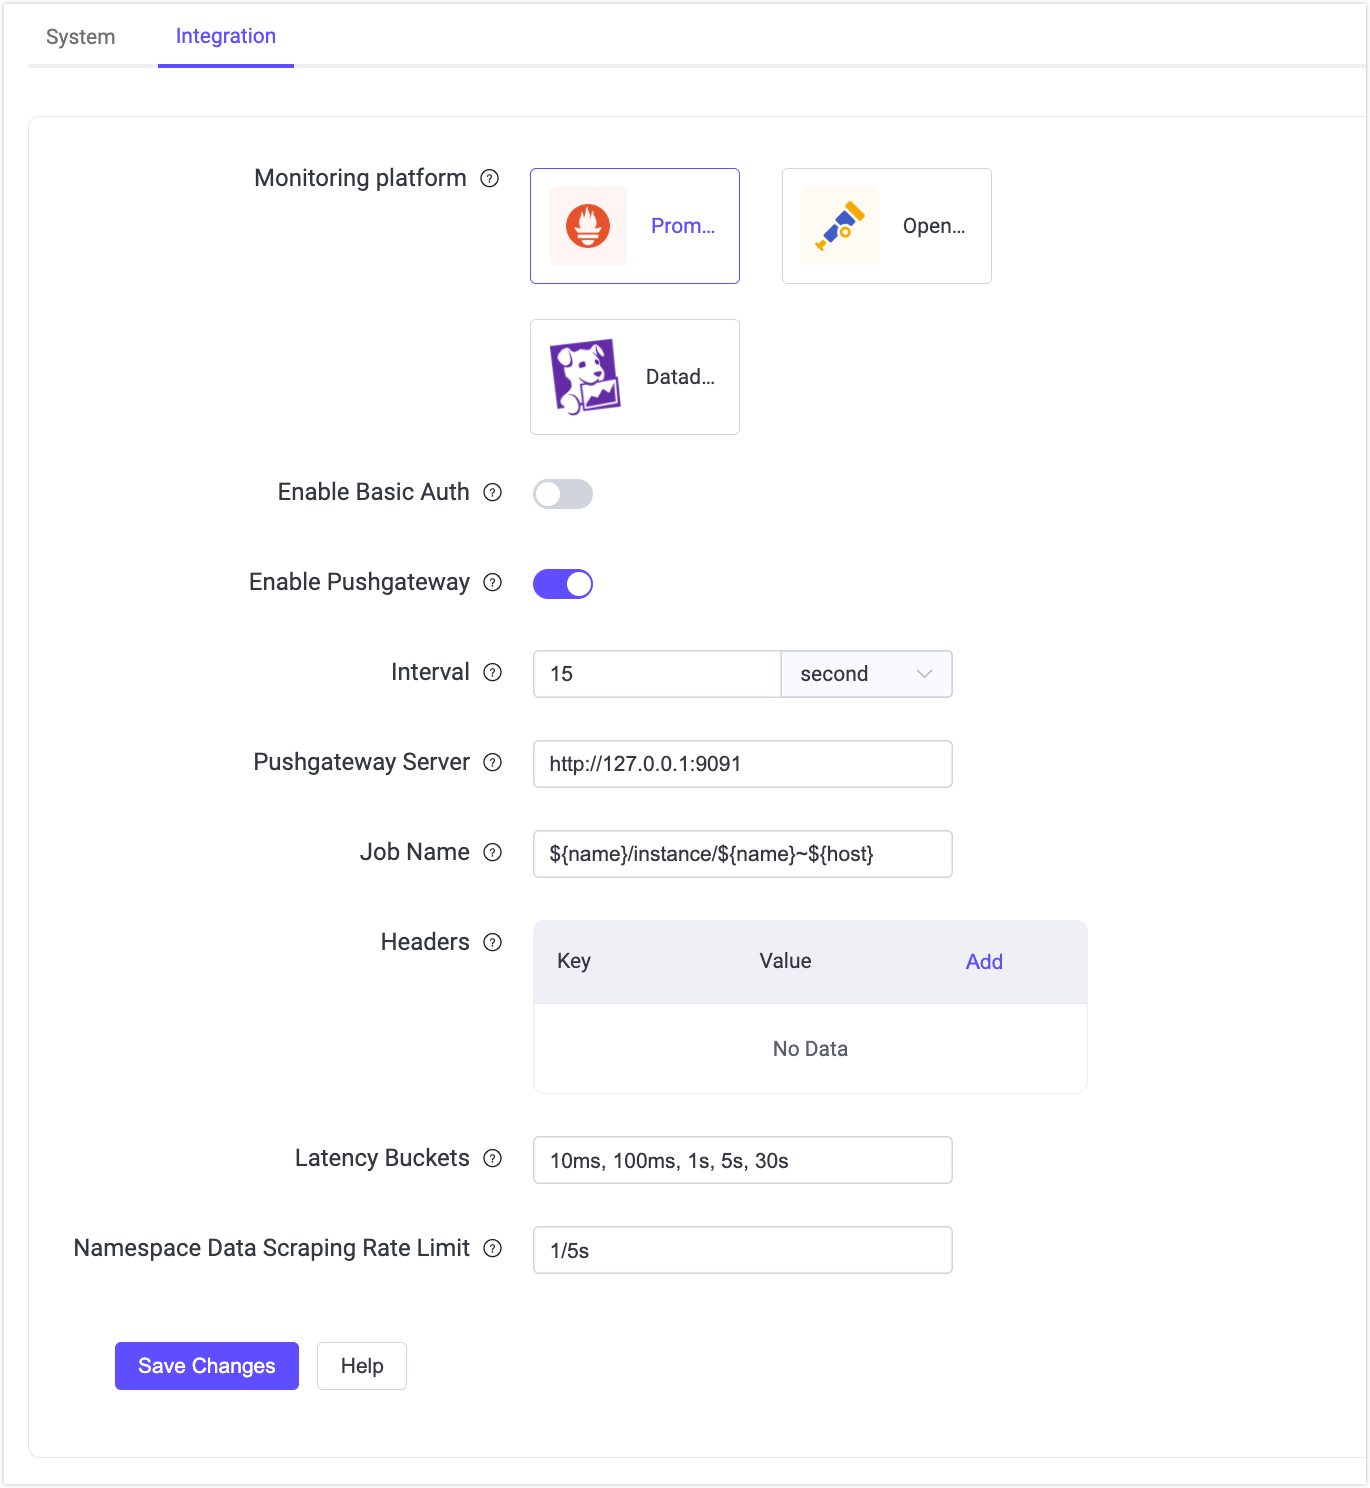
- Go to Management -> Monitoring in the EMQX Dashboard.
- Switch to the Integration tab.
- Select Prometheus as the monitoring platform.
Depending on the selected mode, some configuration options apply only to Pull mode, while others affect both modes. You can click the Help button on the Dashboard page to view detailed configuration steps for each mode.
For a curated reference of the metric series exposed on the endpoints below (including the ones worth alerting on), see Broker Health Indicators.
Prometheus Configuration Options
This section describes all configuration options available when selecting Prometheus in the Dashboard.
General Options (Affect Both Pull and Push Modes)
Latency Buckets
Specify histogram bucket boundaries for latency-related metrics.
Format
A comma-separated list of duration values:
10ms, 100ms, 1s, 5s, 30sDescription
These values define how latency metrics are grouped into histogram buckets in Prometheus. Smaller bucket intervals provide finer granularity but may increase metric cardinality and storage usage.
This setting affects how latency histogram metrics are generated internally and applies to:
- Pull mode metrics
- Push mode metrics (via Pushgateway)
Pull Mode Settings
The following options apply only when Prometheus scrapes EMQX metrics via REST APIs.
Enable Basic Auth
Enable or disable HTTP Basic Authentication for Prometheus scrape APIs.
By default, Prometheus Pull mode APIs do not require authentication. When this option is enabled:
- Prometheus must use HTTP Basic Authentication to access:
/api/v5/prometheus/stats/api/v5/prometheus/auth/api/v5/prometheus/data_integration
- You must create an API Key in EMQX.
- Configure the
basic_authsection in yourprometheus.yaml.
This option applies only to Pull mode and does not affect Pushgateway integration. For details, see Configure Pull Mode Integration.
Namespace Data Scraping Rate Limit
Limit the maximum request rate when scraping namespace-related metrics.
Namespace-level metrics are supported in multi-tenant deployments and can be exposed or aggregated by namespace. For details, see Prometheus Metrics Isolation.
Format: <requests>/<duration>
Example: 1/5s, which means at most 1 request is allowed every 5 seconds. Additional requests within the time window will be rejected.
Behavior:
- Applies only to namespace-level metric scraping requests.
- Requests targeting specific namespaces are not limited.
- Applies only to Pull mode.
This option helps prevent excessive load in large-scale or multi-namespace deployments.
Push Mode Settings
Push mode allows EMQX to send metrics to a Pushgateway instance. By default, Push mode is disabled.
Enable Pushgateway
Enable or disable metric pushing to Pushgateway. When enabled, configure the following fields:
Interval
Specify how often EMQX pushes metrics to Pushgateway. The default value is 15 seconds.
Pushgateway Server
Specify the Pushgateway server URL. It is http://127.0.0.1:9091 by default.
Job Name
Specify the job label used when pushing metrics to Pushgateway.
You can construct the job label using variables derived from the EMQX node name and hostname. The default value is: ${name}/instance/${name}~${host}.
Variables:
${name}: EMQX node name (e.g.,emqx)${host}: Host IP address (e.g.,127.0.0.1)
For example, if the node name is emqx@127.0.0.1, then:
${name}=emqx${host}=127.0.0.1
Headers
Optional HTTP headers sent when pushing metrics to Pushgateway.
The value type is string. You can configure headers as key-value pairs, for example:
Authorization = "some-auth-token"Click Add to insert additional headers.
Configure Pull Mode Integration
In Pull mode, Prometheus scrapes metrics from EMQX through REST APIs.
EMQX provides the following endpoints for metric collection:
/api/v5/prometheus/stats: Basic metrics and counters of EMQX./api/v5/prometheus/auth: Key metrics and counters in access control, including authentication and authorization./api/v5/prometheus/data_integration: Metrics and counters related to the rule engine, connectors, actions, Sink/Source, and encoding/decoding.
Metric Collection Modes
When calling the above APIs to obtain metrics, you can use the URL query parameter mode to get different types of metric data. The meanings of different parameters are as follows:
For more information about Prometheus pull endpoints, refer to the EMQX Enterprise API documentation.
Authentication (Optional)
By default, Prometheus Pull mode APIs do not require authentication.
If Enable Basic Auth is enabled in the EMQX Dashboard, Prometheus must authenticate using HTTP Basic Authentication.
In this case:
- Create an API key in EMQX.
- Use the generated API Key and Secret Key in the Prometheus configuration.
In the Prometheus configuration:
basic_auth:
  username: '<API_KEY>'
  password: '<SECRET_KEY>'
Where:
usernameis the API Key.passwordis the corresponding Secret Key.
Prometheus will use these credentials when scraping EMQX metrics.
Prometheus Server Configuration Example
To enable Prometheus to scrape EMQX metrics, configure the Prometheus server.
Add the following configuration to your Prometheus configuration file, then restart the Prometheus service.
# prometheus.yaml
global:
  scrape_interval:     10s # The default scrape interval is every 10 seconds.
  evaluation_interval: 10s # The default evaluation interval is every 10 seconds.
  # On this machine, every time series will be exported by default.
  external_labels:
    monitor: 'emqx-monitor'
scrape_configs:
  - job_name: 'emqx_stats'
    static_configs:
      - targets: ['127.0.0.1:18083']
    metrics_path: '/api/v5/prometheus/stats'
    scheme: 'http'
    basic_auth:
      username: ''
      password: ''

  - job_name: 'emqx_auth'
    static_configs:
      - targets: ['127.0.0.1:18083']
    metrics_path: '/api/v5/prometheus/auth'
    scheme: 'http'
    basic_auth:
      username: ''
      password: ''

  - job_name: 'emqx_data_integration'
    static_configs:
      - targets: ['127.0.0.1:18083']
    metrics_path: '/api/v5/prometheus/data_integration'
    scheme: 'http'
    basic_auth:
      username: ''
      password: ''
Configure Push Mode Integration
Push mode sends metrics from EMQX to Pushgateway.
After enabling Enable Pushgateway in the Dashboard and configuring the required fields, click Save Changes.
The Push mode currently only includes EMQX's basic metrics and counters from the /api/v5/prometheus/stats endpoint. For comprehensive monitoring, Pull mode is generally recommended.
Configuration File Example
You can also enable and configure the Pushgateway by adding the following configuration to the configuration file. For more information on configuration items, see Configuration - Prometheus.
prometheus {
  push_gateway_server = "http://127.0.0.1:9091"
  interval = 15s
  headers {}
  job_name = "${name}/instance/${name}~${host}"
}
Use Grafana to Visualize EMQX Metrics
You can also use Grafana with Prometheus to visualize EMQX metrics, which can be achieved by importing the EMQX template files into Grafana. To download the template, click EMQX | Grafana Dashboard or click the Help button at the bottom of the Integration tab of the Monitoring page.
TIP
For detailed operating steps, see Monitoring MQTT broker with Prometheus and Grafana