Log Trace
EMQX 5.0 introduces the Log Trace feature, enabling real-time debug-level log outputs for specific client IDs, topics, IP addresses, or rule IDs. This allows detailed debugging in production environments without affecting system performance due to excessive logs, increasing the efficiency of diagnosing and resolving EMQX issues.
How Log Trace Works
The Log Trace feature is implemented using Erlang's built-in Logger Filter function, which has a negligible impact on the overall message throughput. EMQX uses independent File Handlers to persist Trace logs and creates a separate process for each client connection to process its messages.
When a client sends a message, the process responsible for that connection checks if the message matches the rules set by the Trace Filter. For example, it may check if the message is from a specified client ID:
- If the message matches the filter criteria, the process converts it into a human-readable trace event and asynchronously sends it to the appropriate File Handler.
- Otherwise, the message is processed as usual.
The File Handlers are responsible for persisting trace events into their respective Trace files on disk.
If a node or the entire EMQX cluster is restarted, any unfinished Log Traces will be automatically resumed.
Why Use Log Trace
The Log Trace feature is an effective tool for debugging and monitoring in production environments for several key reasons:
- Safety: The filtering process is performed independently for each client, which prevents the File Handler from being overloaded. Since most logs are filtered out, this approach is safe for production environments.
- Reliability: This feature ensures that trace logging does not impact the overall message throughput of EMQX and provides a reliable and efficient way to store and retrieve log data.
- Agility: Log Trace can be used for various scenarios, such as debugging messages or data loss, client disconnections, or subscription failures. For issues that occur at a specific time, you can schedule the trace to start and stop automatically for convenient log collection.
Namespace Scoping for Log Traces
Starting from EMQX 6.0.3, log trace access is scoped by namespace when namespaced roles are in use:
- Namespaced users see only traces that belong to their namespace in
GET /traceresponses. - The following per-trace operations return
404 Not Foundwhen the trace belongs to a different namespace, so the existence of cross-namespace traces is not leaked:PUT /trace/:name/stopGET /trace/:name/downloadGET /trace/:name/logGET /trace/:name/log_detailDELETE /trace/:name
- The bulk-delete operation (
DELETE /trace) is restricted to global administrators. Namespaced users receive403 Forbidden.
Global administrators can view and manage all traces regardless of namespace.
Create a Log Trace
This section demonstrates how to create Log Trace rules from the Dashboard. You can trace interactions based on Client ID, Topic, IP address, or Rule ID.
- Click Diagnose -> Log Traces on the left navigation menu.
- On the Log Traces page, click Create to configure your trace rules.
Configure Common Trace Options
On the Create Trace dialog, configure the following options that apply to all trace types:
- Name: Enter a descriptive name to identify the trace in the system. This name will appear in the trace list and should provide useful context, such as the type of trace (e.g., "Client ID Trace" or "Topic Trace") for quicker search and identification.
- Start Time / End Time: Select the start and end times for the trace. If the start time is in the past, the trace will begin immediately.
- Formatter: The format for the log output. Options include
JSONandText. - Payload Encode: Specify the format for the message payload in the trace log. Choose one of the following:
Text: Plain text, recommended for JSON-encoded payloads.HEX: Hexadecimal encoding, recommended for custom binary protocols.Hidden: Obfuscates the payload as******, useful for masking sensitive information.
- Payload Limit: Set the maximum number of bytes to be printed for the payload in the trace file. This option is only effective when Payload Encode is either
TextorHEX. If the payload exceeds this limit, it will be truncated. The default value is1024 B. This limit is enabled by default but can be disabled to allow unlimited payload size.
Trace by Client ID
- In the Create Trace dialog, select
Client IDfrom the Type drop-down list. - Enter the Client IDs to be traced.
- Configure the common options as described in Common Trace Options.
- Click Create.
The log trace will capture interactions between the specified Client ID and the EMQX broker.
Trace by Topic
- In the Create Trace dialog, select
Topicfrom the Type drop-down list. - Enter the topic to be traced. Wildcards are supported, for example,
/pay/#. - Configure the common options as described in Common Trace Options.
- Click Create.
The log trace will capture messages published to the specified topic, as well as subscription and unsubscription events.
Trace by IP Address
- In the Create Trace dialog, select
IP Addressfrom the Type drop-down list. - Enter the IP address to be traced, for example,
192.168.0.5. - Configure the common options as described in Common Trace Options.
- Click Create.
The log trace will capture interactions between the client connecting from the specified IP address and the EMQX broker.
Trace by Rule ID
- In the Create Trace dialog, select
Rule IDfrom the Type drop-down list. - Enter the rule ID to trace. You can find the rule ID on the Integration -> Rules page.
- Configure the common options as described in Common Trace Options.
- Click Create.
The trace results will include the execution results of the rule SQL and the execution logs for all actions added to the rule, useful for debugging and optimizing the rule.
The Test Rules operation can automatically create and manage this trace type. When testing a rule, EMQX will automatically generate a trace task and delete it automatically after the test stops.
View Log Trace
Created Log Traces are listed on the Log Trace page. The log file size shown in the list is the sum of the uncompressed file sizes. You can stop a trace manually by clicking the Stop button, or it will stop automatically when the specified end time is reached.
There is a limit to the number of traces you can create. By default, this limit is 30, but it is configurable via the trace.max_traces parameter.
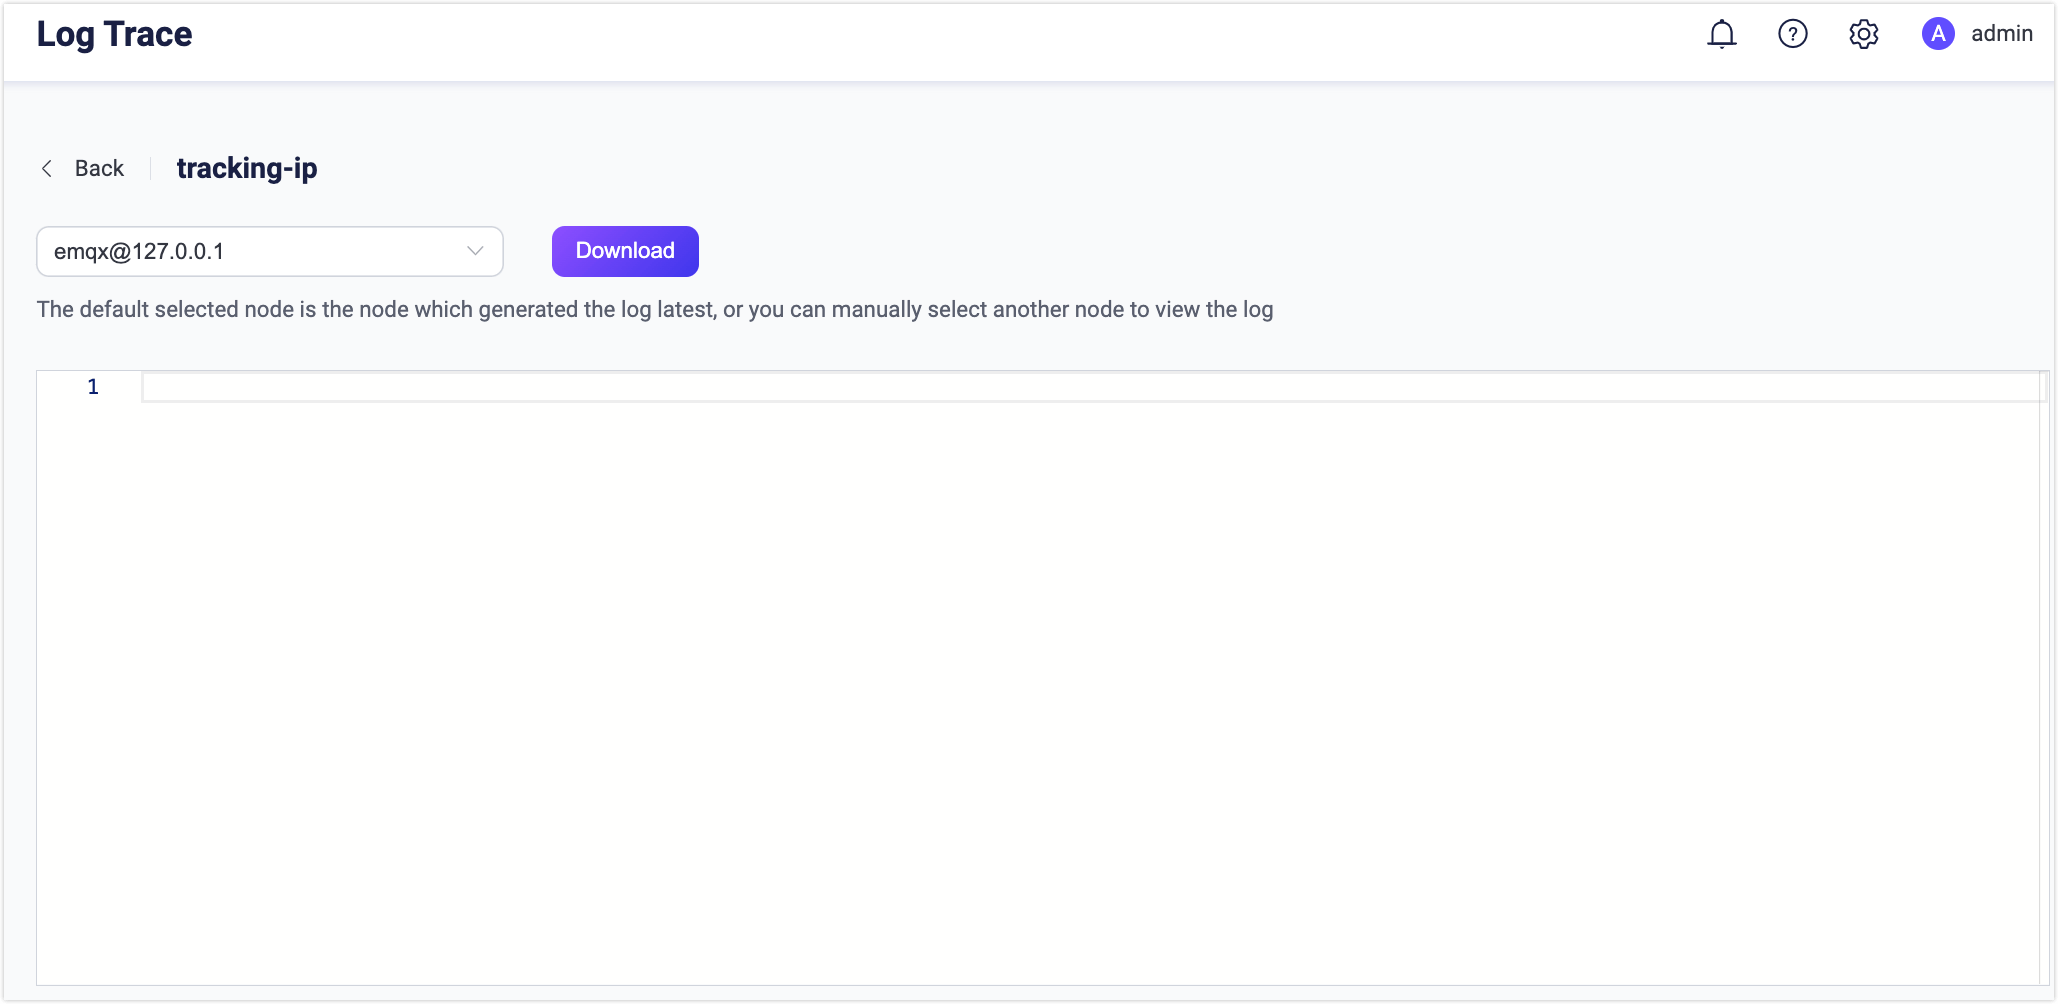
Click a trace name to open the trace details, where you can view trace events and download the logs from a specific node in the cluster.
By default, each trace is limited to a maximum of 128MB of log data per node. This limit can be configured using the trace.max_file_size configuration parameter. To manage disk space, File Handlers operate in a rotating manner: once a trace's log reaches the size limit, the oldest trace events are discarded to make room for the new ones. Note that this is not a hard limit; the total size of the log files is usually lower than the configured value but may briefly exceed it by a few kilobytes.
If a download from the Dashboard times out, you can manually retrieve the trace logs from the /data/trace directory on each EMQX node.