EMQX Dashboard
EMQX provides a built-in Dashboard management console for users to monitor and manage EMQX clusters and configure the required features via web pages. The new Dashboard comes with a fresh new design and provides the easy-to-use MQTT broker management UI.
The new UI / UX design of EMQX Dashboard optimizes the display and content of key data and metrics, enhancing the visual experience while providing more comprehensive, powerful and easy-to-use built-in features, such as authentication and permission management for connection, subscription and publishing, support for data integration transformation using data bridging and with the rules engine, etc. Quick and easy access using the browser provides users with the convenience of using EMQX for more IoT business development.
Main Features
This section introduces various features of EMQX that you can configure and manage through the Dashboard.
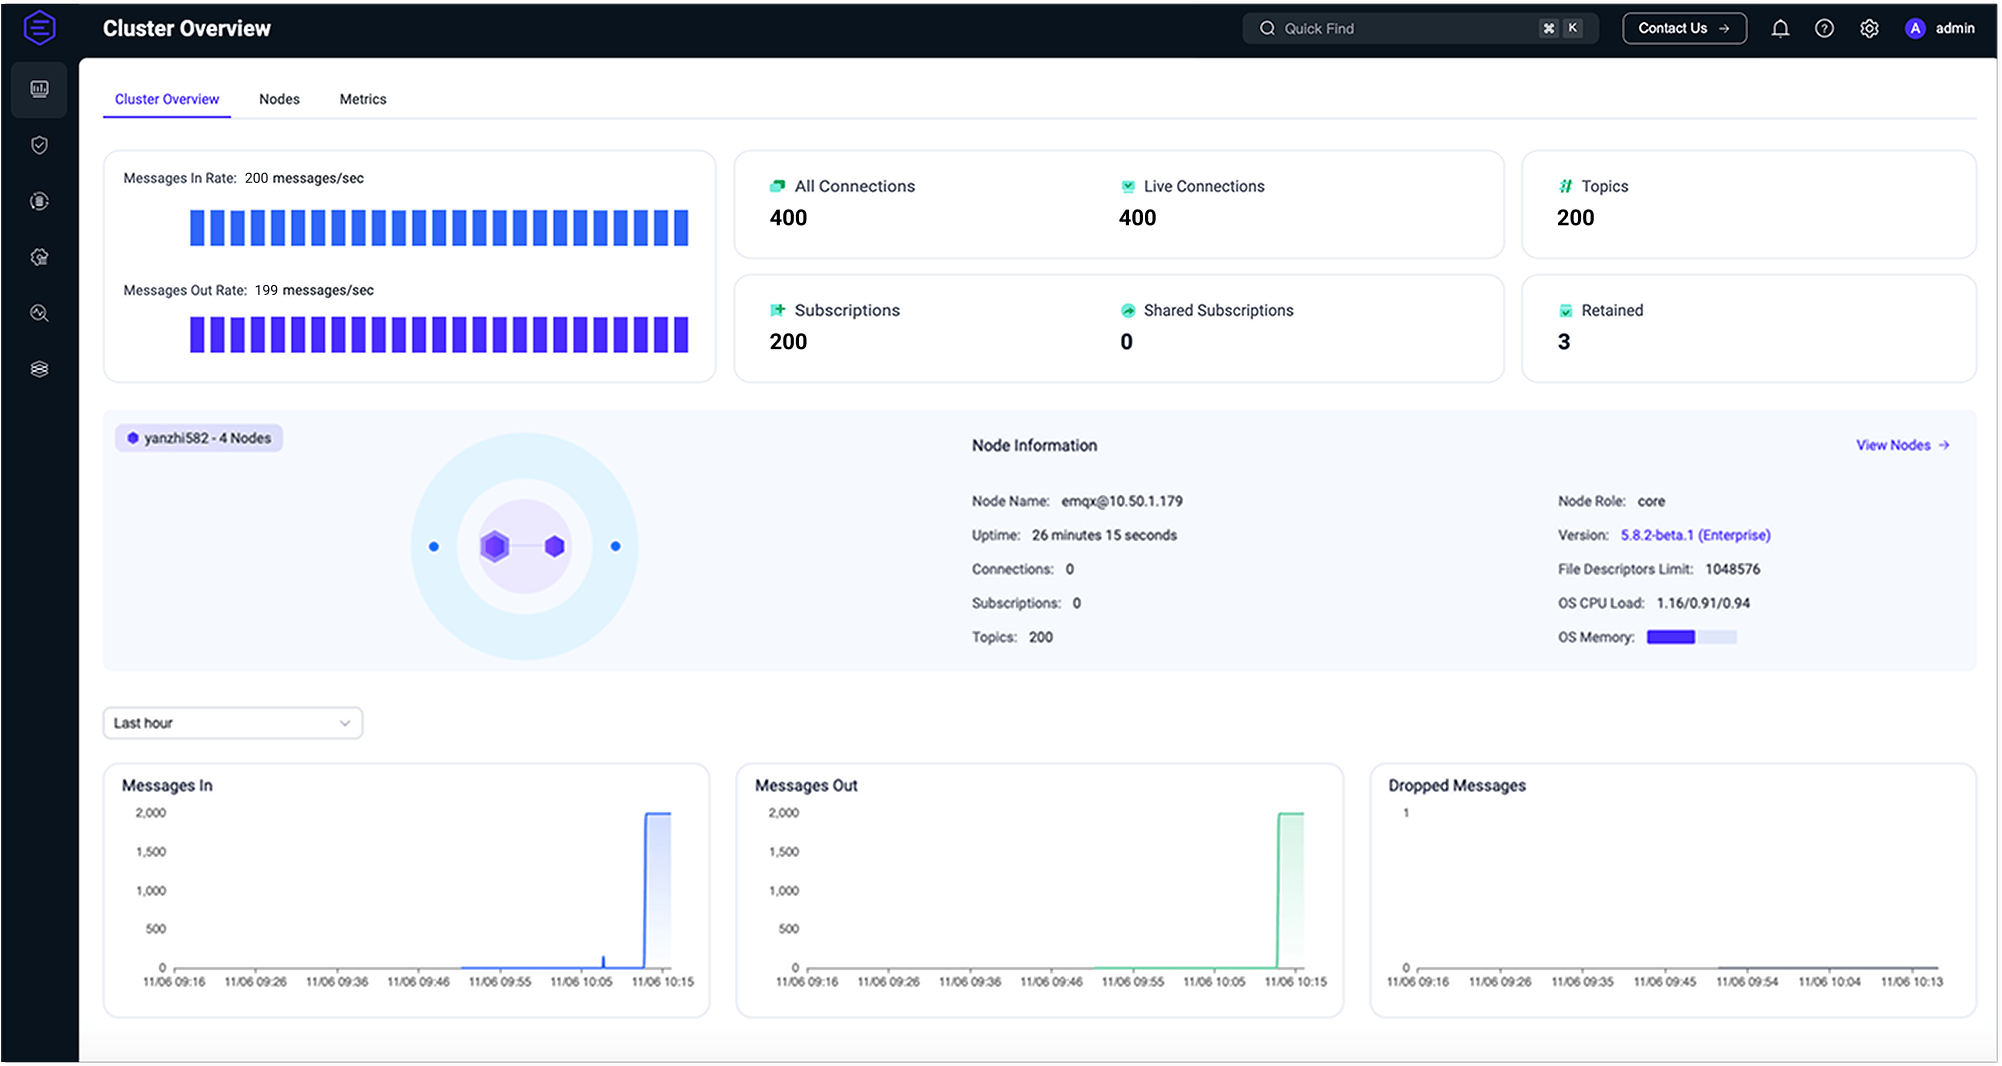
Monitoring
View overall information of the running EMQX cluster, including connection count, subscribed topics, message delivery counts, inbound rates, and outbound rates. It also includes node lists, node information, and various system metric information. Additionally, you can view and manage client connections and subscription data.
Access Control
Add and configure authentication and authorization mechanisms in EMQX visually.
Integration
Utilize a powerful SQL-based rule engine and data integration, or the Flow editor's visual capabilities, for low-code data processing and integration. This helps in real-time extraction, filtering, enrichment, transformation, storage, and validation of MQTT data.
Management
Cluster Settings
Supports online modification and update of MQTT, log, listeners, and other configuration items, which take effect immediately after successful updates.
Advanced MQTT
Manage and configure topic rewriting, automatic subscription, delayed publishing, and file transfer functionalities.
Extensions
Custom plugin integration to extend connection protocols through built-in gateway management and configuration. Also, use Hooks to modify or extend system functionality by intercepting function calls, message passing, and event passing between modules.
Problem Analysis and Diagnostics
In addition to debugging through online MQTT over WebSocket client connections and topic metrics, support is also available for diagnostics and issue discovery using features like slow subscriptions and log trace.
System
Manage and configure user accounts, audit logs, API keys, license settings, and single sign-on functionalities.
Launch Dashboard
EMQX Dashboard is a web application that listens to port 18083 by default. After installing EMQX successfully, you can access and use the EMQX Dashboard by opening http://localhost:18083/ (replace localhost with the actual IP address if deployed on a non-local machine) through your browser.
TIP
EMQX can still be used normally without the Dashboard enabled. The Dashboard just provides the option for users to use it visually.
First Login
For users who have installed EMQX for the first time, you can use the default username admin and default password public to log in web page after opening the Dashboard in your browser.
After logging in for the first time, the system will automatically detect that you are logging in with the default username and password. It will force you to change the default password, which is good for the security of accessing the Dashboard. Note that the changed password cannot be the same as the original password, and it is not recommended to use public as the login password again.
Token-Based Login via URL
Starting from EMQX 5.6.0, the Dashboard supports a token-based login method that allows users to log in directly by embedding authentication information in the URL.
This feature is particularly useful for seamless redirection and integration scenarios where a user should be logged in automatically without entering credentials manually.
How To Use This Login Method
Use the
/loginendpoint to obtain an authentication token. Since the response does not include the username, you will need to manually add it before encoding the full JSON payload.You can perform all steps, including requesting the token, injecting the username, and encoding the result in Base64, in a single command, as shown below:
curl -s -X POST "http://127.0.0.1:18083/api/v5/login" \
  -H 'accept: application/json' \
  -H 'Content-Type: application/json' \
  -d '{"username": "admin","password": "public"}' | jq '.username = "admin"' | base64
Construct the login URL. Embed the encoded string in the
login_metaquery parameter of the Dashboard URL. For example:For EMQX versions before 5.6.0:
bashhttp://localhost:18083?login_meta=BASE64_ENCODED_STRINGThis redirects to the default cluster overview page.
For EMQX version 5.6.0 and later:
bashhttp://localhost:18083/#/dashboard/overview?login_meta=BASE64_ENCODED_STRINGThis allows specifying the target page after login.
This method provides a smooth, pre-authenticated user experience for accessing the EMQX Dashboard. Make sure to handle the token securely and ensure it has appropriate expiration and scope limits.
Reset Password
You can reset your Dashboard login password via the admins command. For details, see CLI - admins.
./bin/emqx ctl admins passwd <Username> <Password>Password Expiration
If the duration of your current Dashboard login password exceeds the configured password expiration period (password_expired_time), you will be prompted to update your password upon login. For details about the password_expired_time setting, refer to the Dashboard Configuration.
Users with the "Administrator" role can also configure the password expiration time using the REST API.
Example:
curl -X 'PUT' \
  'http://admin:ppp@localhost:18083/api/v5/configs/dashboard' \
  -H 'accept: application/json' \
  -H 'Content-Type: application/json' \
  -d '{"password_expired_time": "1d"}'
In this example, the password expiration time is set to 1 day.
Account Lockout and Unlock
To enhance security, the EMQX Dashboard implements an "Account Lockout and Unlock" mechanism. When a user enters the wrong password 5 times within a 5-minute window, their account will be locked for 10 minutes.
Users with the "Administrator" role can manually unlock the account via the CLI by resetting the user's password. After 10 minutes, the account will automatically be unlocked, and the user will be able to log in again normally.
Administrators can also configure the lockout duration and the number of failed attempts required for lockout through the backend settings. For details of the settings, refer to the Dashboard Configuration.
Configure Dashboard
Dashboard listens to the HTTP by default, and the default port number is 18083. Users can enable HTTPS or change the listener port. For more information on how to configure and modify the Dashboard settings, refer to the EMQX Enterprise Configuration Manual.