Cluster Settings
EMQX provides hot configuration capabilities, which can dynamically modify the configuration at runtime without restarting the EMQX node. The EMQX Dashboard provides visual configuration pages with the hot configuration functions, allowing you to easily modify the configuration of EMQX.
The Cluster Settings module provides the following submodules:
- MQTT Settings
- Cluster
- Namespace
- Listeners
- Logging
- Monitoring
- Cluster Linking
MQTT Settings
The MQTT Settings page provides MQTT protocol-related configuration functions. On this page, you can configure various MQTT-related parameters, including:
General
The General tab page contains general basic configuration items for the MQTT protocol, such as idle timeout, maximum packet size, maximum client ID length, maximum topic levels, and maximum allowed QoS levels.
Session
The Session tab page includes configuration items related to MQTT session management, such as session expiry interval (only supported for non-MQTT 5.0 connections; MQTT 5.0 connections need to be configured on the client side), maximum subscription count, maximum flight window, and whether to store QoS 0 messages.
Durable Sessions
The Durable Sessions tab page includes configuration items related to the MQTT Durable Sessions feature, such as message retention duration, message query batch size, idle poll interval, session heartbeat interval, etc.
Retainer
The Retainer tab page contains MQTT protocol-related configuration items for retained messages, such as whether to enable retained messages, message storage type and method, maximum number of retained messages, retained message payload size, and message expiry interval. For more details, refer to Configuring Retained Messages.
When retained messages are disabled, existing retained messages will not be deleted.
System Topic
The System Topic tab page provides configuration items for EMQX's built-in system topics. EMQX periodically publishes operational status, usage statistics, and real-time client events to system topics prefixed with $SYS/. When clients subscribe to these topics, EMQX will publish related information to those topics. Configuration items for system topics include message publish interval, heartbeat interval, etc.
Force Shutdown
The Force Shutdown tab allows you to configure the automatic shutdown behavior based on resource usage thresholds. This feature safeguards the EMQX from potential instability due to excessive resource consumption, such as message queue length or heap size.
You can configure settings for the following fields in the Force Shutdown tab page:
- Enable Force Shutdown: This toggle switch enables or disables the force shutdown feature. When enabled, the system automatically triggers the shutdown of client processes if the specified resource thresholds are surpassed. It is enabled by default.
- Max Heap Size: Specifies the maximum allowed heap size for the system. If the heap size surpasses this limit, the system will initiate a forced shutdown to maintain stability. The default value is
32 MB. - Max Mailbox Size: Defines the maximum allowed length for the mailbox message queue. If the queue exceeds this length, a forced shutdown will be triggered to prevent system overload. The default value is
1000.
Cluster
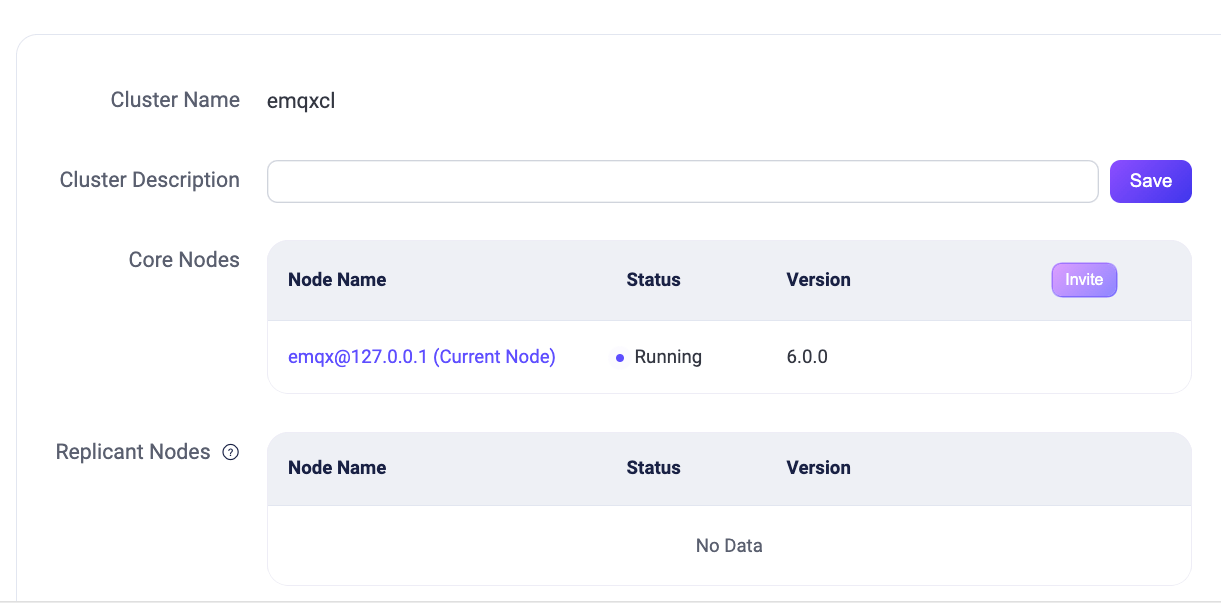
The Cluster configuration page allows you to manage EMQX cluster nodes, including viewing details, inviting new nodes, and removing existing ones.
Note
If you are using the EMQX Community Edition, inviting new nodes is not supported. The clustering feature is available during the trial period. After the trial ends, a commercial license is required; otherwise, the feature will be disabled.
Starting from EMQX v6.0.0, you can now add a Cluster Description to help identify the purpose or environment of the cluster. Enter a meaningful description in the input field and click Save to apply.
After saving, the Cluster Description appears at the top of the Dashboard for quick reference across pages, such as Cluster and Cluster Overview. Click the edit icon to return to the Cluster page and update the description.
To view node details, click the node name. You will be redirected to the Cluster View page for detailed information.
To invite a node, click Invite, enter the node's IP address or hostname in the Node Name field, and click Confirm.
To remove a node, click Remove. A confirmation dialog will appear before the node is removed from the cluster.

EMQX also supports creating and managing clusters using the Command Line Interface (CLI). For detailed information, see Create and Manage Cluster.
Namespace
The Namespace feature in EMQX provides logical isolation for different client groups within a single cluster. You can manage namespaces on the Namespace page. For more detailed guidance on how to manage and configure namespaces, refer to the Namespace.
Listeners
The Listeners displays a list of listeners by default. EMQX provides four common listeners:
- TCP listener using port 1883
- SSL/TLS secure connection listener using port 8883
- WebSocket listener using port 8083
- WebSocket secure listener using port 8084

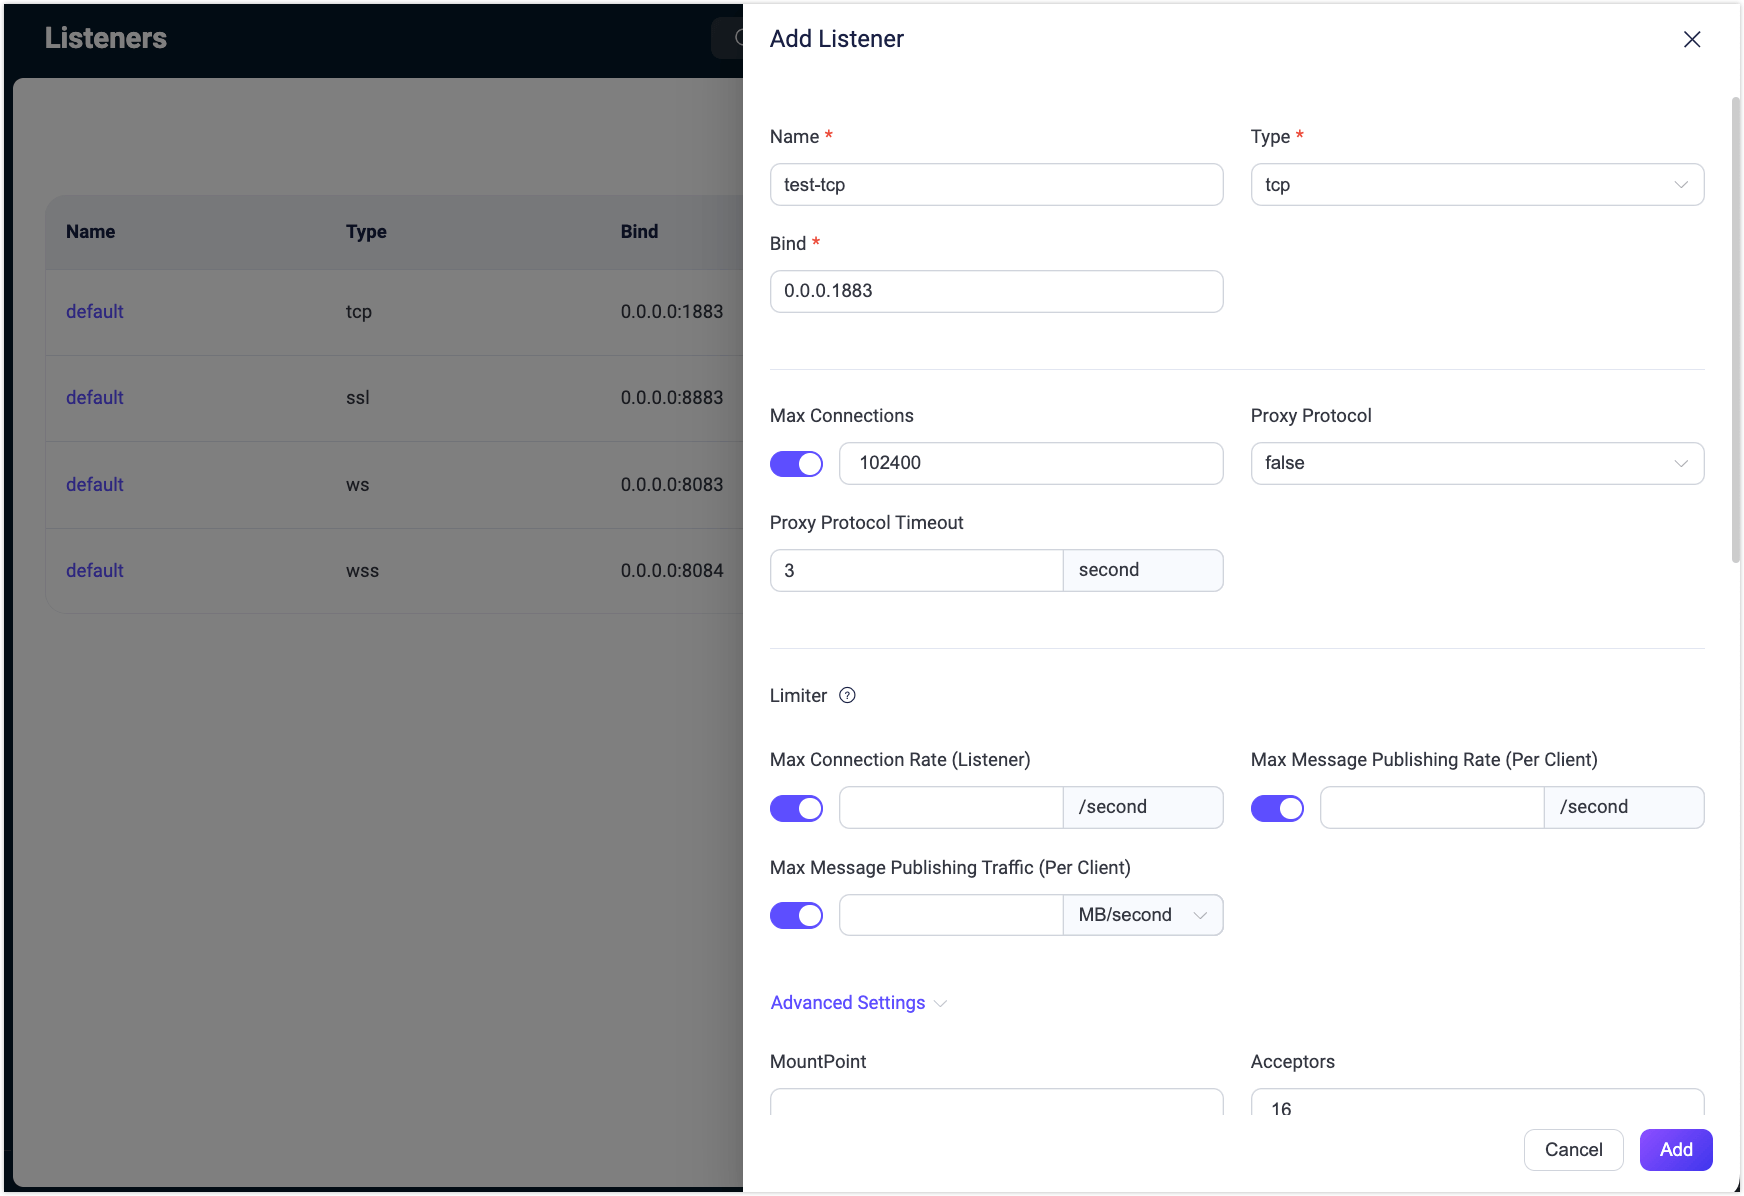
Typically, you can use these default listeners by specifying the corresponding port and protocol type. To add another type of listener, click the +Add Listener button in the top-right corner to create a new listener.
Add Listener
In the Add Listener pop-up panel, you will see a form for adding a listener, which contains the basic configuration items. You can enter a name for the listener to identify it, choose the listener type (TCP, SSL, WS, WSS), and enter the listener address (IP address and port number). Using the IP address can restrict the listener's access range, or you can directly specify a port number.

Rate Limiting
In the Limiter section of the Add Listener form, you can limit the message receiving and publishing rates during EMQX operation, such as:
- Maximum Connection Rate (Listener)
- Maximum Message Publishing Rate (Per Client)
- Maximum Message Publishing Rraffic (Per Client)
Configuring rate limiting ensures the stability of the system and network when message data overload or excessive client requests occur.
For more detailed configuration on rate limiting, refer to Rate Limit.
For more details on listener configuration, refer to EMQX Enterprise Configuration Manual.
Manage Listeners
After adding a listener, you can see it in the list. Click on the listener's name to enter the editing page, where you can modify or delete the listener configuration. Note that the listener name, type, and listener address cannot be modified in the settings.
Click the Delete button on the editing page to remove the listener. When deleting a listener, you will need to enter the listener's name to confirm the deletion. You can also toggle the enable switch to enable or disable the listener. The list also shows the number of connections for each listener.
Warning
Modifying and deleting listeners is a risky operation and should be done carefully. If a listener is updated or deleted, client connections on that listener will be disconnected.
Logging
The Logging page includes tabs for Console Log, File Log, Log Throttling, and Audit Log.
EMQX supports two types of log output: console log and file log. You can choose either or both types according to your needs. In the corresponding configuration page, you can enable or disable the log handler, set the log level, log format type, and for file logs, specify the log file path and log name. For more detailed configuration instructions on logs, refer to Configure Logging via Dashboard.
In the Log Throttling tab page, you can configure the time window for log throttling. For more information on log throttling, refer to Log Rate Limiting.
In the Audit Log page, you can enable or disable the audit log feature in the EMQX and configure it. For detailed configuration instructions, refer to Audit Log.
Monitoring
Note
The Monitoring feature is only available in the EMQX Enterprise edition.
The Monitoring page contains two tabs:
- System: Depending on the user's needs, the settings for the Alarms function, such as alarm thresholds, check intervals, etc., can be adjusted to a certain extent according to user needs.
- Integration: Provides configuration for integration with third-party monitoring platforms.
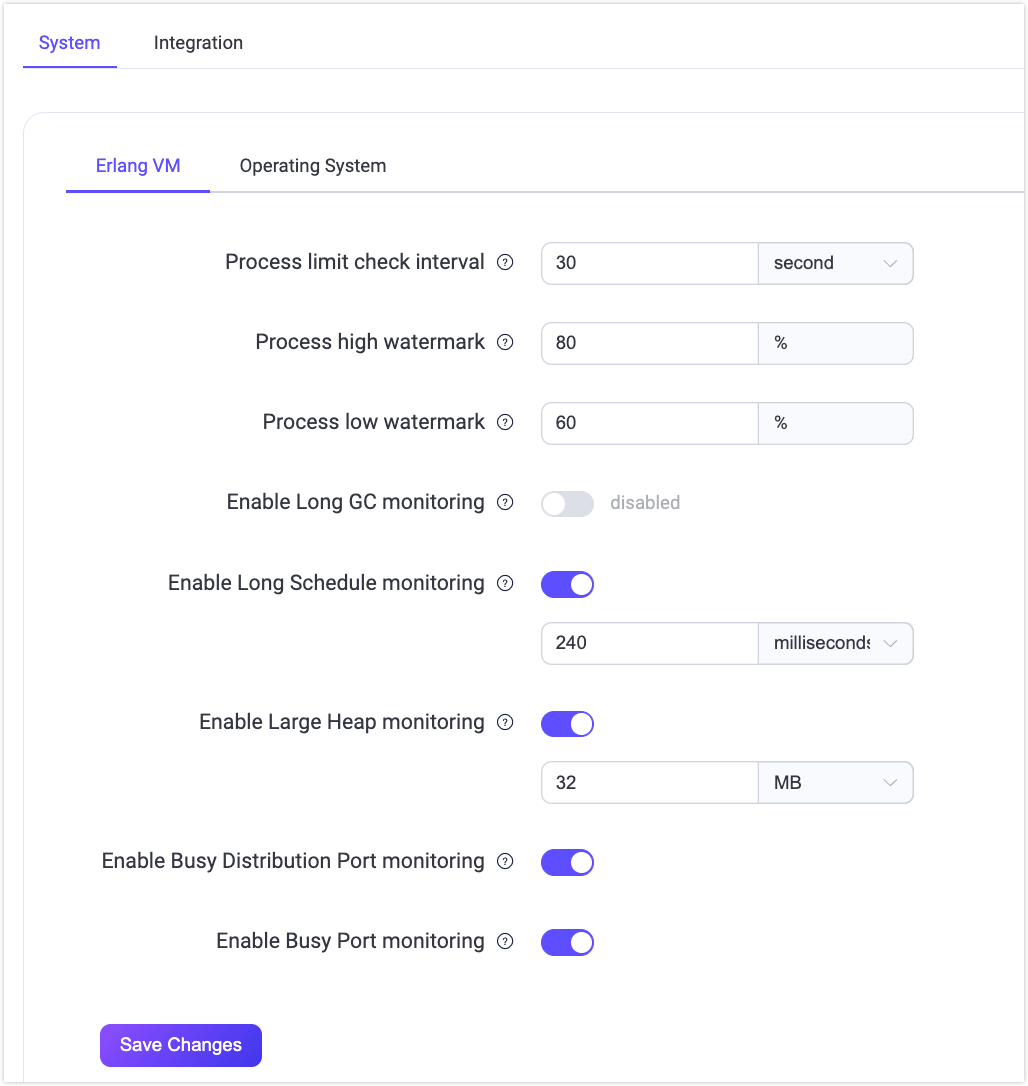
System
If the default value of the current alarm trigger threshold or alarm monitoring check interval does not meet the actual needs, you can adjust the settings on this page. The current settings are divided into two modules: Erlang VM and Operating System, the default values and descriptions of each configuration item can be found in Alarms.

Integration
This page mainly provides integration configurations with third-party monitoring platforms. Currently, EMQX supports integration with Prometheus, OpenTelemetry, and Datadog.
When using the Prometheus third-party monitoring service, you can quickly enable the configuration on this page and set parameters such as the push data address and data reporting interval. You can directly use the API /prometheus/stats provided by EMQX to get monitoring data. When using this API, no authentication information is required. Please refer to Prometheus for specific API.
In most cases, you do not need to use Pushgateway to monitor the metrics data of EMQX. And you can choose to configure a Pushgateway service address to push the monitoring data to Pushgateway, and then Pushgateway pushes the data to the Prometheus service. Click to view When to use Pushgateway.
On the bottom of the page, click the Help button, select the default or use the Pushgateway method, configure the address or API information of the relevant service according to the provided usage steps, and then quickly generate the corresponding Prometheus configuration file. Finally, use this configuration file to start the Prometheus service.
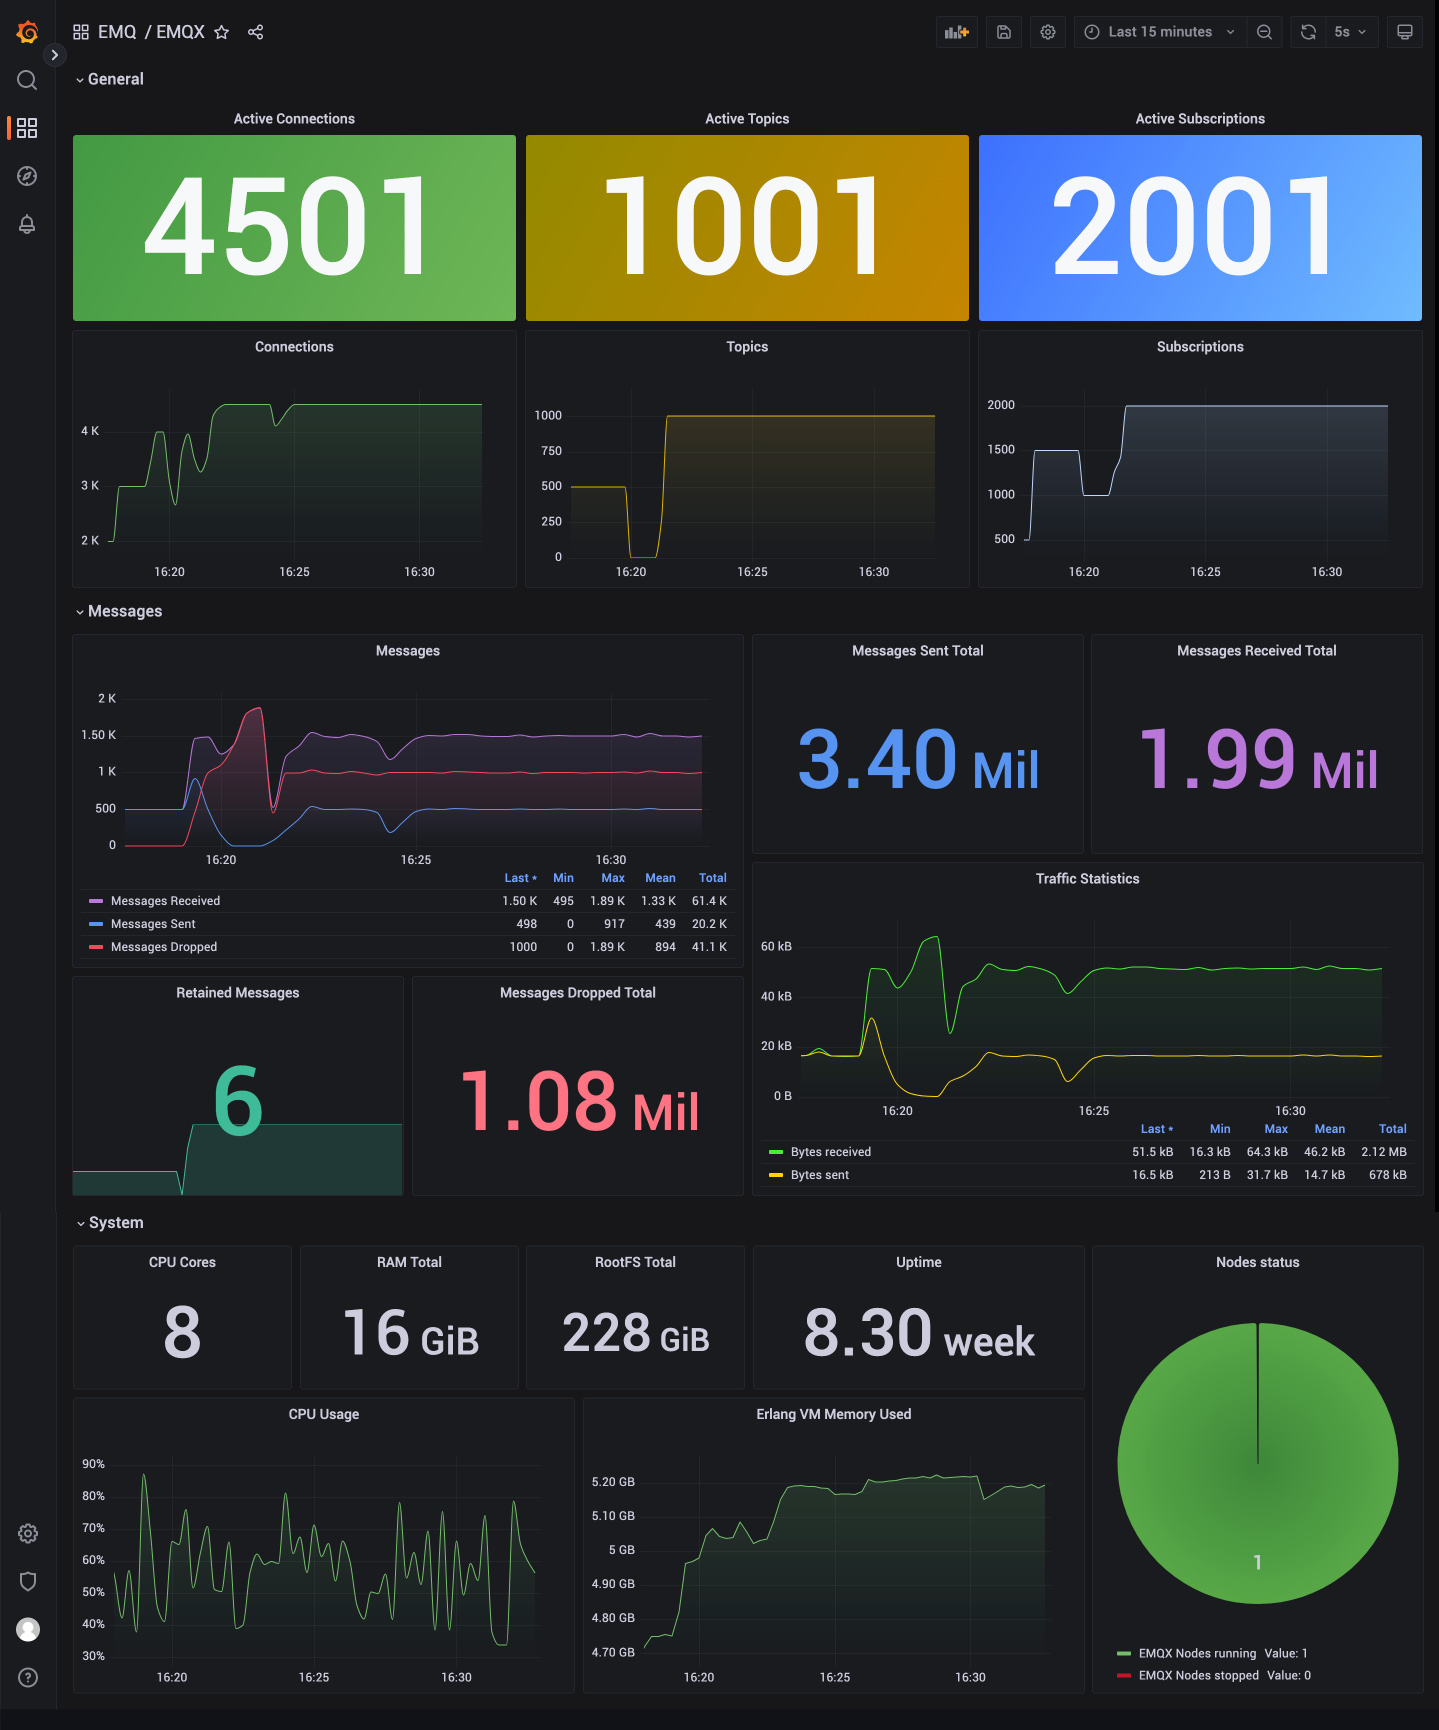
Users can customize and modify the monitoring data in Grafana according to their needs. After starting the Prometheus service, you can click the Download Grafana Template button at the end of the help page to download the configuration file of the default dashboard provided by us. Import the file into Grafana, and we can view the monitoring data of EMQX through the visualization panel. Users can also download the template from the Grafana official website.

For detailed configuration of OpenTelemetry and Datadog integration, refer to Integrate with OpenTelemetry and Integrate with Datadog.
Cluster Linking
The Cluster Linking feature allows multiple independent EMQX clusters to be connected, enabling clients in geographically dispersed clusters to communicate with each other. Users can create and configure cluster links on this page. For detailed guidance on creation and configuration, refer to EMQX Cluster Linking.