Integrate with OpenTelemetry
OpenTelemetry is an observability framework and toolkit designed to create and manage telemetry data such as traces, metrics, and logs. Crucially, OpenTelemetry is vendor- and tool-agnostic, meaning that it can be used with a broad variety of Observability backends, including open source tools like Jaeger and Prometheus, as well as commercial offerings.
EMQX 5.2 has built-in support for pushing metrics directly to the OpenTelemetry Collector over the gRPC OTEL protocol. The Collector can then route, filter, and transform the data to any desired backend for storage and visualization.
This page introduces how to integrate OpenTelemetry with EMQX through EMQX Dashboard and view EMQX metrics through Prometheus. Future versions of EMQX will also integrate trace and log data with the Collector, enabling full OpenTelemetry support.
                                       -> StatsD
                                       -> ElasticSearch
       GRPC                            -> InfluxDB
EMQX    -->   Opentelemetry Collector  -> Prometheus
       OTEL Protocol                   -> Datadog
                                       -> Amazon CloudWatch
                                       -> Any open source or vendor backend of your choice
Prerequisites
Before integrating with OpenTelemetry, you need to deploy and configure OpenTelemetry and Prometheus.
- Deploy OpenTelemetry Collector.
- Configure Collector's gRPC receiving port (default 4317) and Prometheus metrics exporting port (8889).
# otel-collector-config.yaml
receivers:
  otlp:
    protocols:
      grpc:

exporters:
  prometheus:
    endpoint: "0.0.0.0:8889"

processors:
  batch:

service:
  pipelines:
    metrics:
      receivers: [otlp]
      processors: [batch]
exporters: [prometheus]- Deploy Prometheus.
- Configure Prometheus to scrape metrics collected by the Collector.
# prometheus.yaml
scrape_configs:
  - job_name: 'otel-collector'
    scrape_interval: 10s
    static_configs:
      - targets: ['otel-collector:8889'] # emqx metrics
      - targets: ['otel-collector:8888'] # collector metrics
Configurate Integration via Dashboard
You can use EMQX Dashboard to configure EMQX's integration with OpenTelemetry. In the EMQX Dashboard, click Management -> Monitoring on the left navigation menu, then click the Integration tab for the configuration.
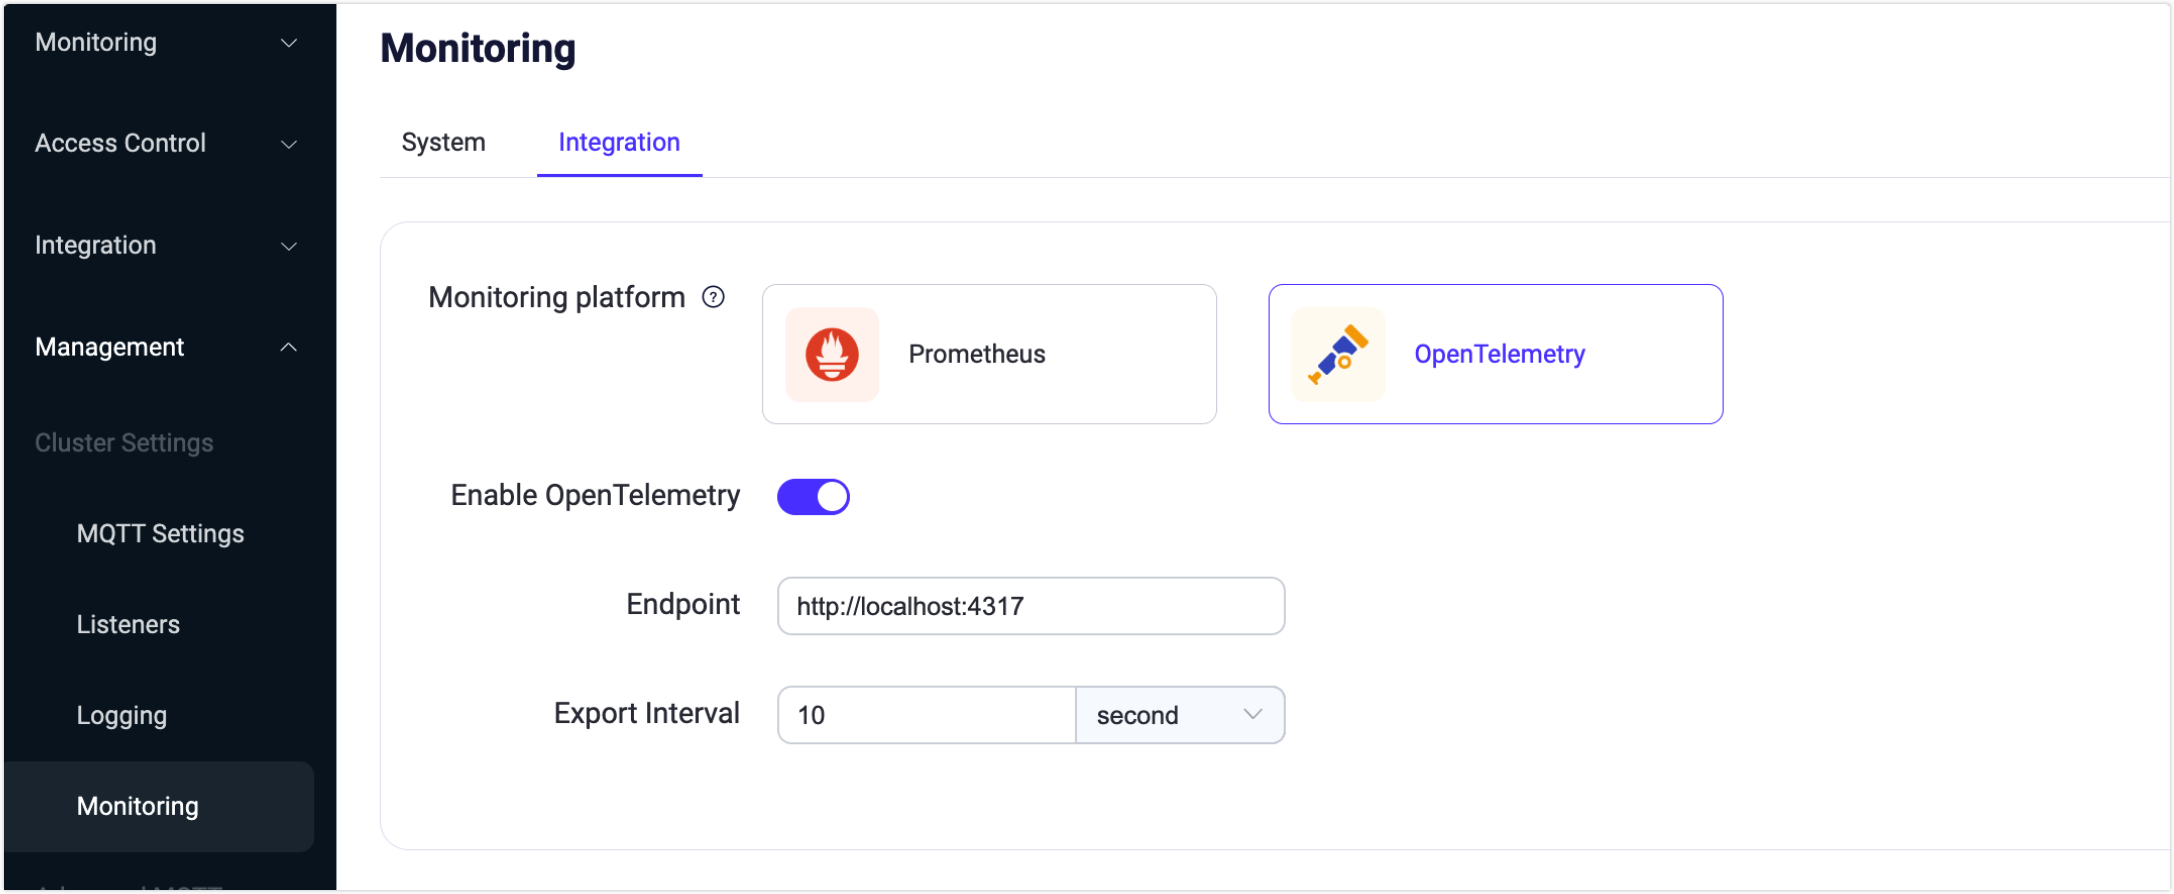
- EndPoint: Collector's gRPC address;
http://localhost:4317by default. - Export Interval: Interval to push metrics to Collector;
10seconds by default.
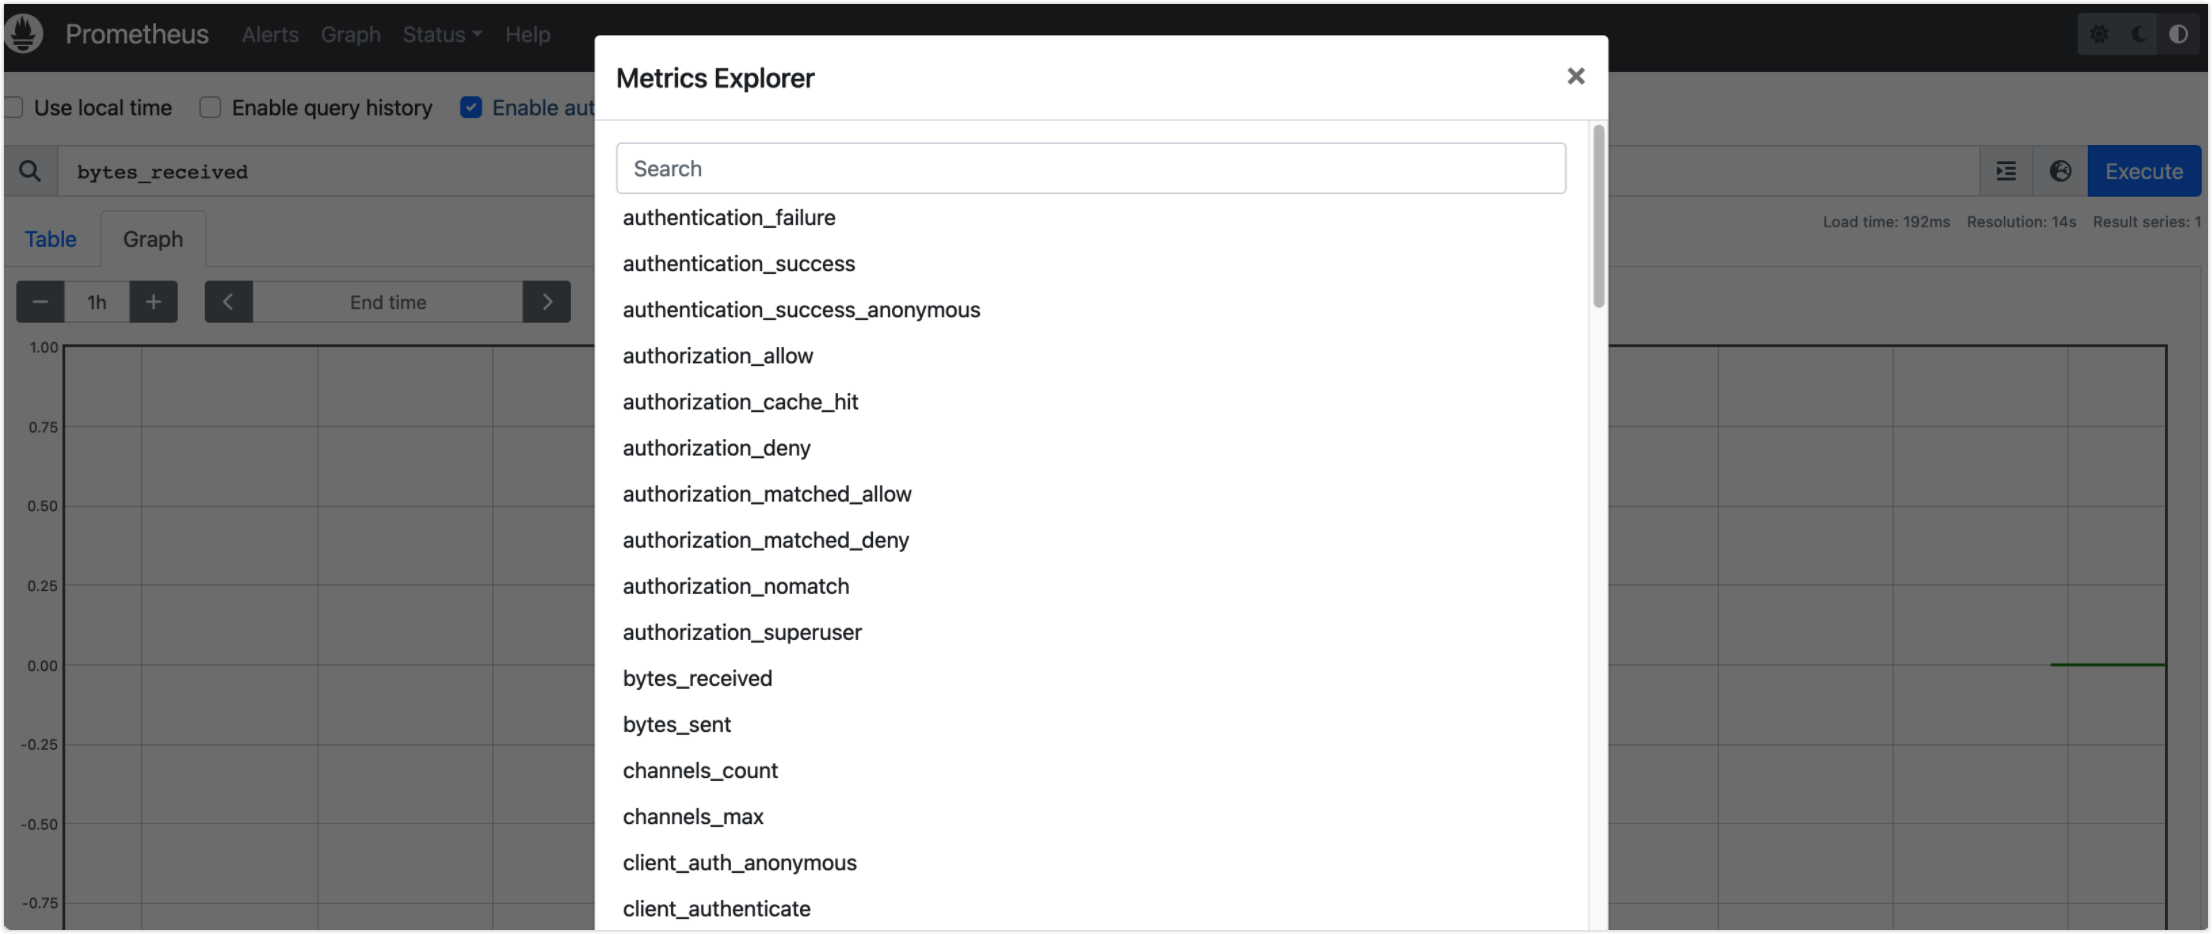
Visualize EMQX Metrics in Prometheus
The EMQX metrics can be viewed in Prometheus web console (http://otel-collector:9090):