Quick Start
Environment setup
Running Neuron-plus In Docker
- Get the Docker image
Get the neuron-plus image at docker hub.
## pull neuron
$ docker pull emqx/neuron-plus:latest- Start the Docker container
## run neuron-plus
$ docker run -d --name neuron-plus -p 7000:7000 -p 7001:7001 --privileged=true --restart=always emqx/neuron-plus:latest
Running EMQX In Docker
We need to deploy an MQTT Broker to do the connection processing of messages, here we recommend using EMQX. Again EMQX can be installed and used quickly using a Docker container.The latest version can be obtained from the EMQX.
- Get the Docker image
docker pull emqx/emqx:4.4.3- Start the Docker container
docker run -d --name emqx -p 1883:1883 -p 8081:8081 -p 8083:8083 -p 8084:8084 -p 8883:8883 -p 18083:18083 emqx/emqx:4.4.3Install Modbus Simulator
Install PeakHMI Slave Simulator, download the software from the PeakHMI official website. After installation, open the Modbus TCP slave.
TIP
Disable the firewall on Windows, otherwise the Neuron may not be able to connect to the simulator.
Run for the First Time
When the installation environment is ready, open a web browser and enter the address and port number where you are running Neuron to get into the administration console page, the default port number is 7000, e.g http://127.0.0.1:7000。
Step 1 Login
The first screen is the login page, where users can login using their username and password as shown below.
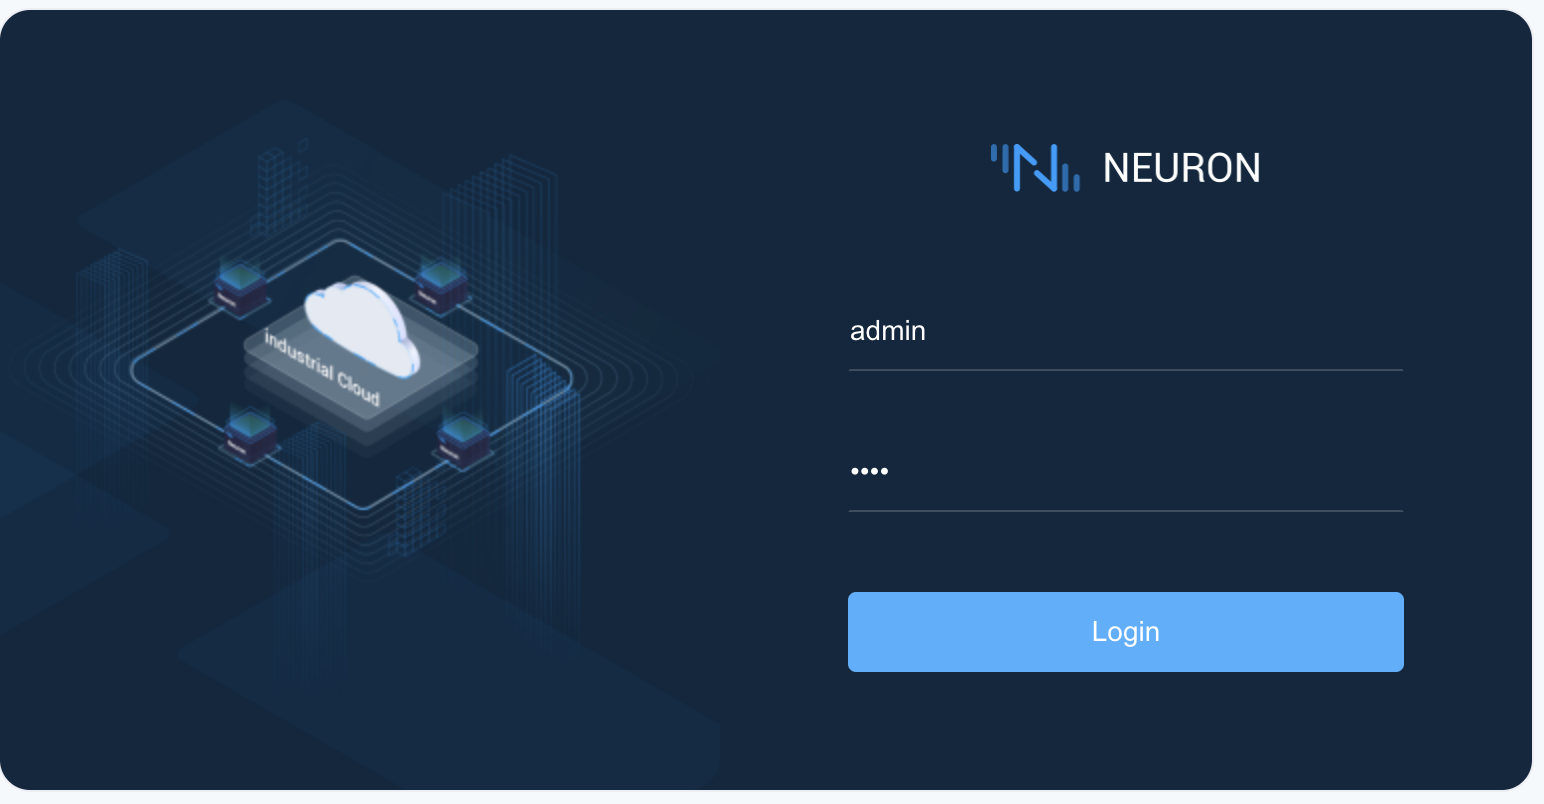
To login to dashboard control panel,
- Fill in default username
admin. - Fill in default password
0000. - Click on the
Loginbutton.
Step 2 Add southbound plugin modules for device drivers
Click on Southbound Device in the Configuration menu to show the Southbound Device Management screen, where no devices have been found in this case, we now create a Modbus TCP device, as shown below.
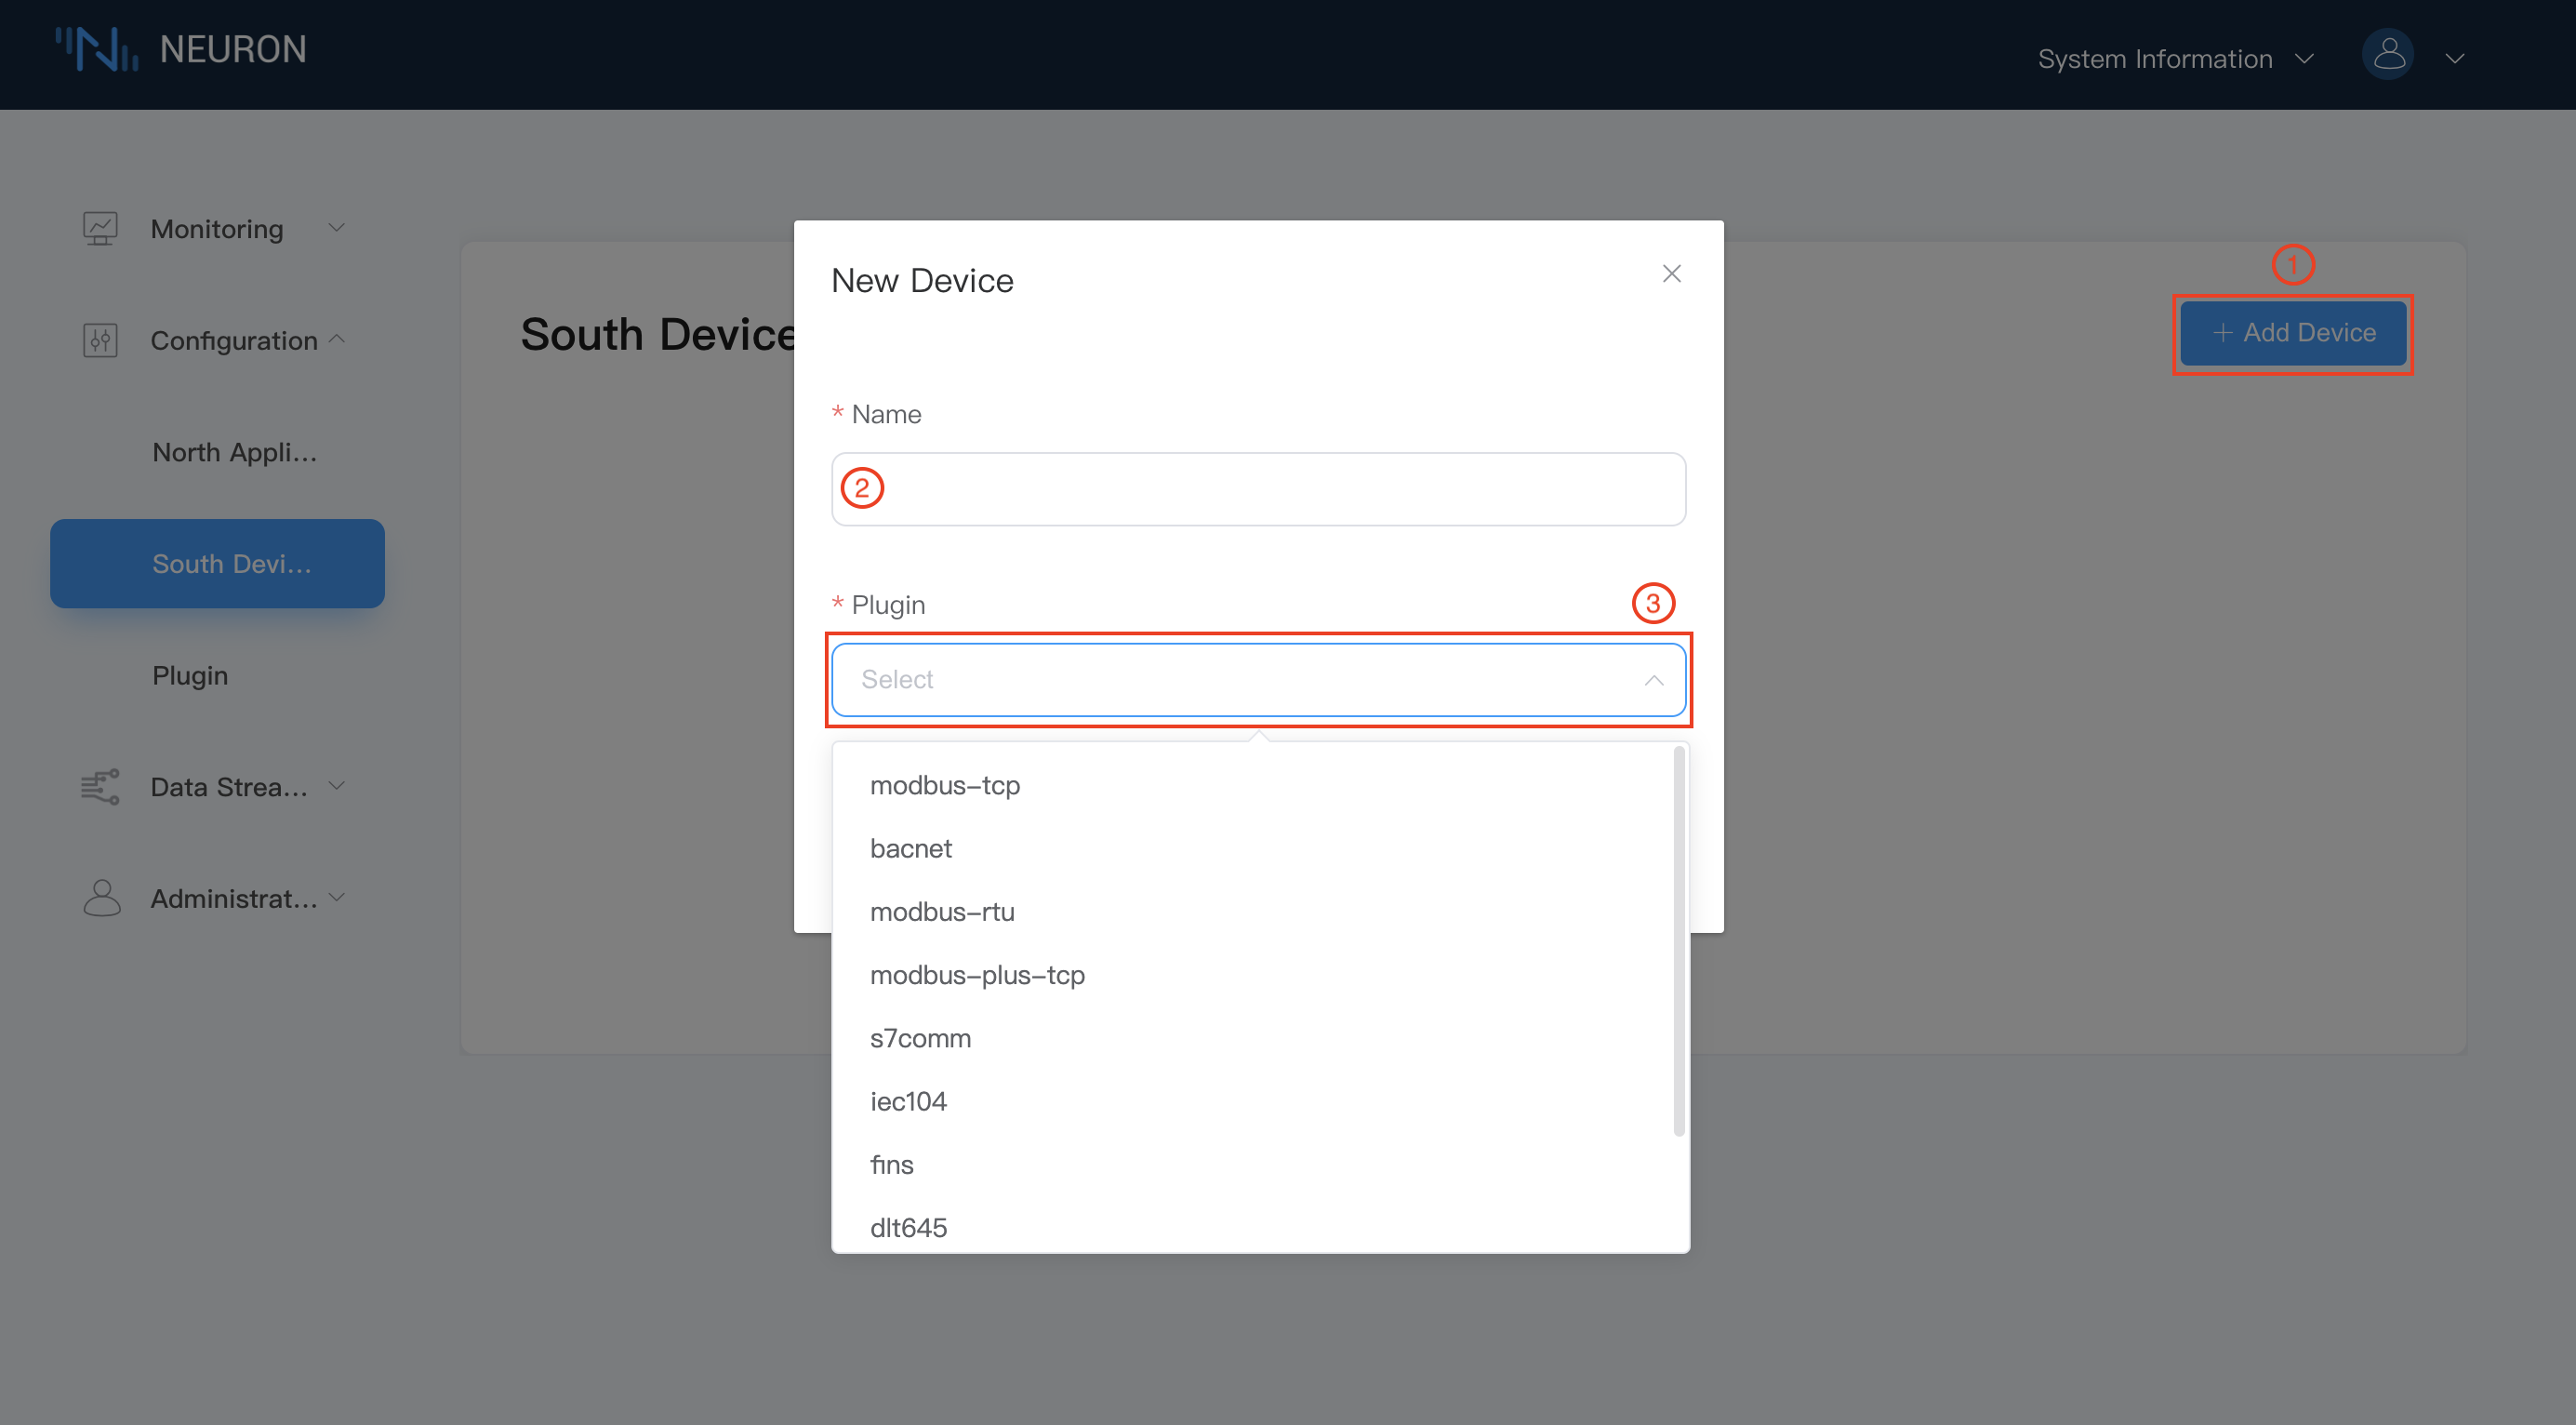
To add a new southbound device,
- Click on the
Add Devicebutton at top right corner to show New Device dialog box. - Fill in the device name, e.g. modbus-tcp-1.
- Click on the drop-down box, which shows all the southbound driver protocols available for this software version, in this case we choose modbus-tcp plugin module.
- Click on
Createbutton to create the device.
TIP
You suppose to install a valid trial or commercial license to be able selecting the pluggable modules other than modbus-tcp. Only modbus-tcp is an open source pluggable module in the list.
Step 3 Manage southbound device node list
After the device has been successfully created, the new device node information will appear in the southbound device screen, as shown below.
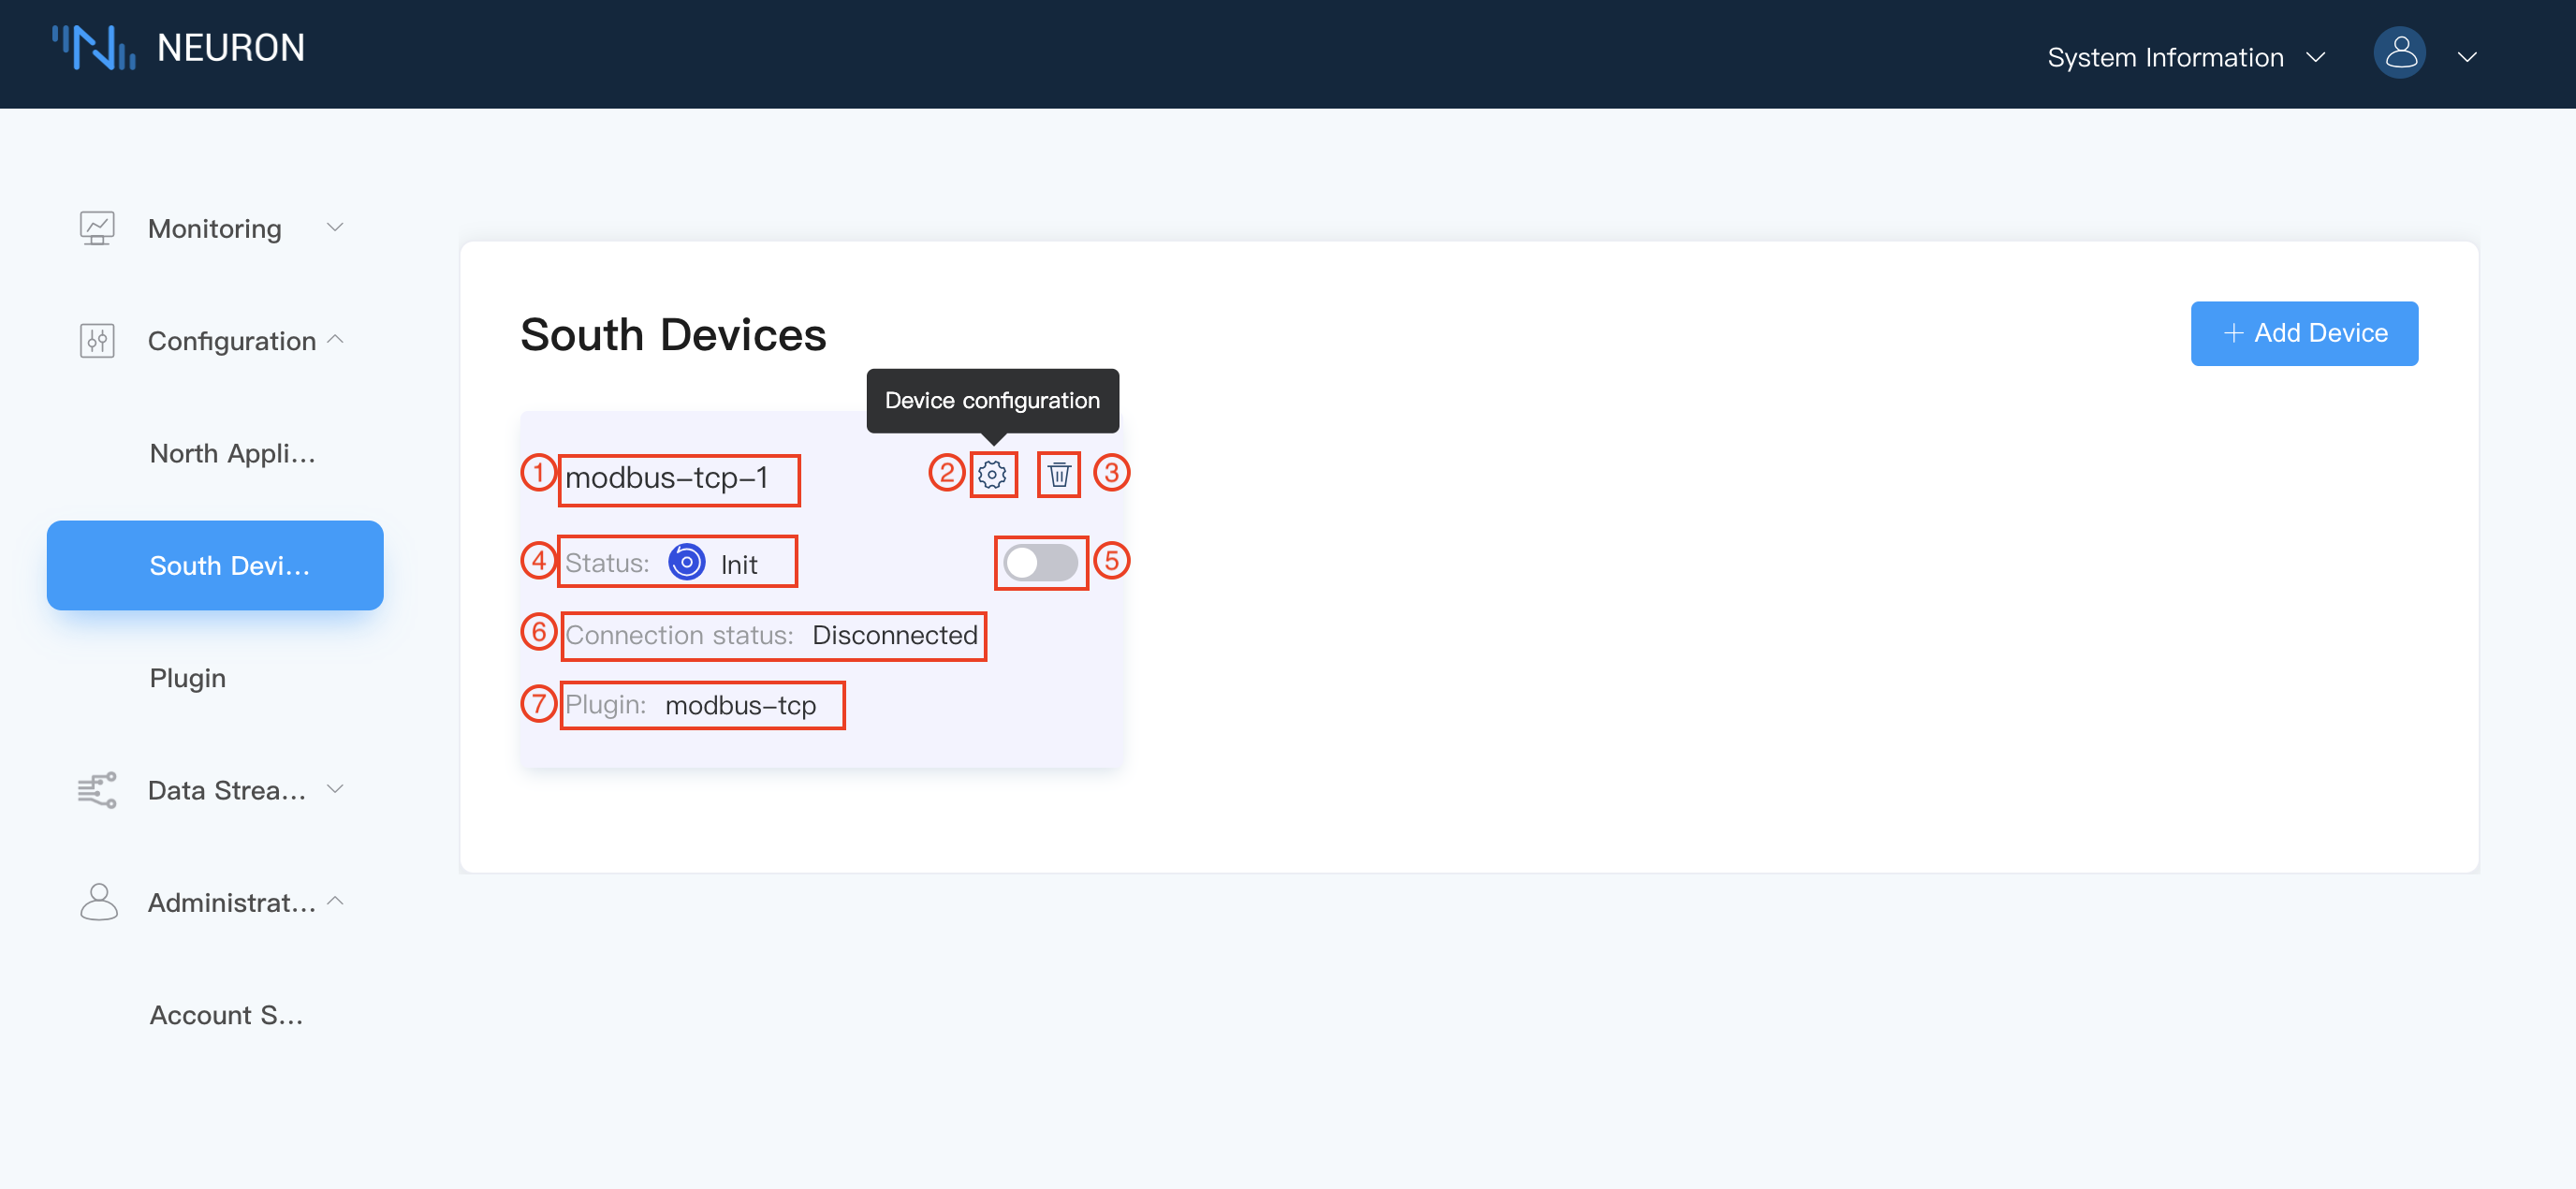
The device node contains the following information
- Device Name - the unique name you give to the device.
- Device Configuration Button - click on this button to show the device configuration screen.
- Delete Button - click on this to remove this device from southbound device list.
- Node Status - show the current status of device node, see below for details.
- State Change Button - switch on to connect to device.
- Connection Status - show connection status to device.
- Plugin Module Name - the name of plugin module used for this device.
There are five working status for each south device node.
- Init, the initial status for the first creation of southbound devices.
- Setup, when the configuration of device node is started, it goes to setup state.
- Ready, after successfully configuring the device node, it goes to ready state.
- Running, when the device node is started and is collecting data from device. it goes running state.
- Stop, when the device node is stopped or for reason it can't connect to device, it goes to stop state.
Step 4 Setup southbound device parameters
Click on Device Configuration Button in device node to configure the southbound device parameters, as shown below.
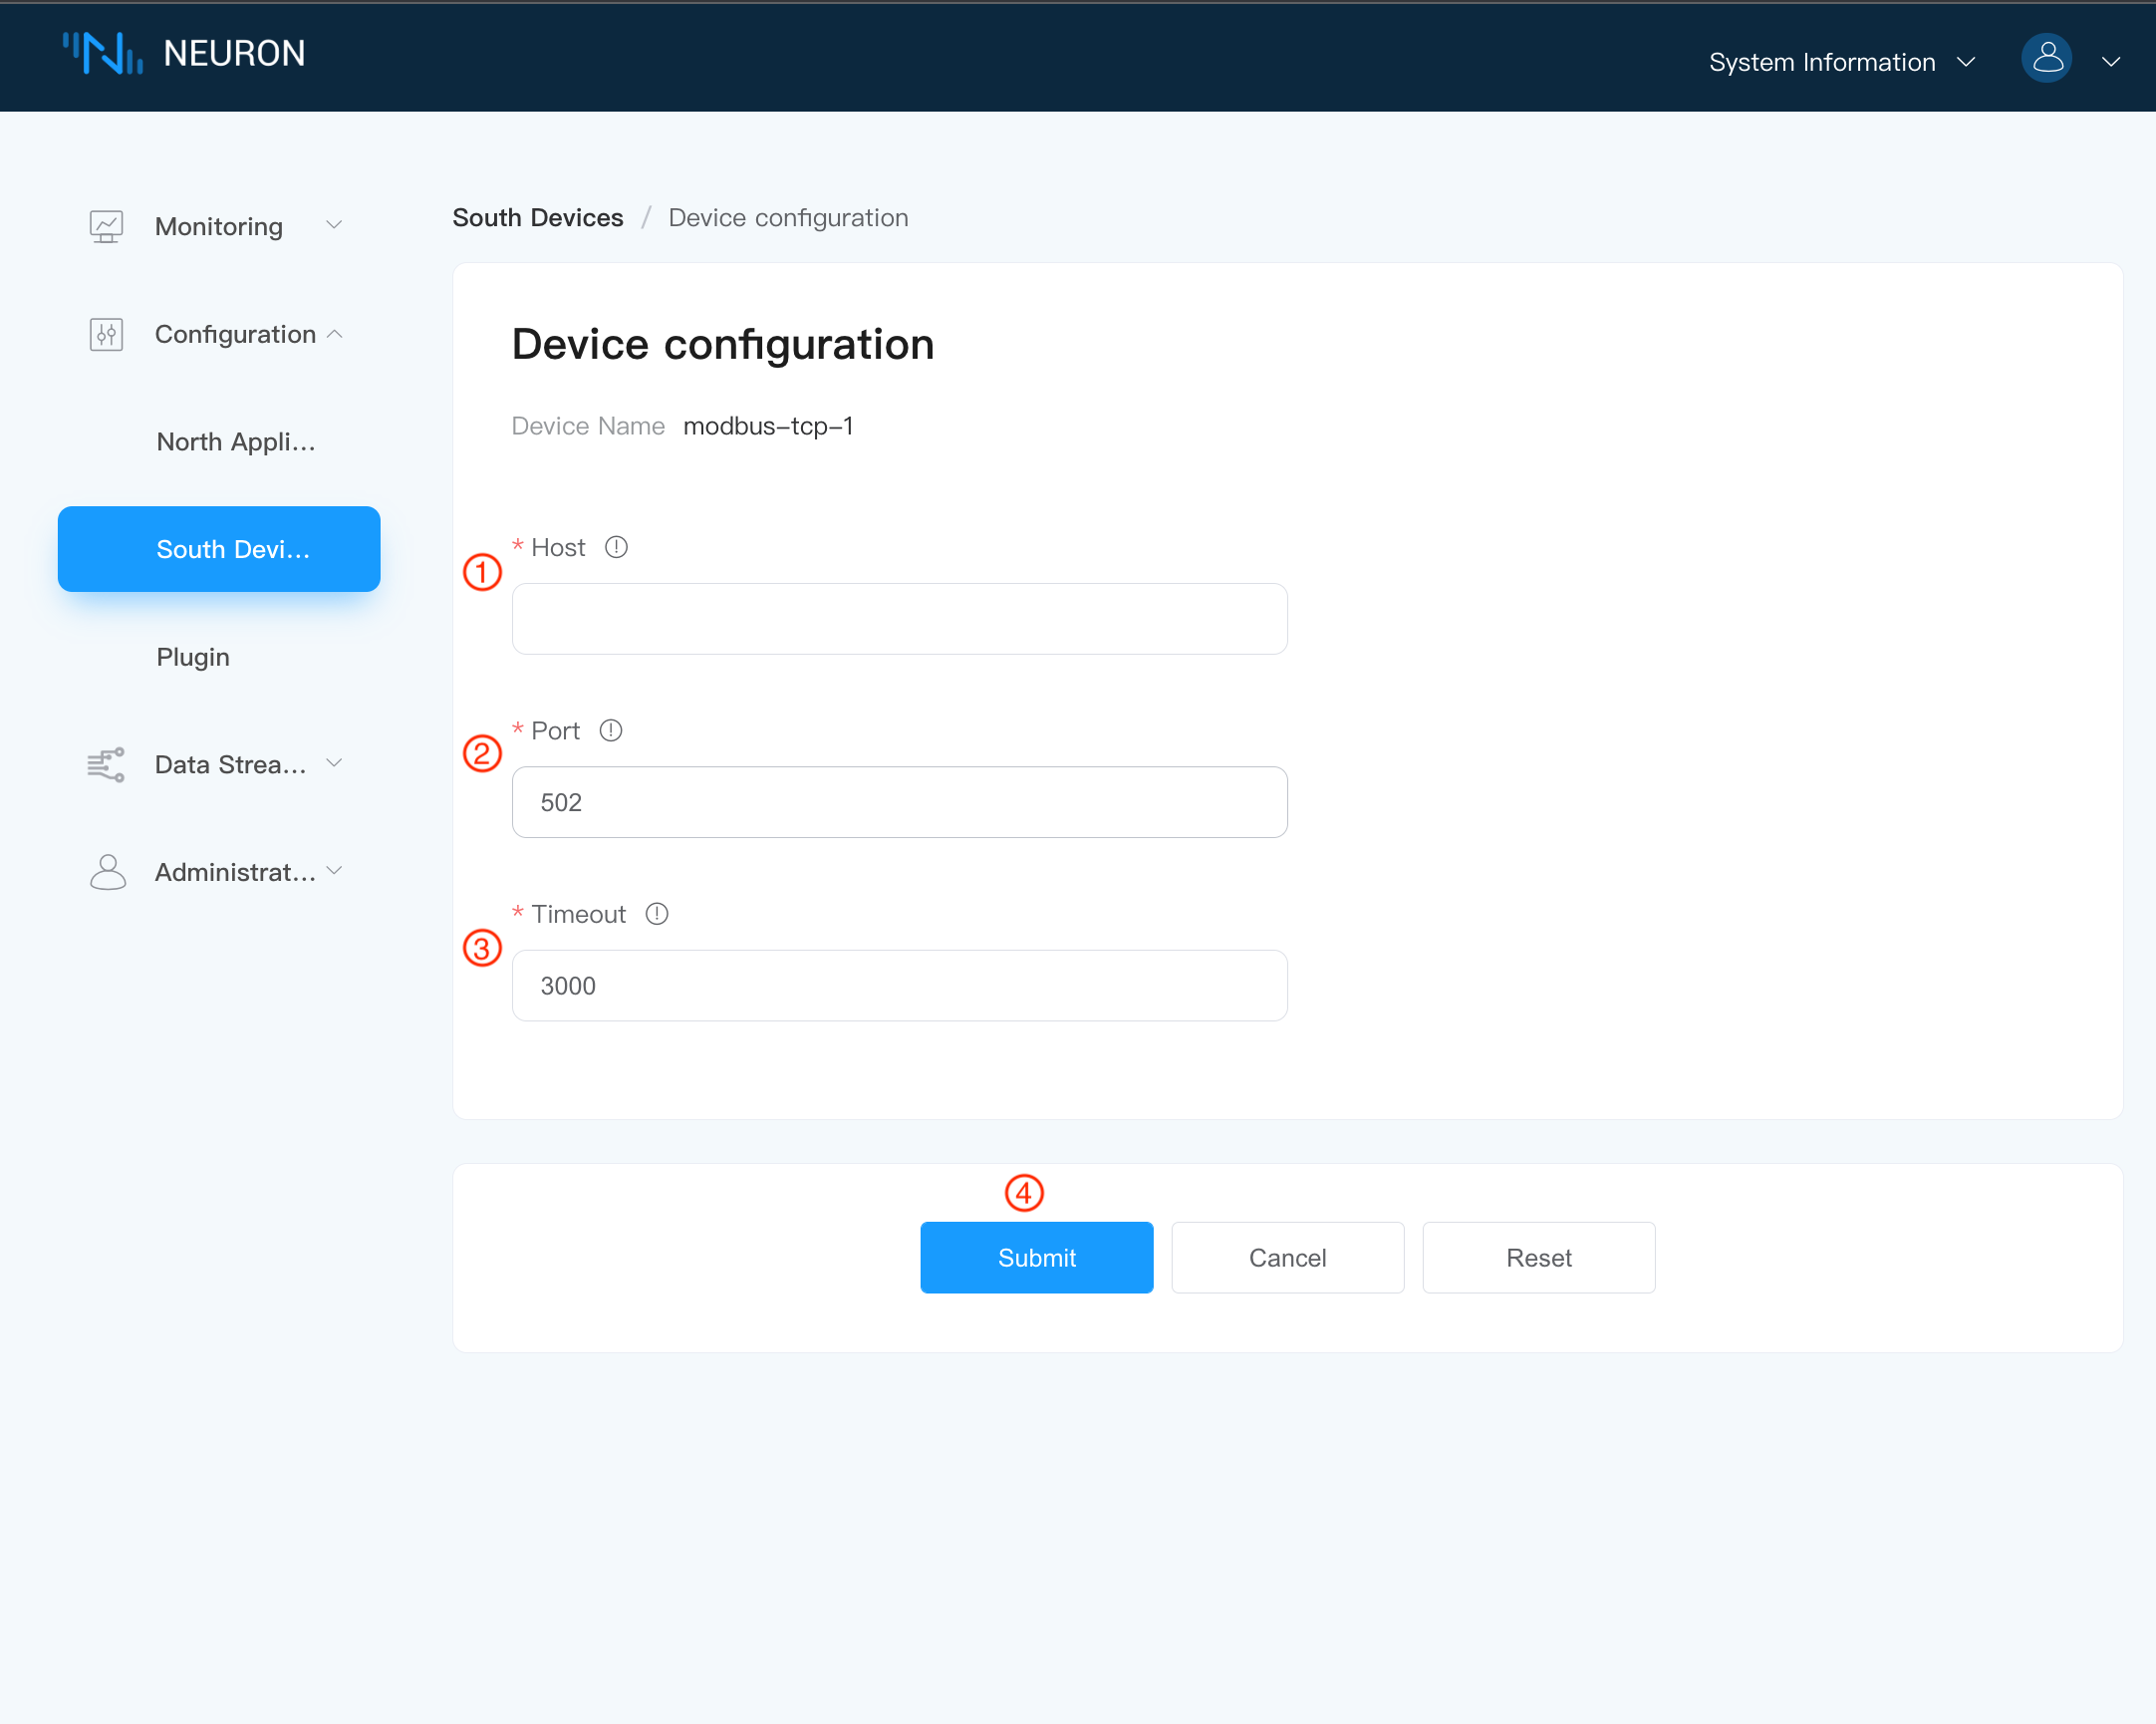
Items with * are required, and each item is followed by a field description key. Hovering over on exclaimation mark will display a detailed description.
To setup southbound device parameters,
- Fill in the Host IP running the Modbus simulator.
- Fill in the Port number of the Modbus simulator, the default is 502.
- Fill in the request timeout, the default is 3000.
- Click
Submitto complete the device configuration and the device card automatically enters the state of Running.
TIP
The running Neuron instance and the simulator must be under the same network segment.
Different drivers have different configuration parameters. For detailed driver configuration parameters, please refer to Module Setting.
Step 5 Create groups for device node
Click on any blank space in the device node to enter the Group list management screen, where this time will show an empty list. as shown below.
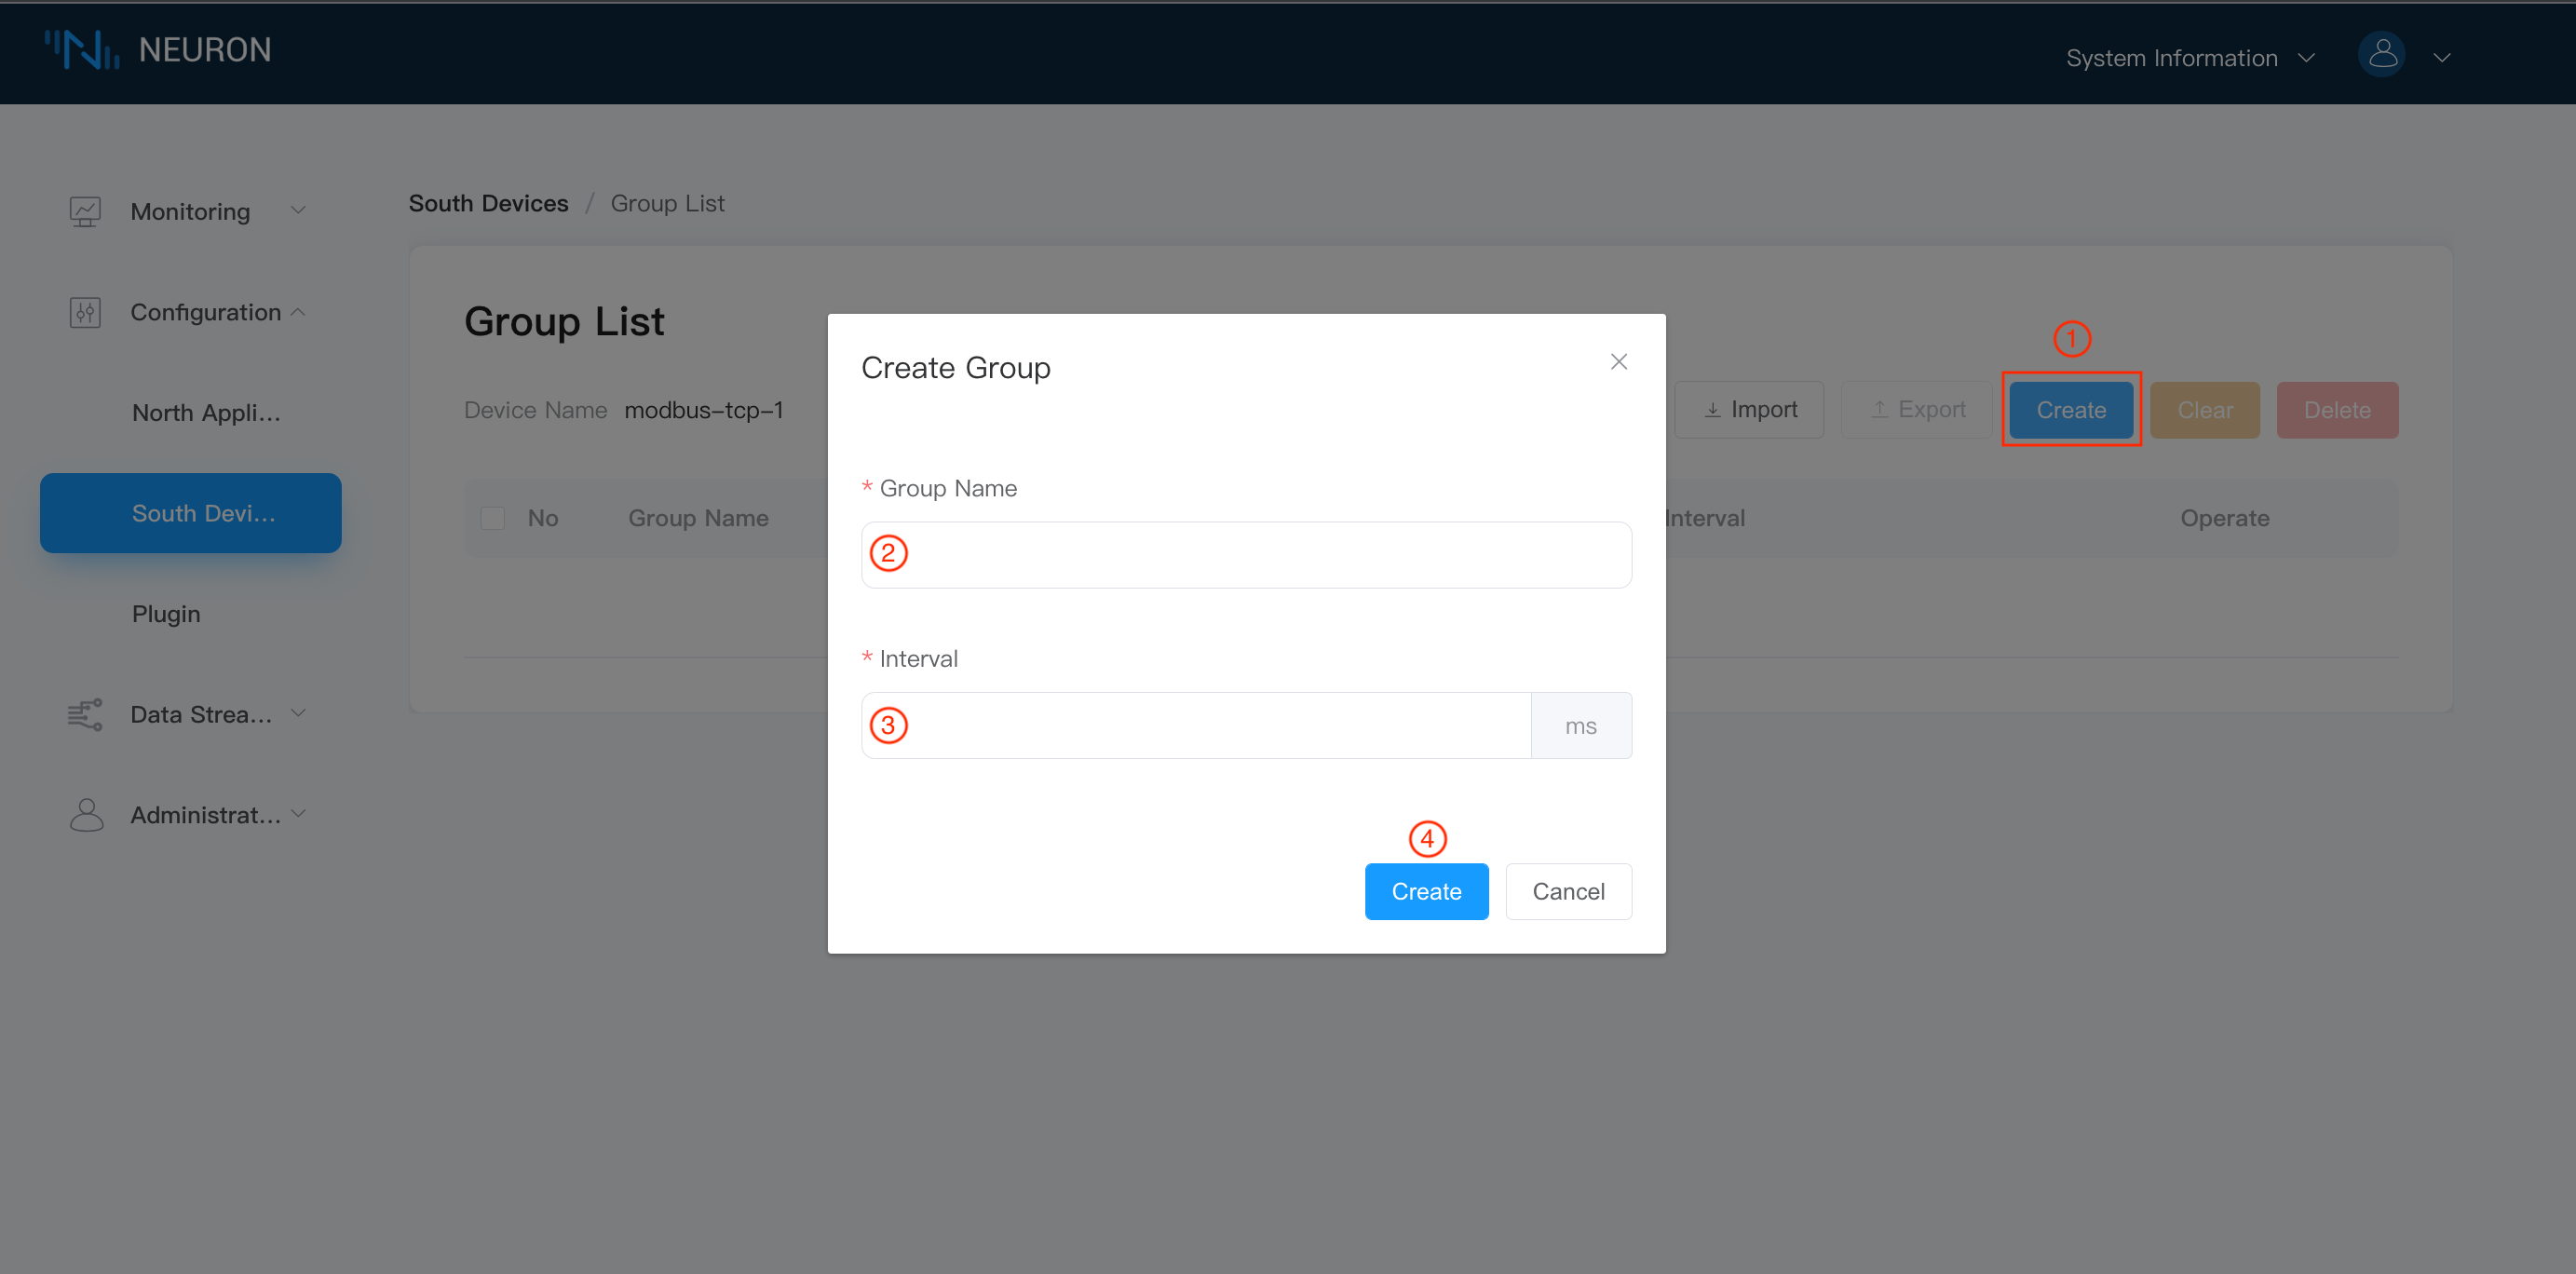
To create a group for device node,
- Click on the
Createat the top right corner to show upCreate Groupdialog box. - Fill in the Group name, e.g. group-1.
- Fill in the Interval, set the time interval for the neuron to collect data from the device and upload the data to MQTT. The minimum can be set to 100ms, but when there is a lot of collected data, if the data monitoring interface reports an error that the point value is invalid, you can adjust the value a bit higher to fix the error.
- Click on the
Submitbutton to complete the creation of the Group.
Step 6 Manage group list
The newly created Group will be shown in the Group list, as shown below.
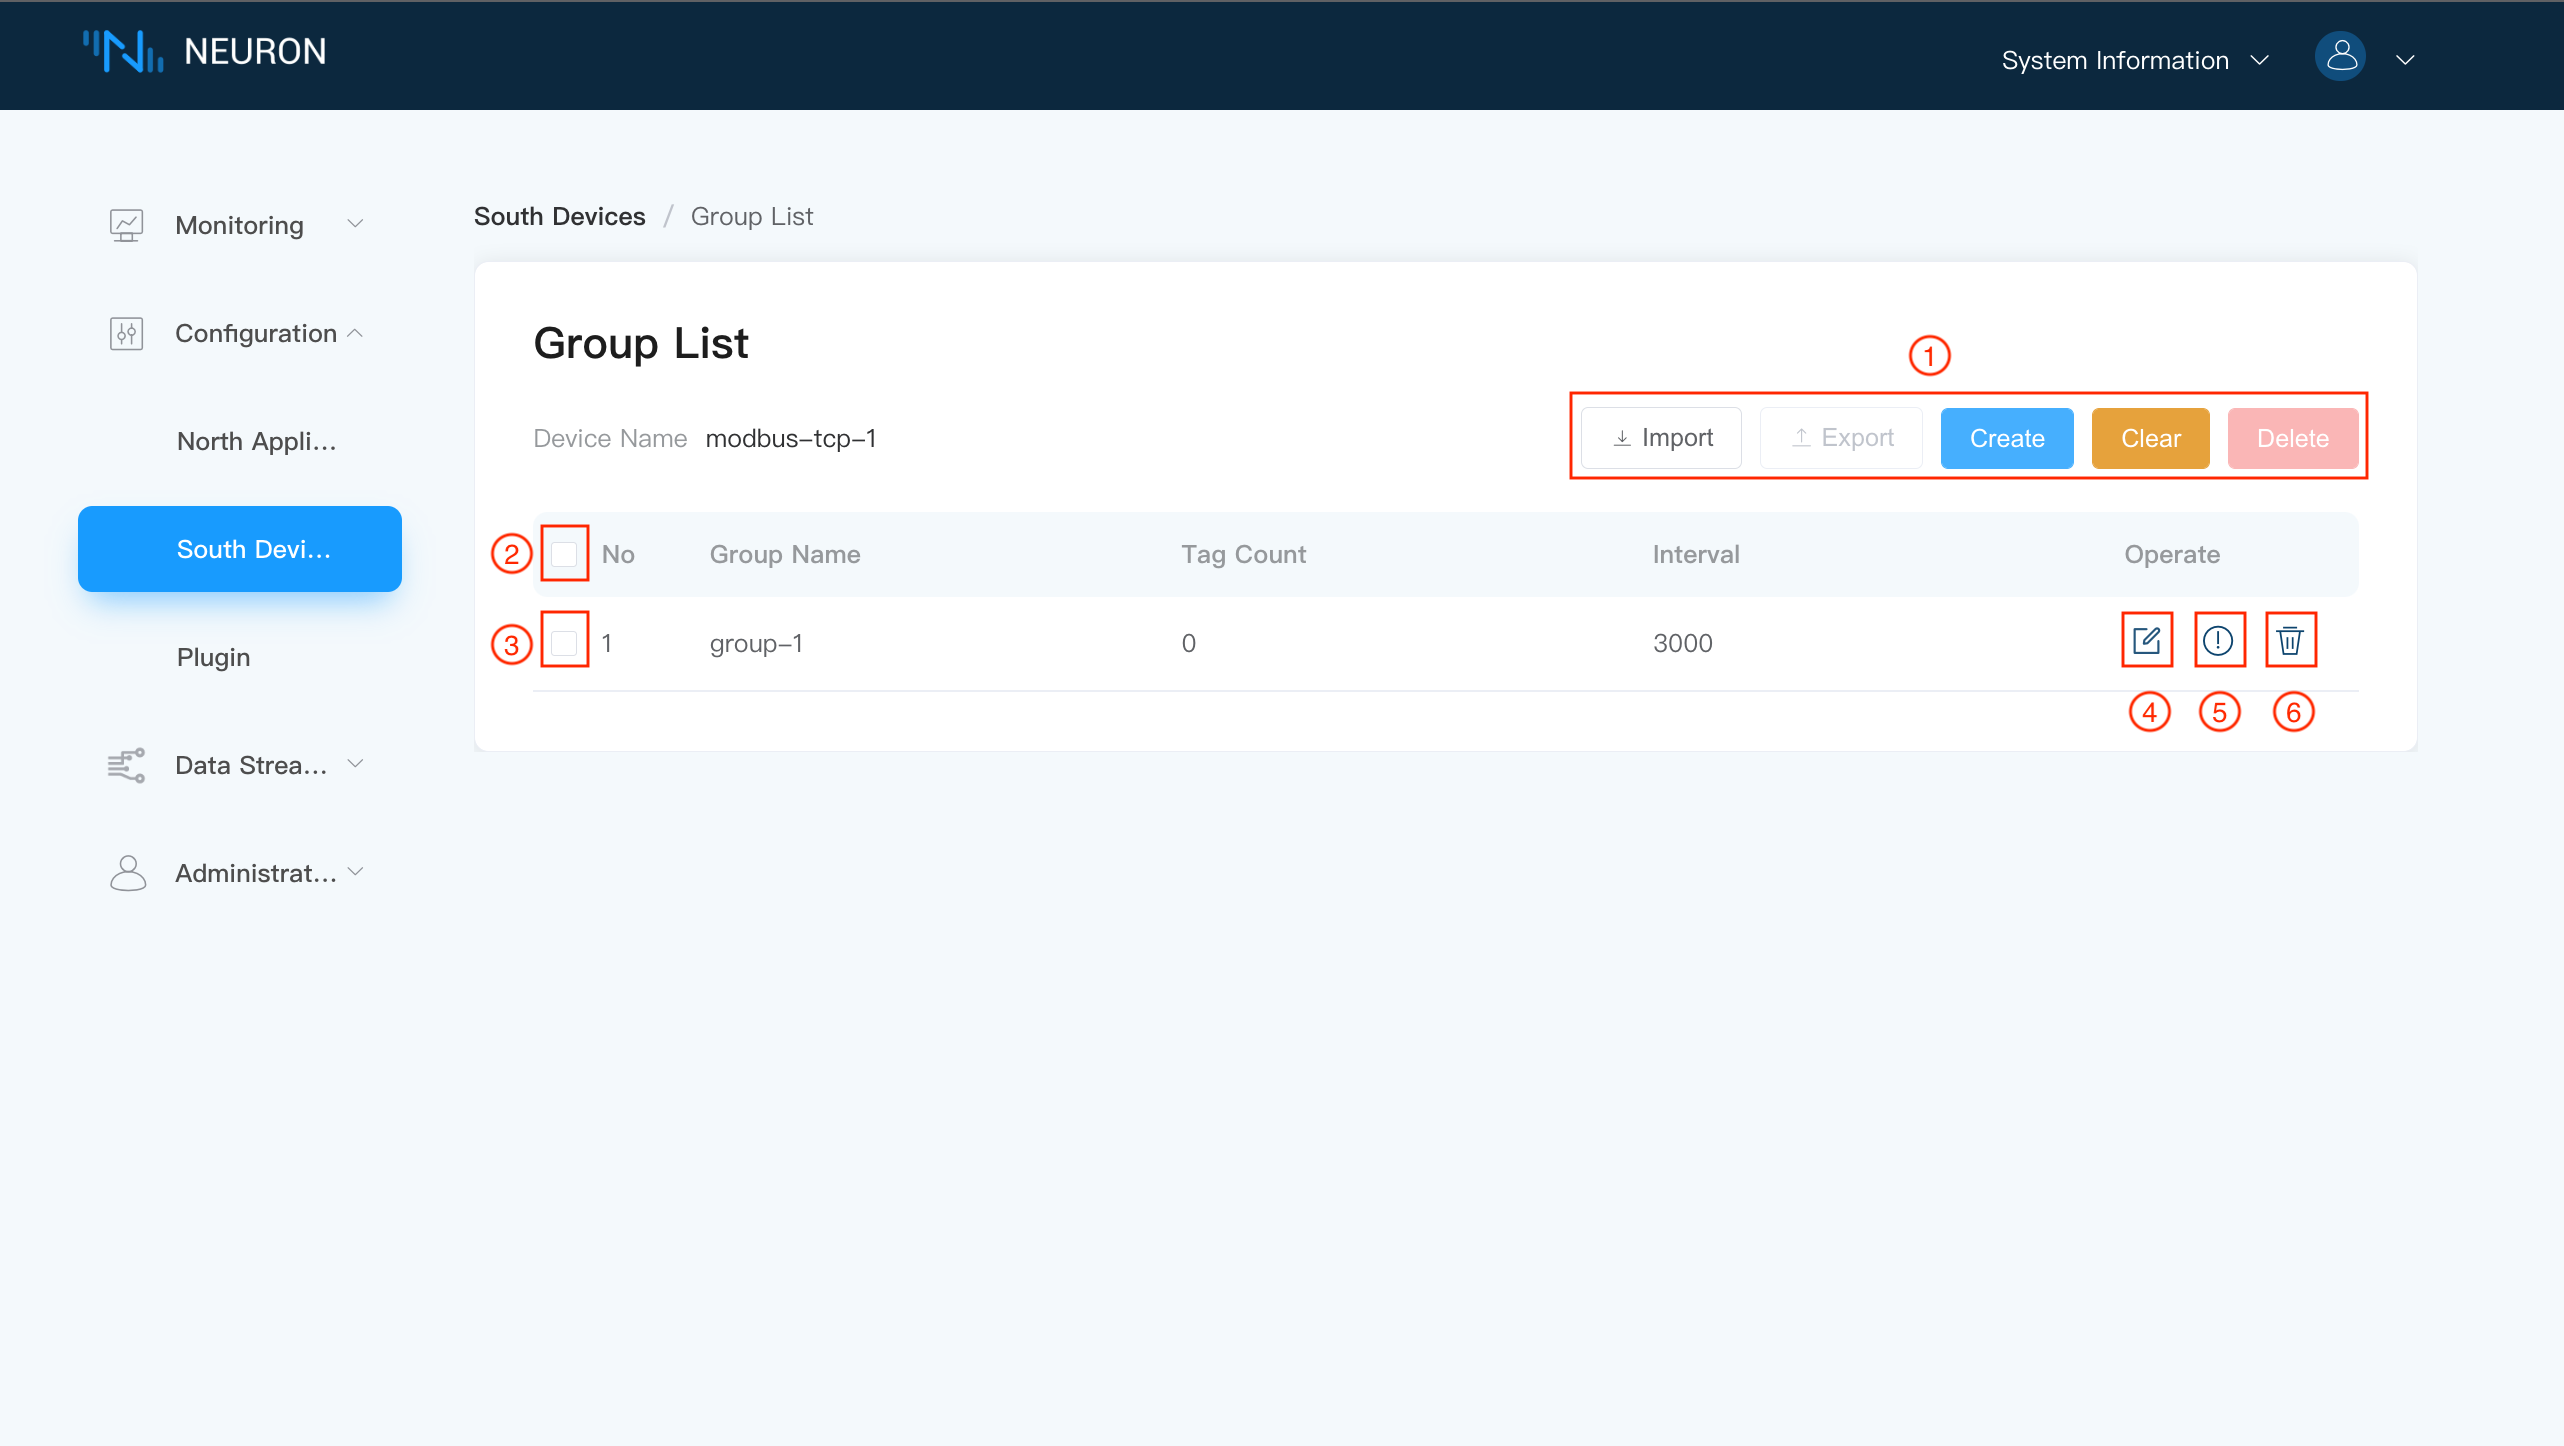
The Group List contains following elements,
Importbutton, in Excel form, and batch import in groups. TheExportbutton exports the information of the selected group to Excel.Clearbutton, delete all created groups with one click. When you select some groups, and then click theDeletebutton, you can quickly delete the selected groups in batches.Cretaebutton is used to create a new group.- Select all groups in the list
- Select this group in the list
Edit iconEdit the group configurationTag List iconCreate data tags for this group.Delete iconDelete this group.
TIP
For detailed import/export functions, please refer to Tag Configuration Import/Export.
Step 7 Add data tags into group
Click on the Tag List icon at the end of a group row to show up the tags configuration list screen, as shown below.
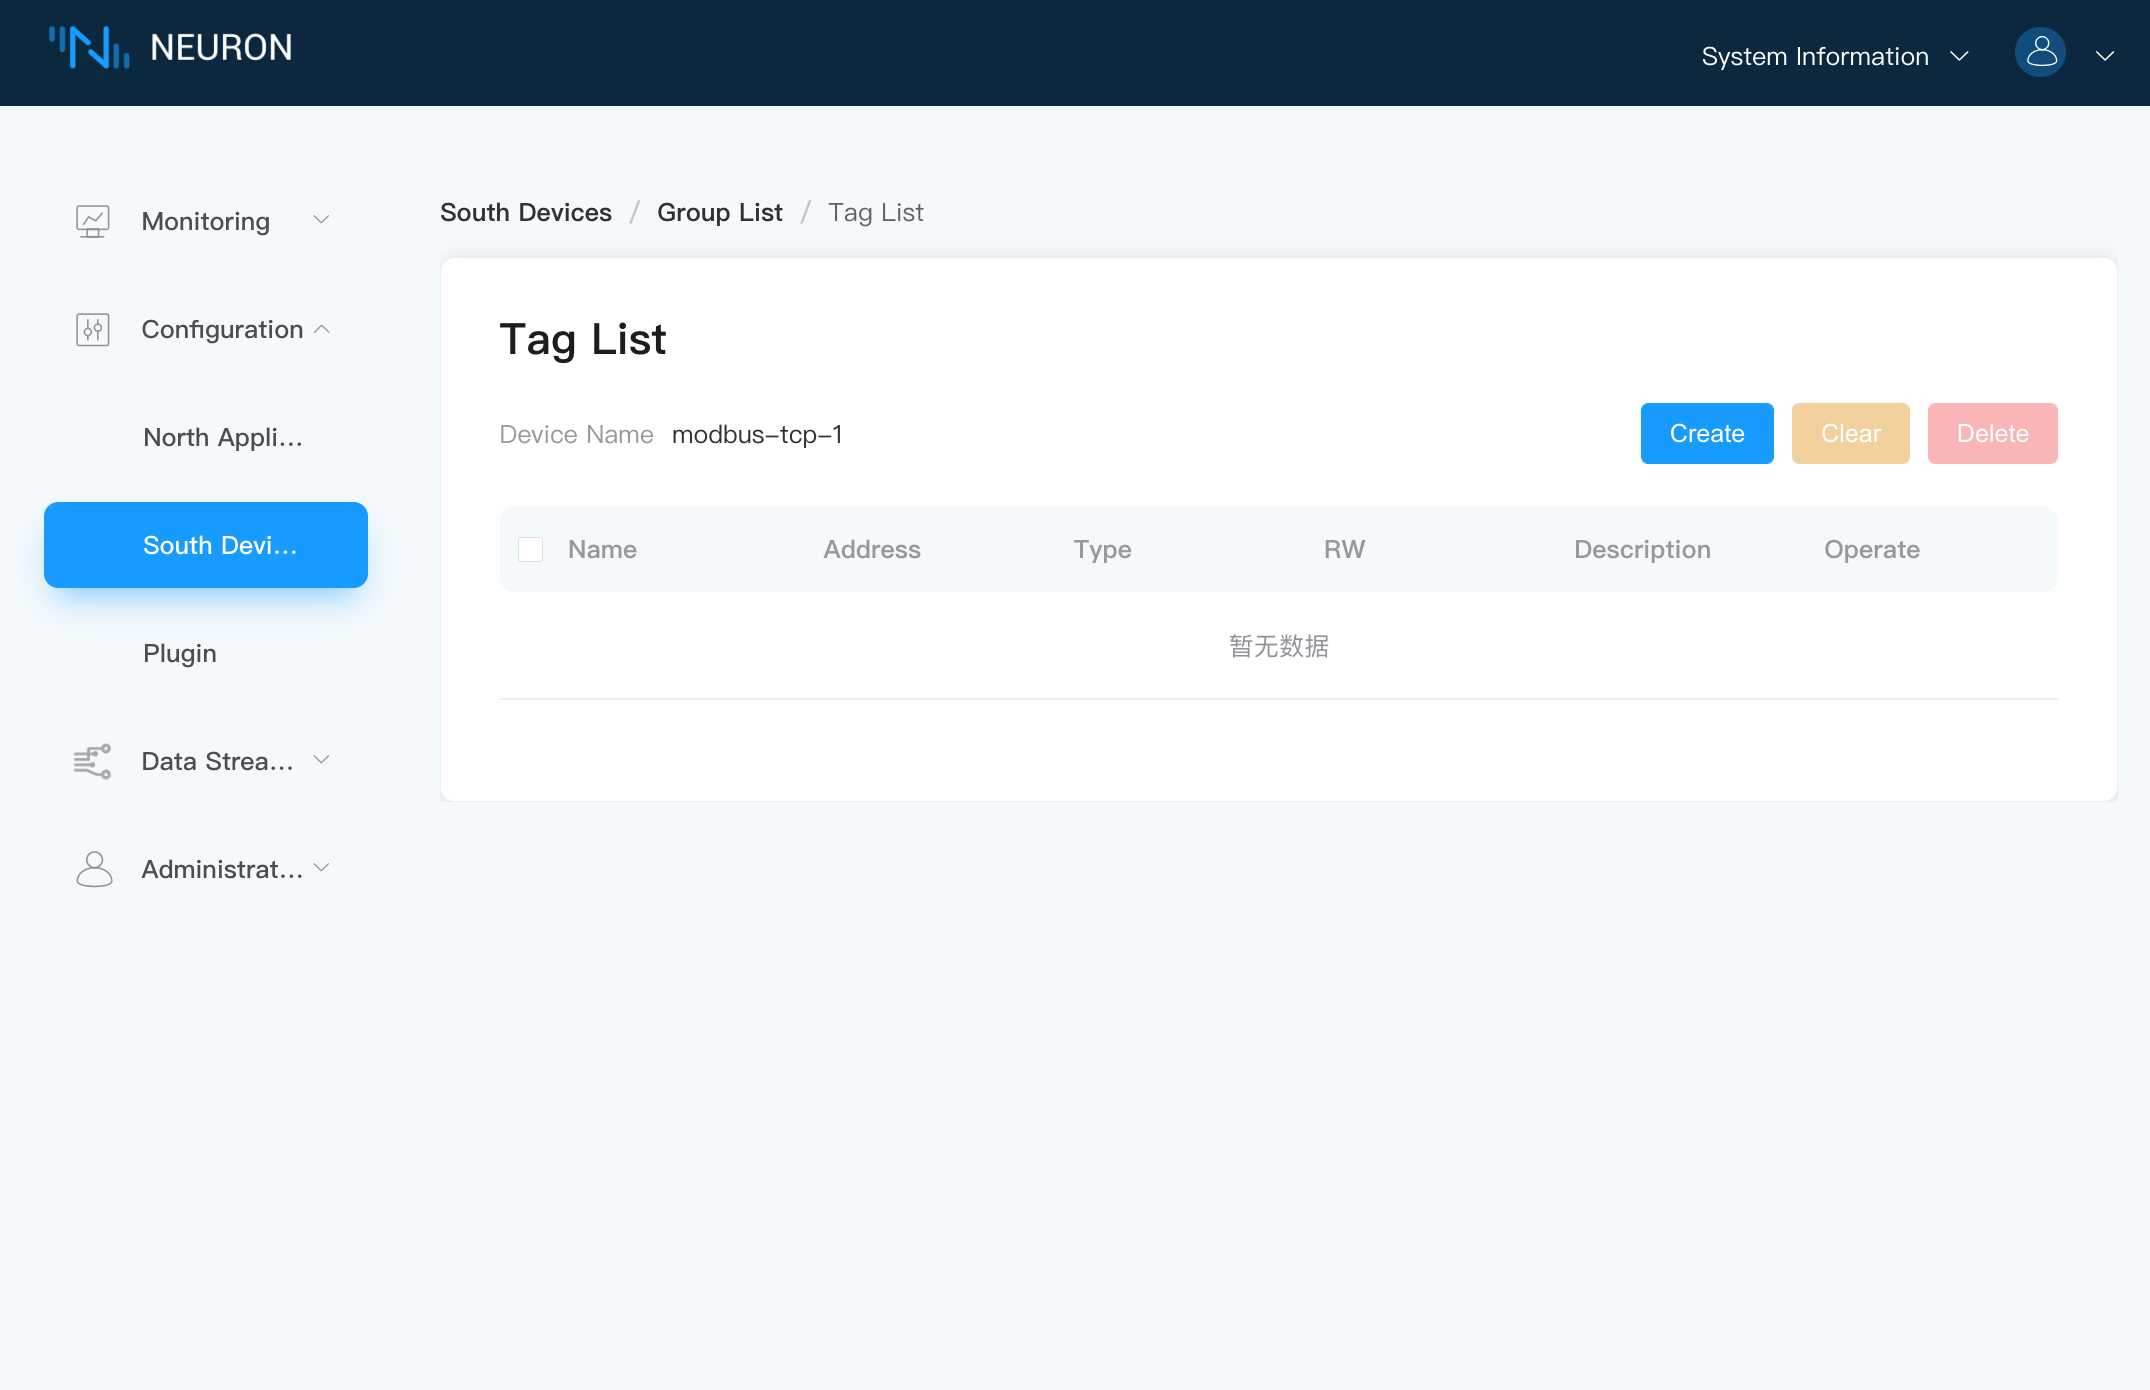
Select the Create button to enter the Add Tags page.
Step 8 Setup data tag details
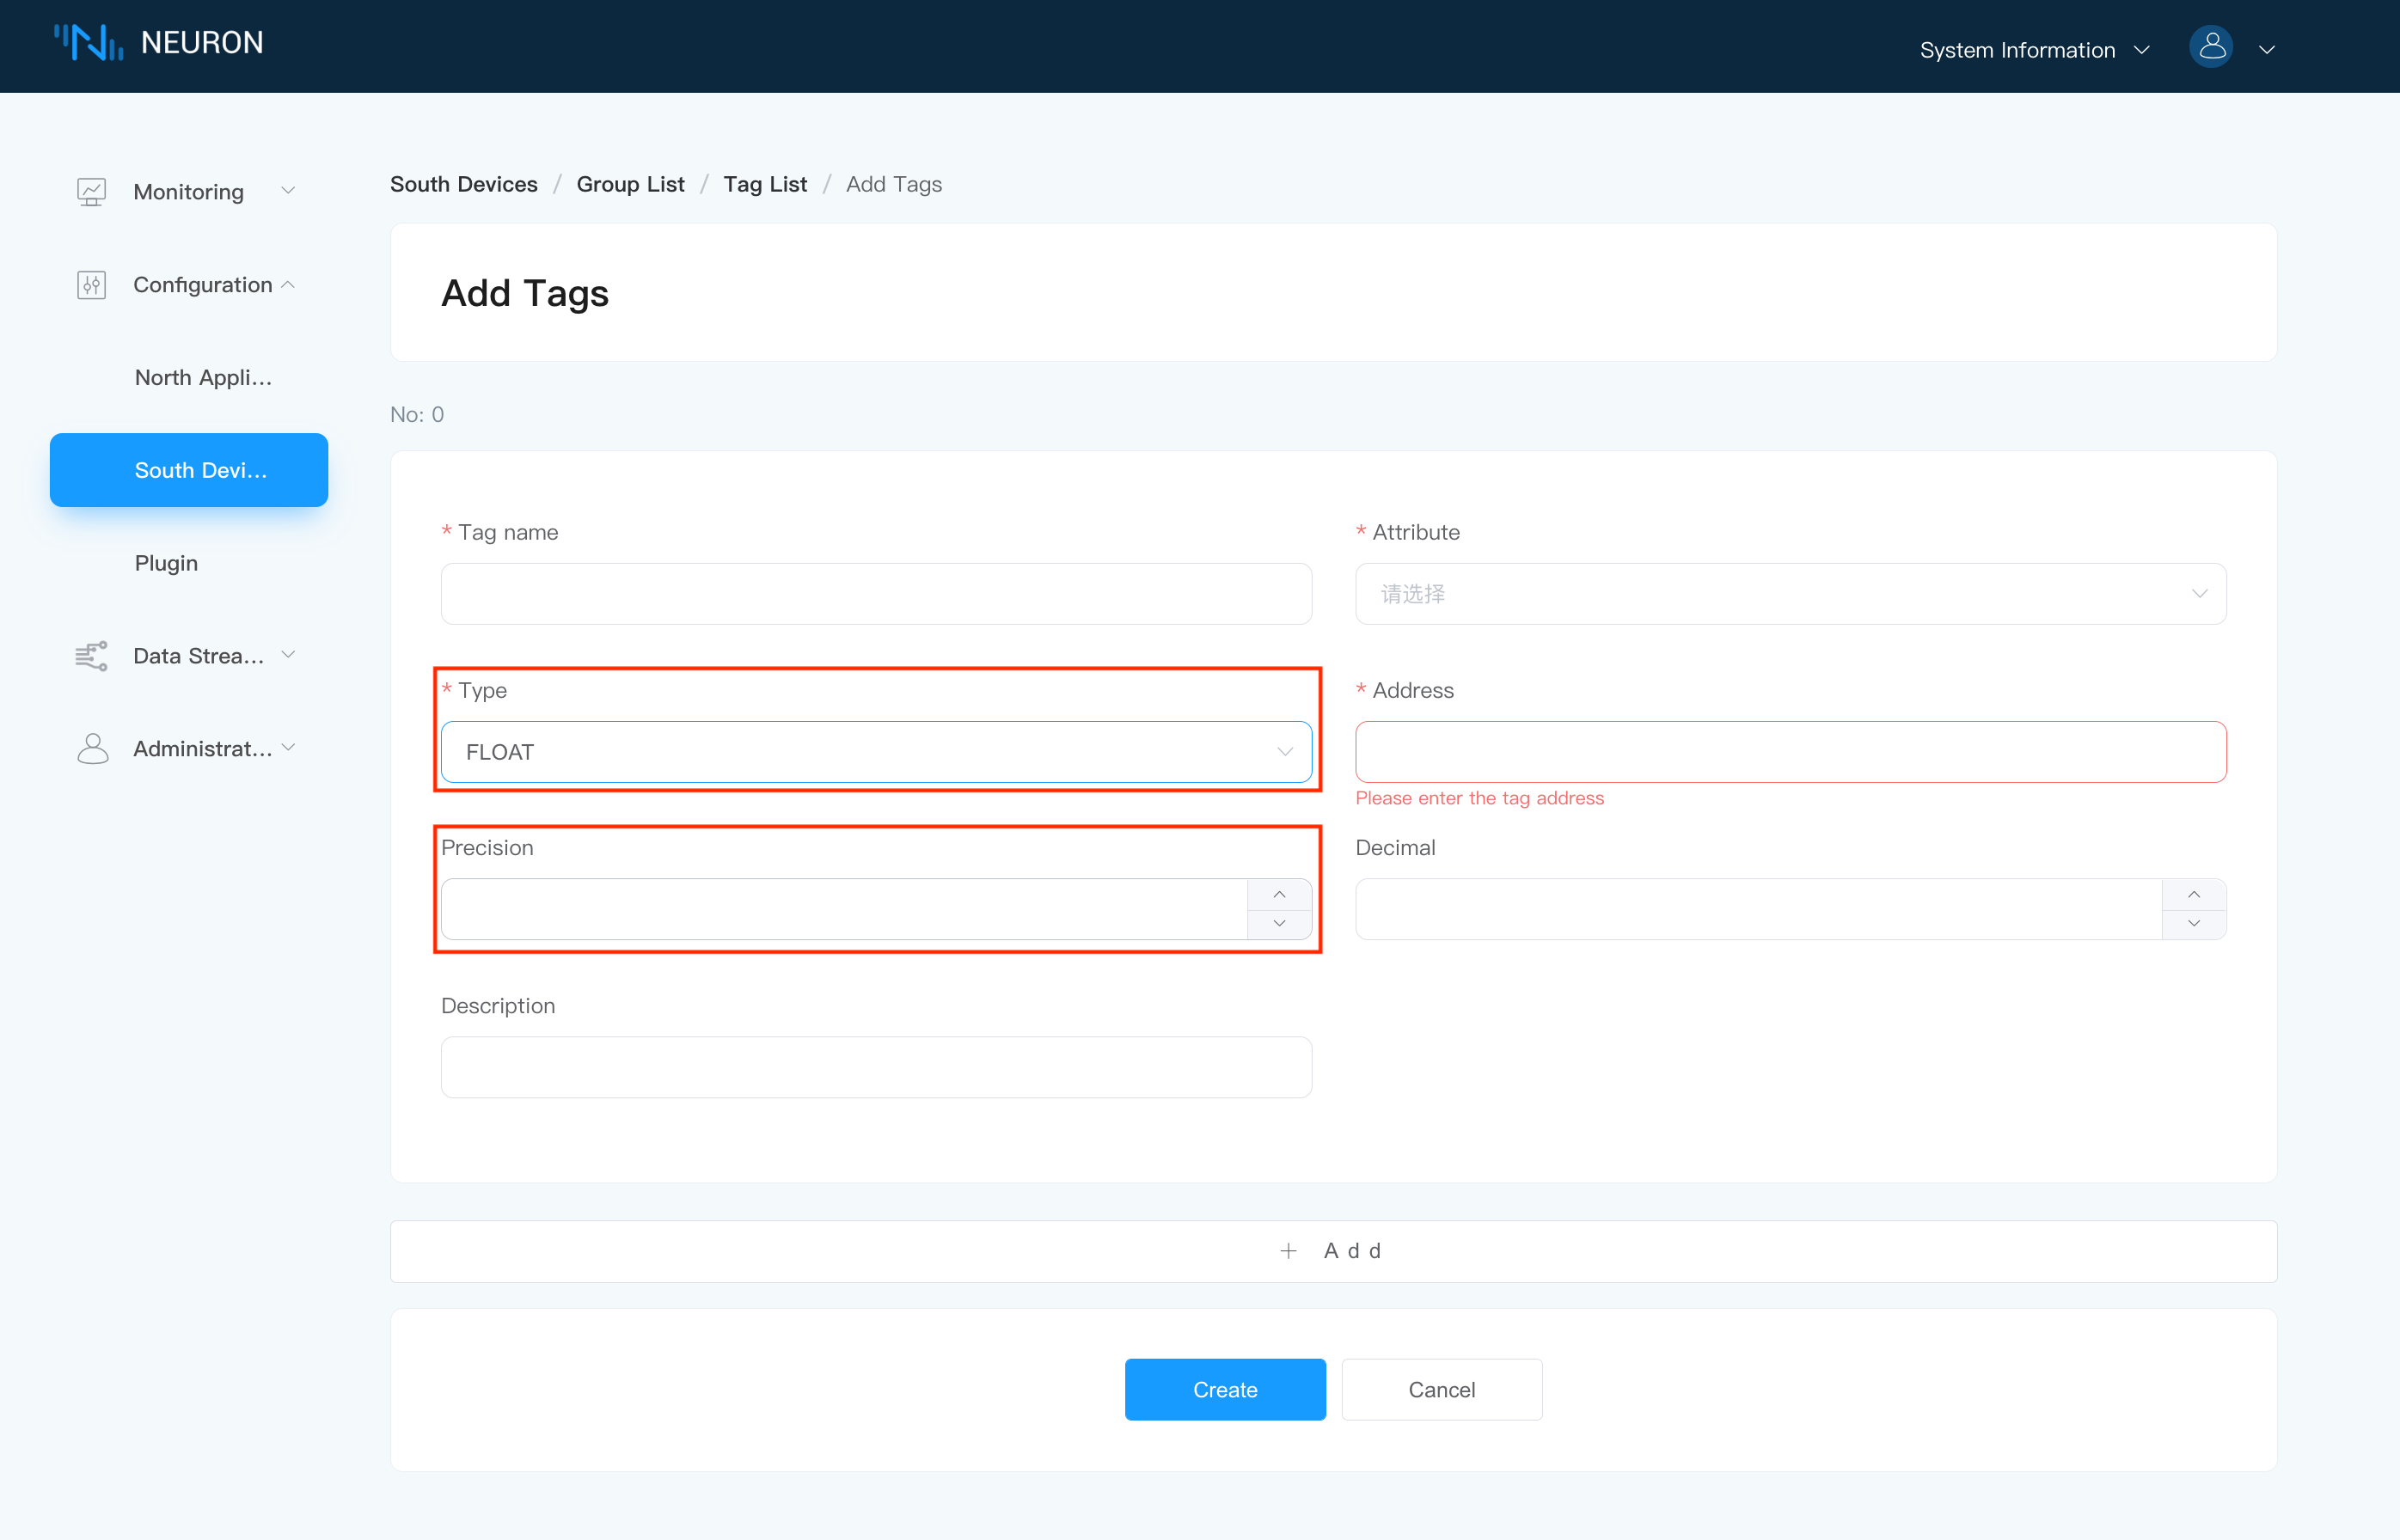
Clicking the Create icon, data tags details setup screen will be shown as below.In the example, we will describe the manual way of adding tags.
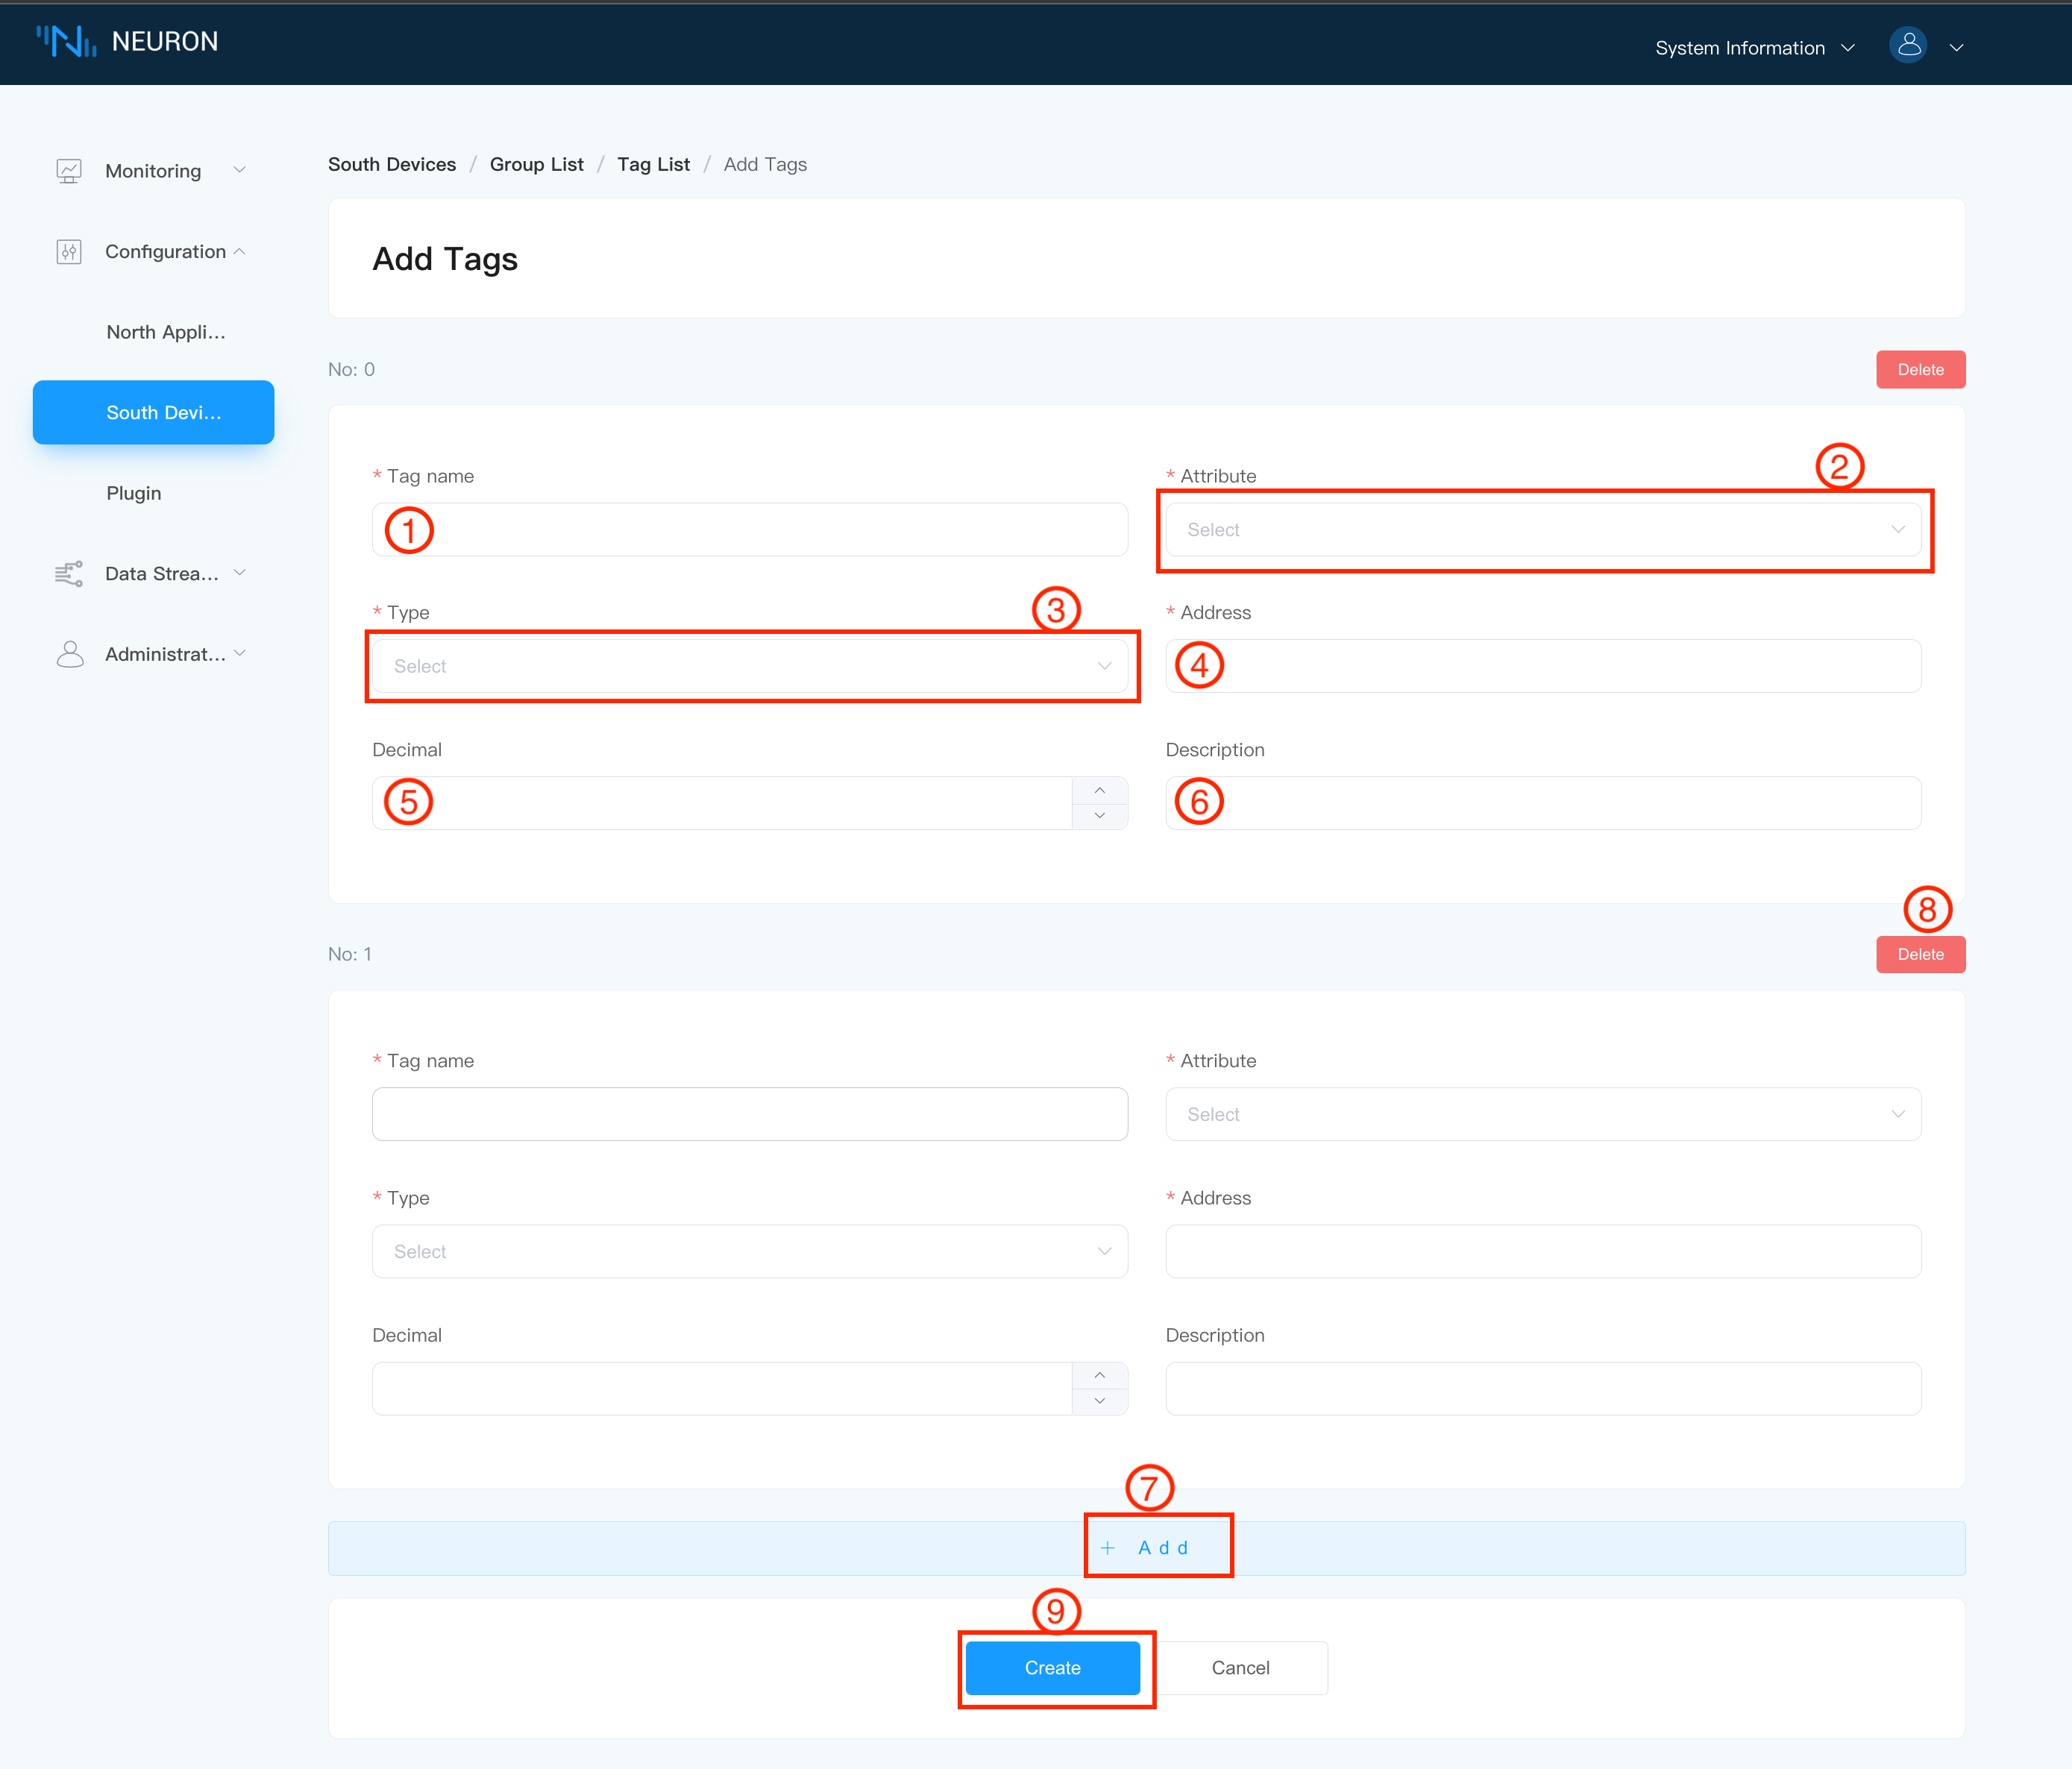
All data tags will be manually added one by one to show you how to setup the tag details. However, all data tags could be inputted in Excel sheet first and then import to the group.
To create a tag for the group list,
- Fill in the Tag name, e.g. tag1.
- Scroll down to select the Tag attribute;
- Drop down to select the data type, for example, int16. Due to the different types supported by each driver, the data types that can be selected from the drop-down box are also different;
- Fill in the drive address, for example, 1!40001. For detailed driver address instructions, please refer to Module Setting;
- The optional parameter Decimal can set the multiplier after the value collected by Neuron. For example, the value collected by neuron is 11, and Decimal is set to 0.1, then the value displayed at this point is 1.1;
- Optional parameter Description, used to add some description information to the label;
- Click the
Addbutton to add the next tag, repeat steps 1-6 until the last tag is added; - After adding a tag, a
deletebutton will be added next to the information box, and you can choose to delete the tag; - Click the
Createbutton to complete the creation of the Tag;
TIP
Currently, the Tag attribute supports three types: Read, Write, and Subscribe. When the Subscribe attribute is selected, the changed value will be uploaded to the cloud only when the collected value changes.
When the data type is float/double, an optional parameter precision is displayed to set the precision, and the optional range is 1-17.
Step 9 Manage data tags of group
After all tags creation are complete, tag list will be shown as below.
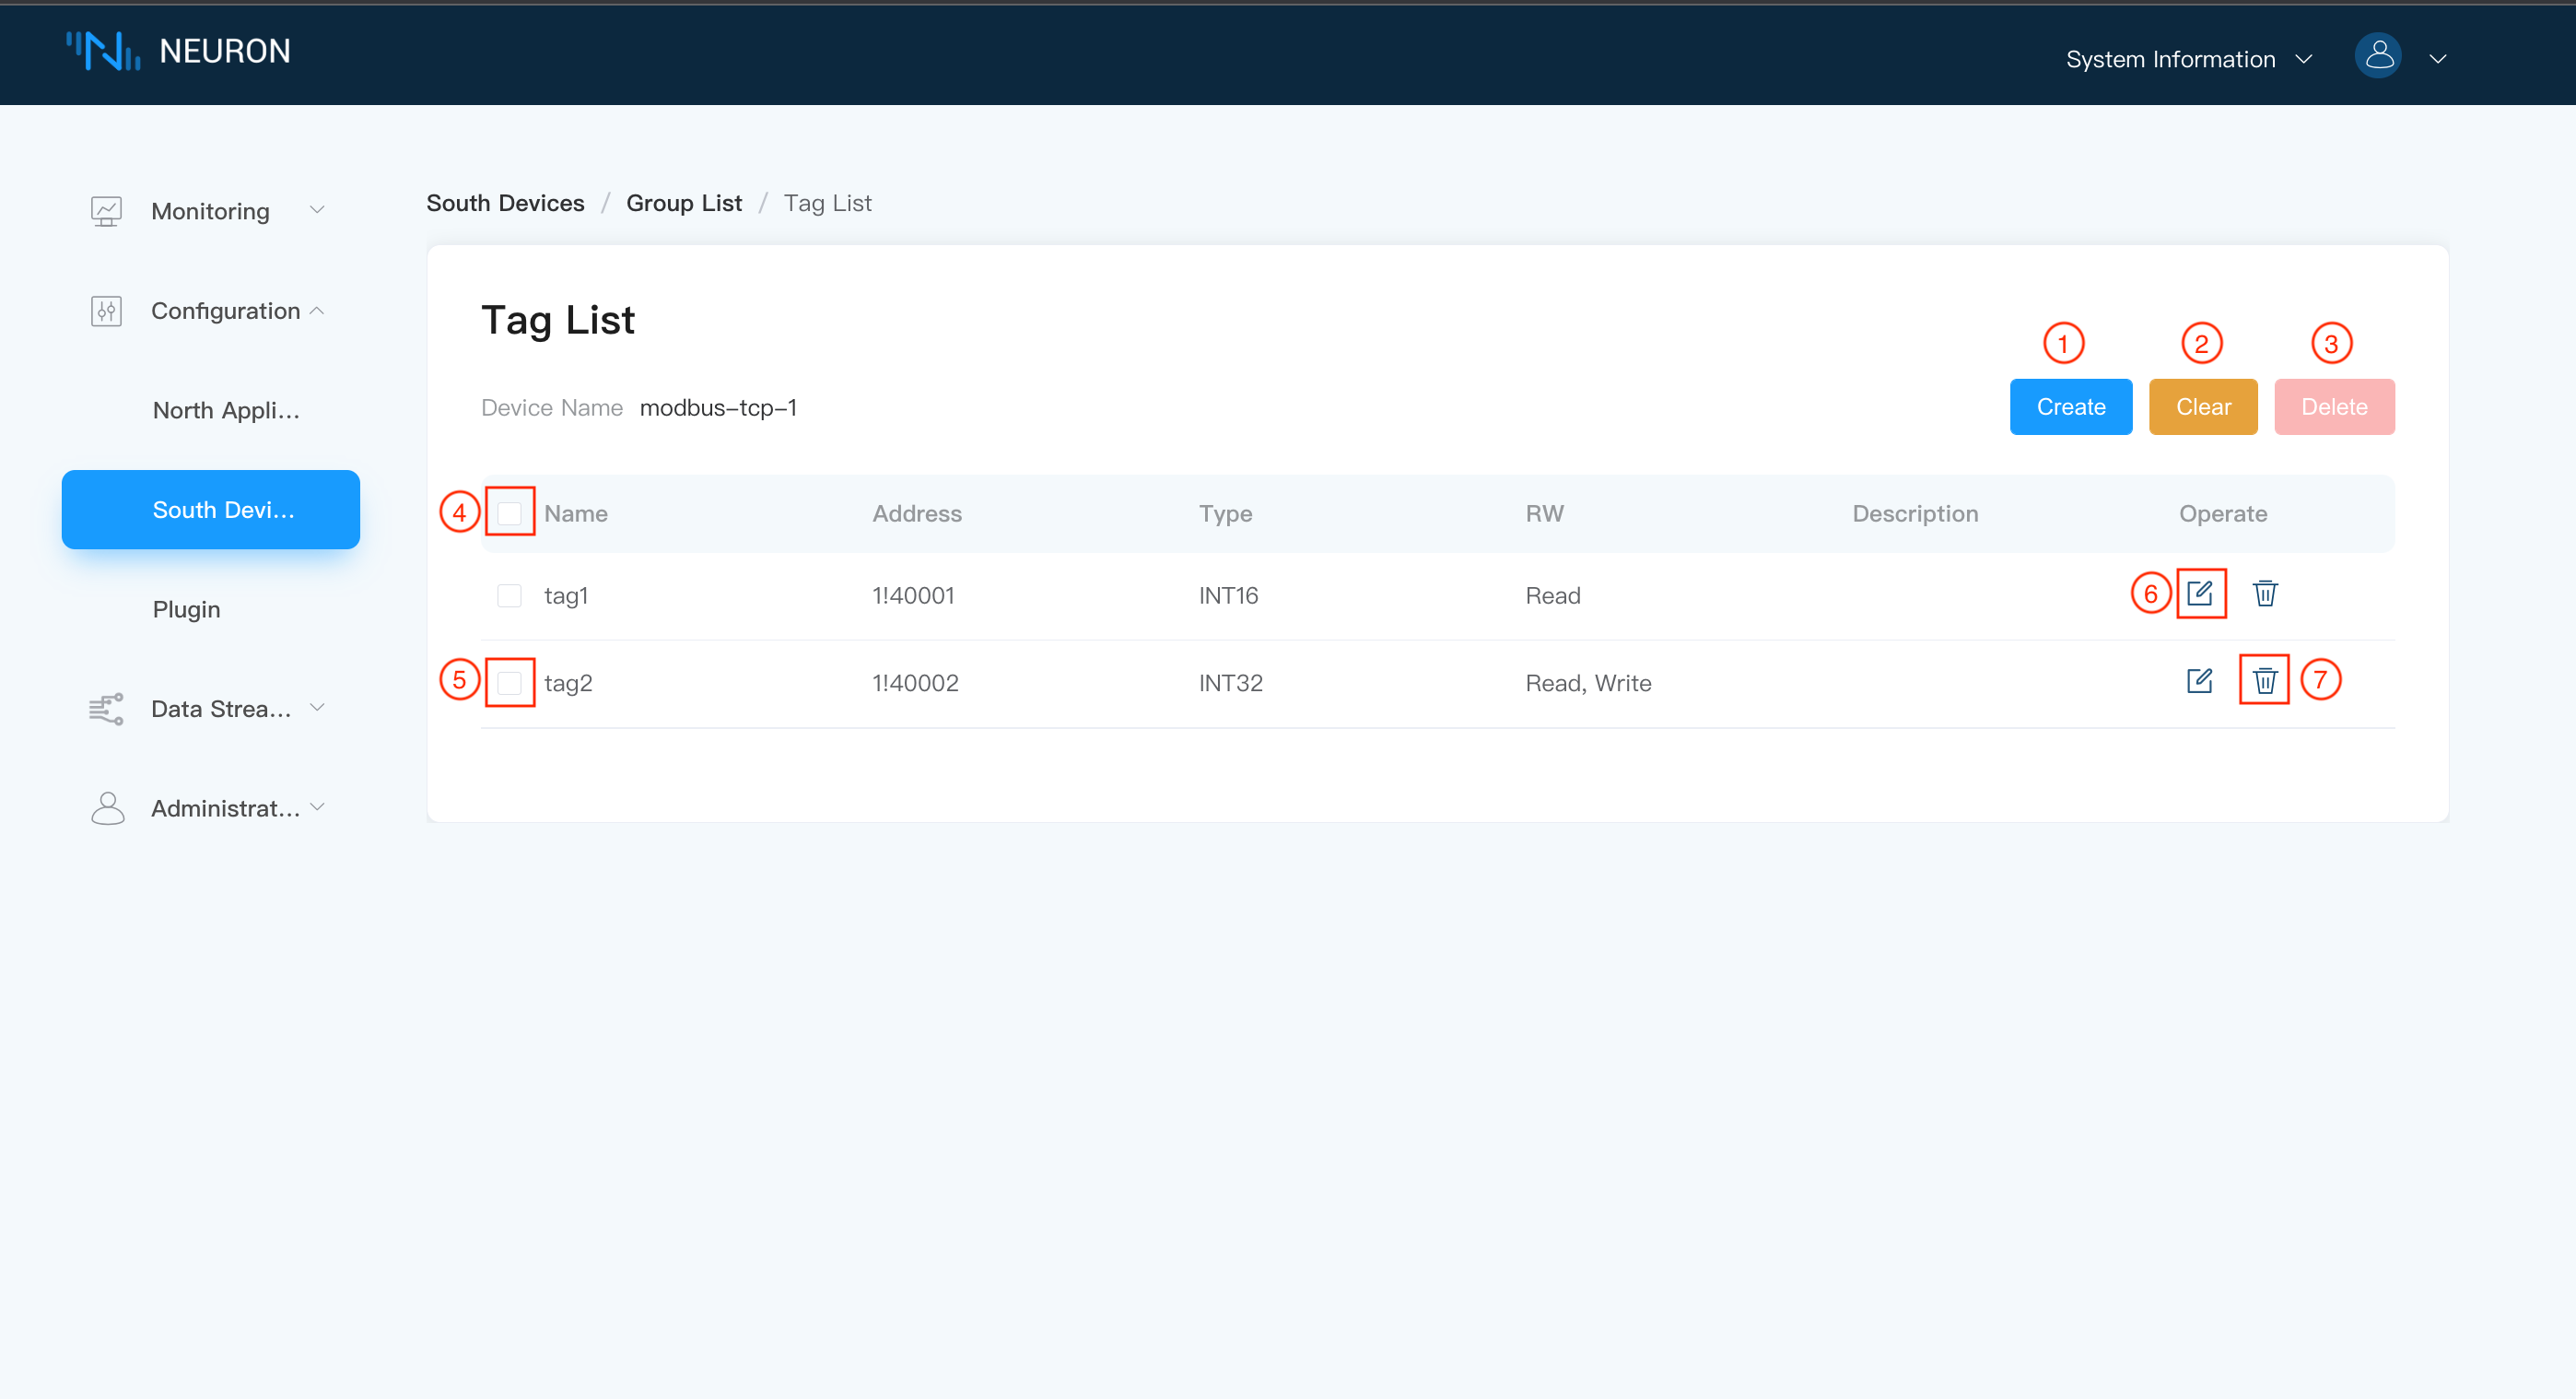
Createbutton to create a new label;Clearbutton, delete all tags with one click;Deletebutton, when selecting all, click theDeletebutton, the effect is equivalent toClear, which can delete all tags. When selecting some tags, click thedeletebutton to quickly delete the selected tags in batches;- Select all tags in the list;
- A label in the radio list;
Edit, Each tag contains name, address, type, read/write properties, description, button toedittag information.Delete, delete this tag.
Step 10 Check over the data in monitoring screen
Click on Data Monitoring in the Monitoring menu to show the data monitoring screen, where you can find those tags created and its data value as shown below.
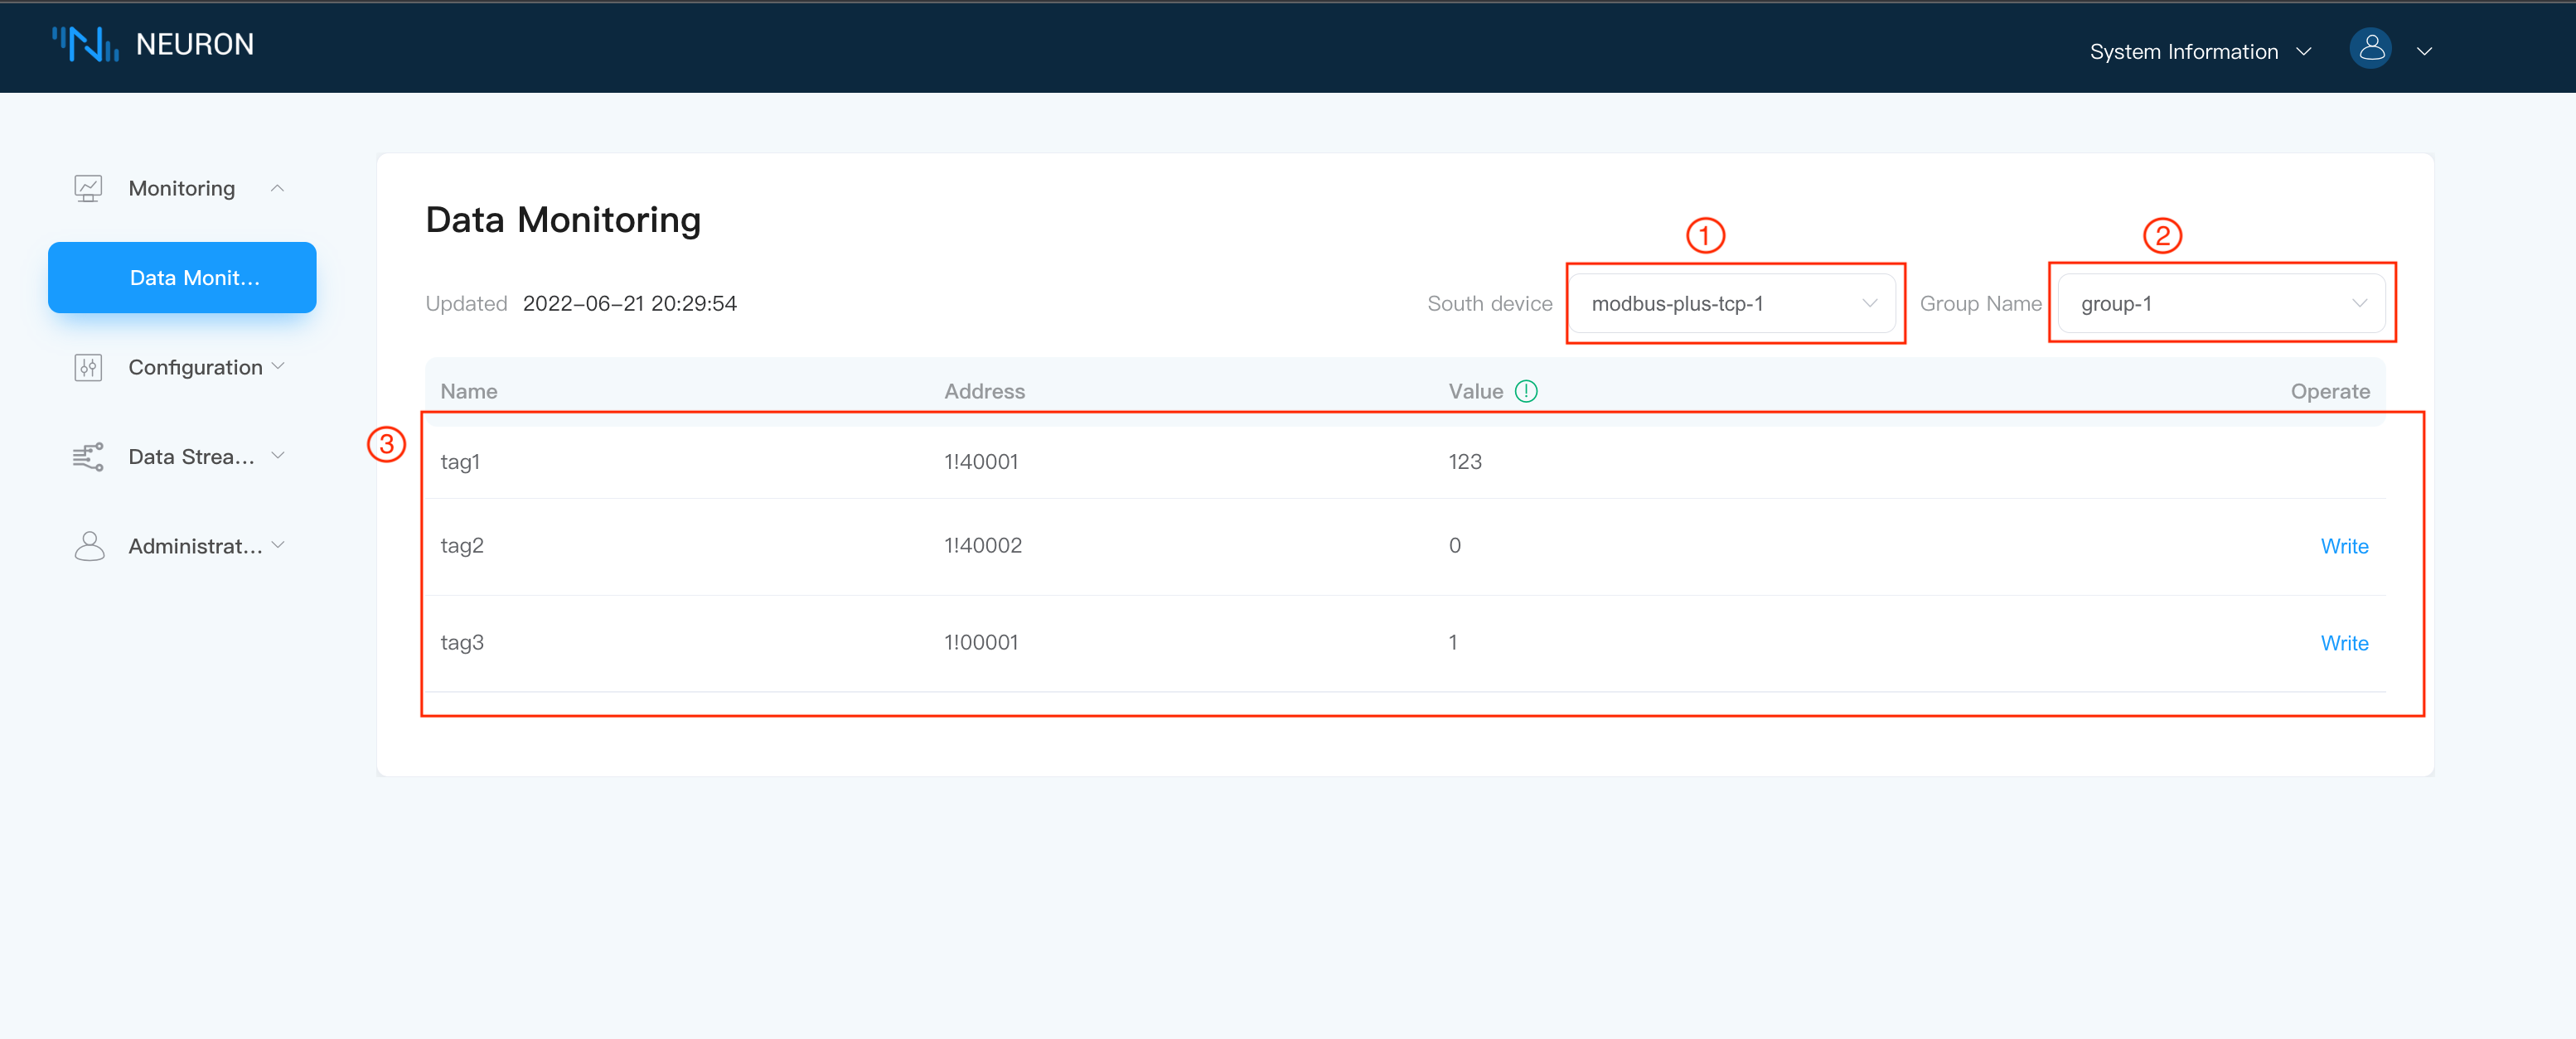
To switch between data group for monitoring,
- Select the southbound device you want to view from the drop down box, in this case, select modbus-tcp-1 which has been created above.
- Click on the drop down box to select the Group you want to view under the selected southbound device, in this case, select group-1 which has been created above.
- When the selection is complete, the page will show the value of each Tag read under the Group.
TIP
If you find data value is a non-sense large number, you can adjust the byte order settings in simulator. The default byte order for the Modbus TCP simulator is BE 3,4,1,2
Step 11 Make change to simulator data tag value
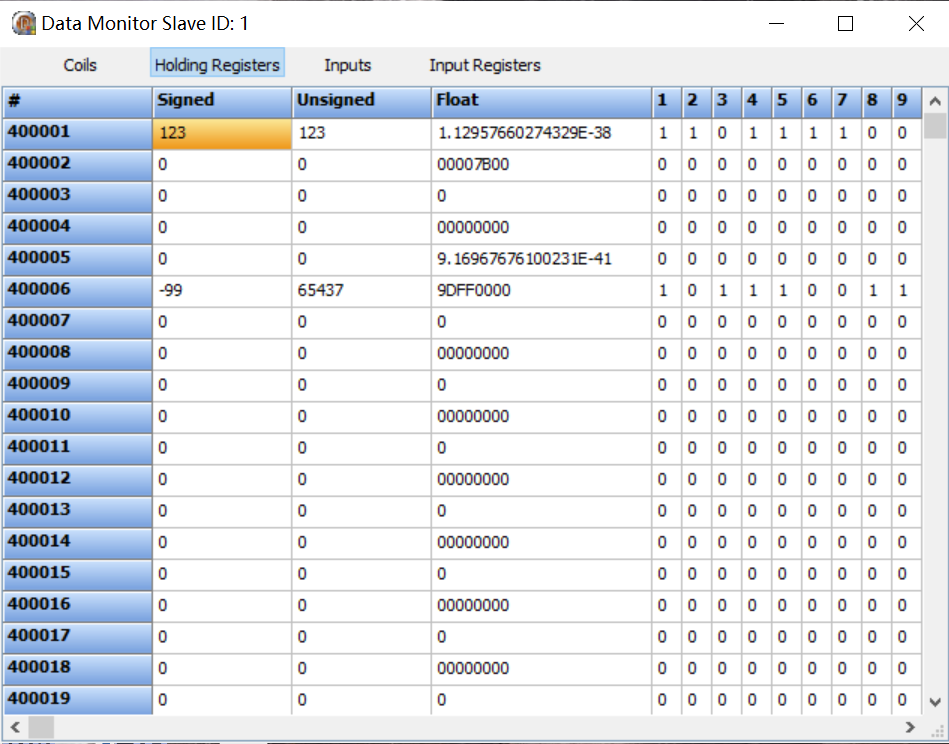
By setting the value of the register in the simulator, check whether the value displayed by the data monitoring is consistent with the value in the simulator, as shown below.
Step 12 Input device control value in dashboard
When the tag is set with the write attribute, the tag of the data monitoring interface will have a write operation. When the point also has the writable attribute on the device, click Write to realize the reverse control device, as shown in the following figure.
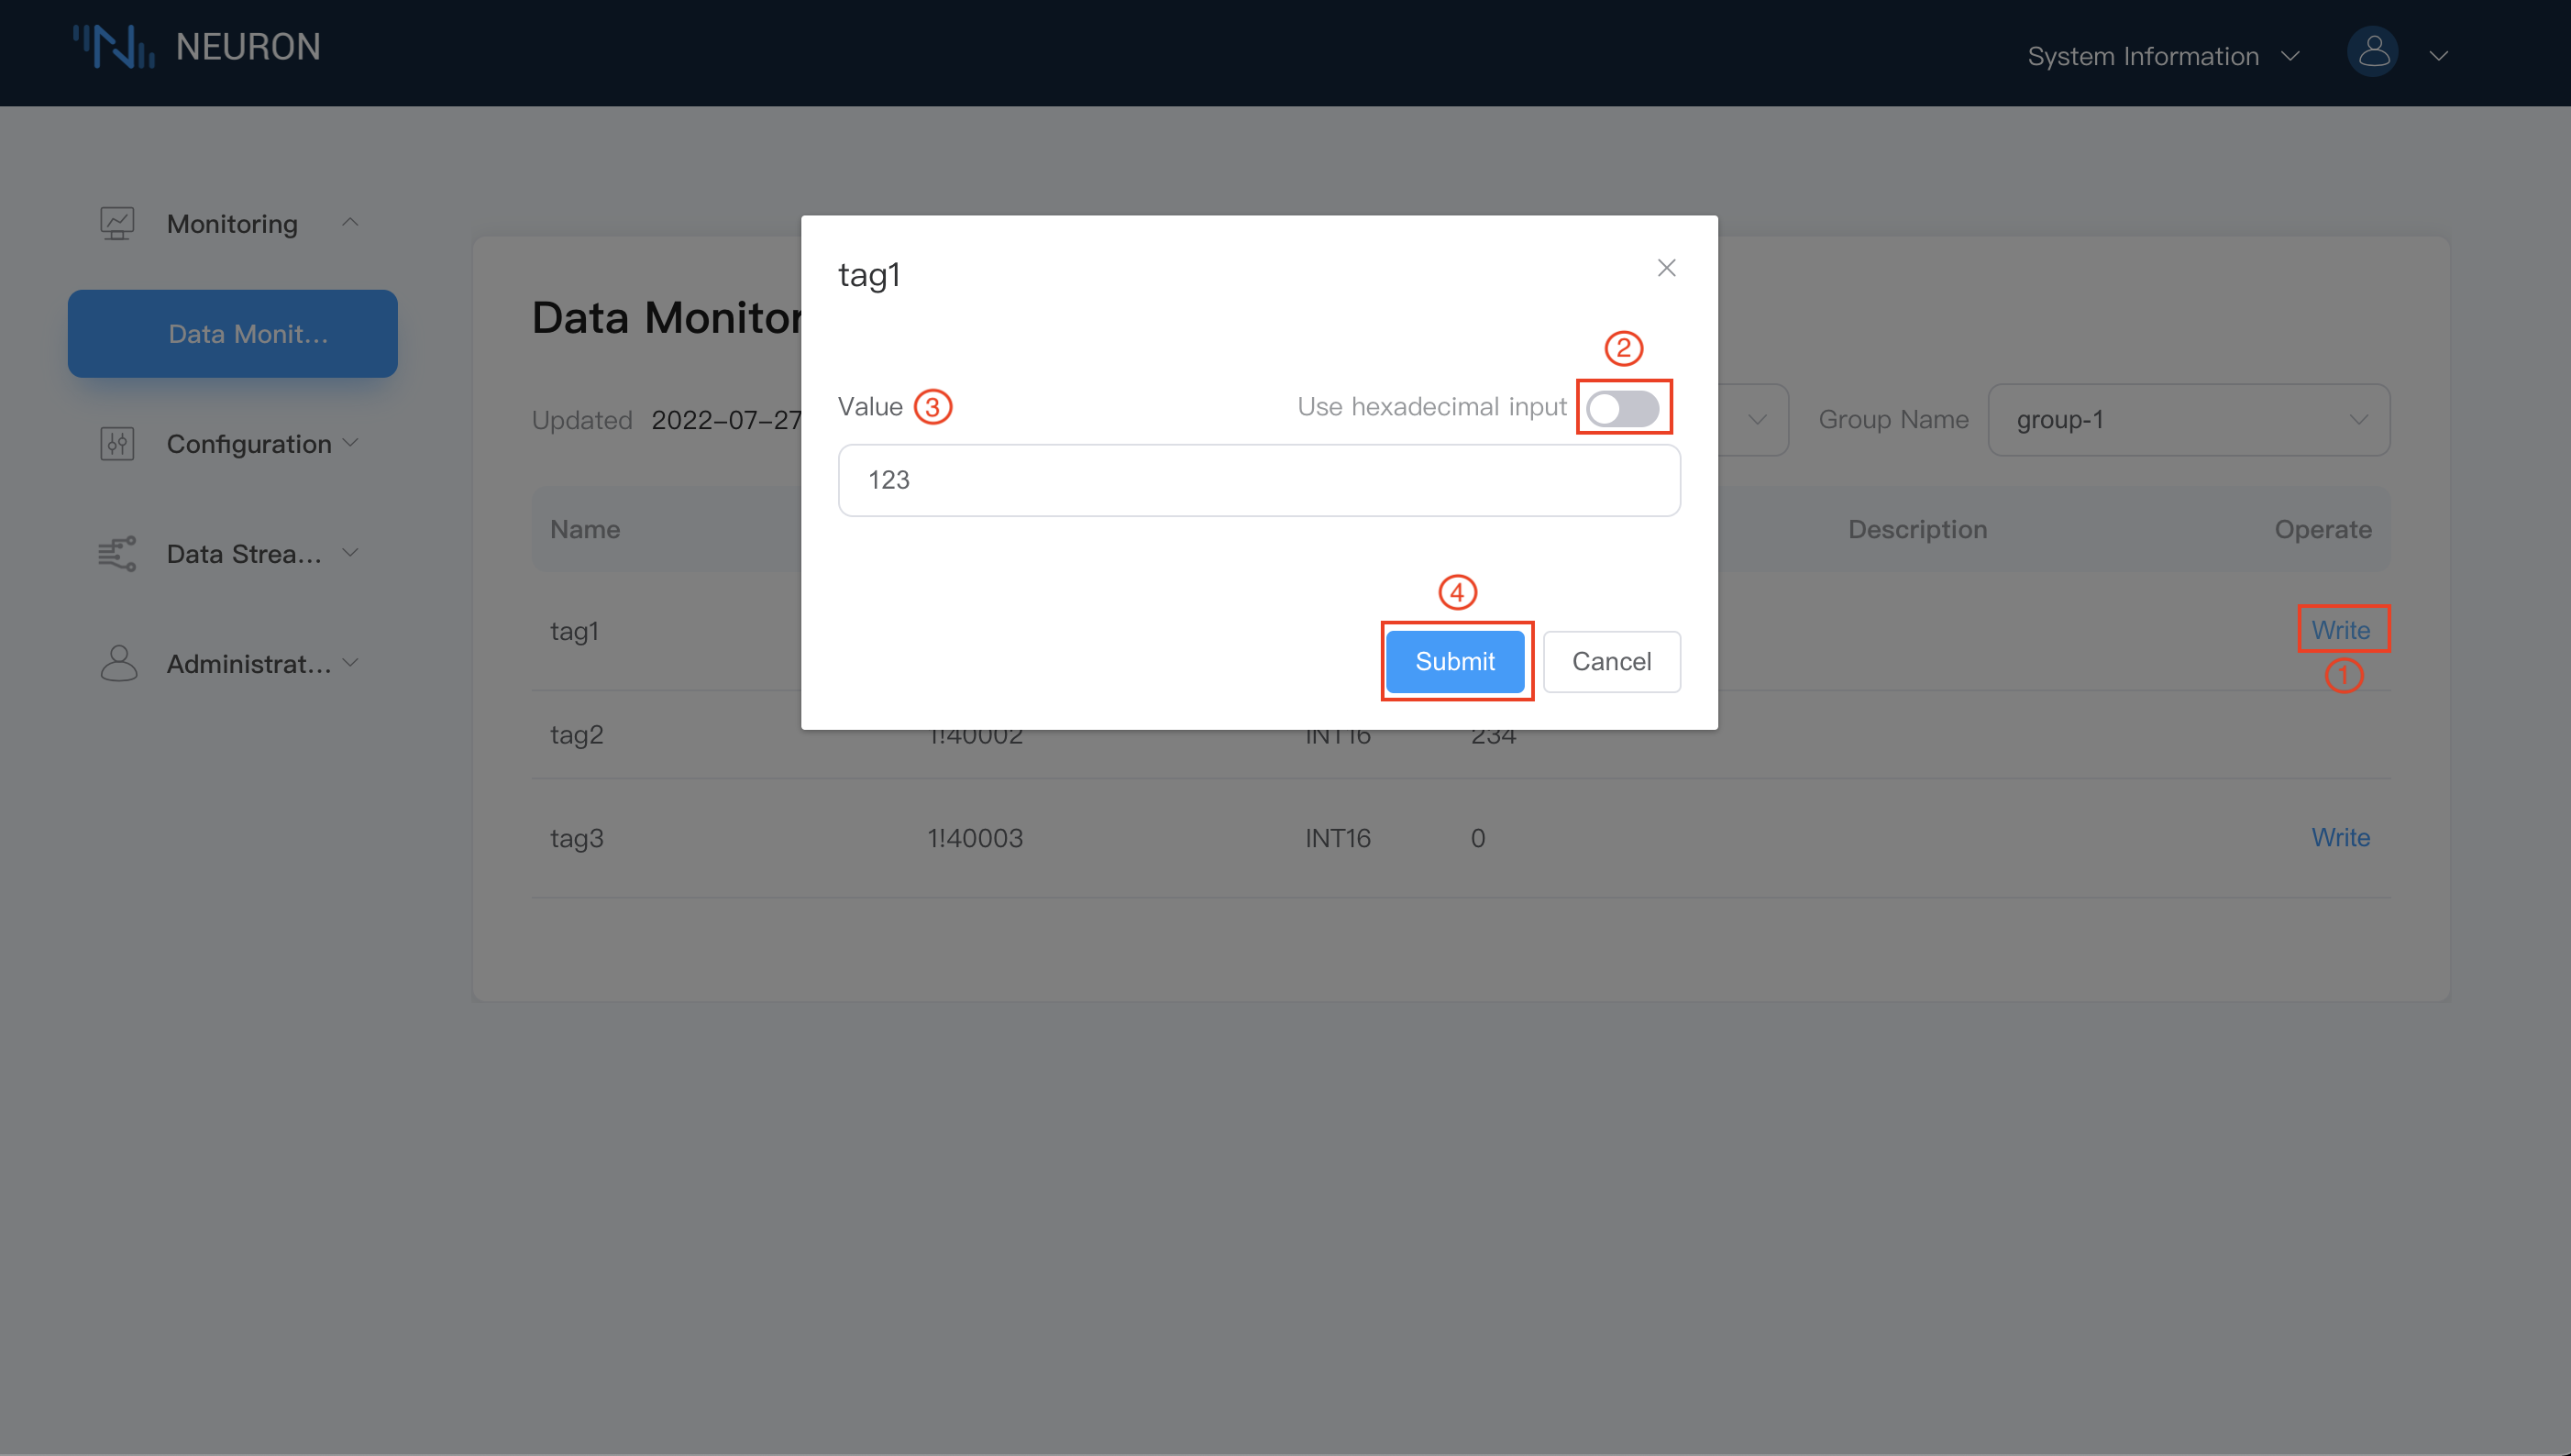
To perform dashboard data write operation,
- Click on
Writebutton at the end of the tag which is going to change value. - Choose whether to enter the value in hexadecimal.
- Enter the new value for the tag.
- Click on
Submitbutton to submit new value.
Step 13 Add northbound plugin modules for application
Click on Northbound Application in the Configuration menu to show the Northbound Application Management screen. There will be a default data stream application node, now you can add more manually, in this case we will create an mqtt application node, as shown below.
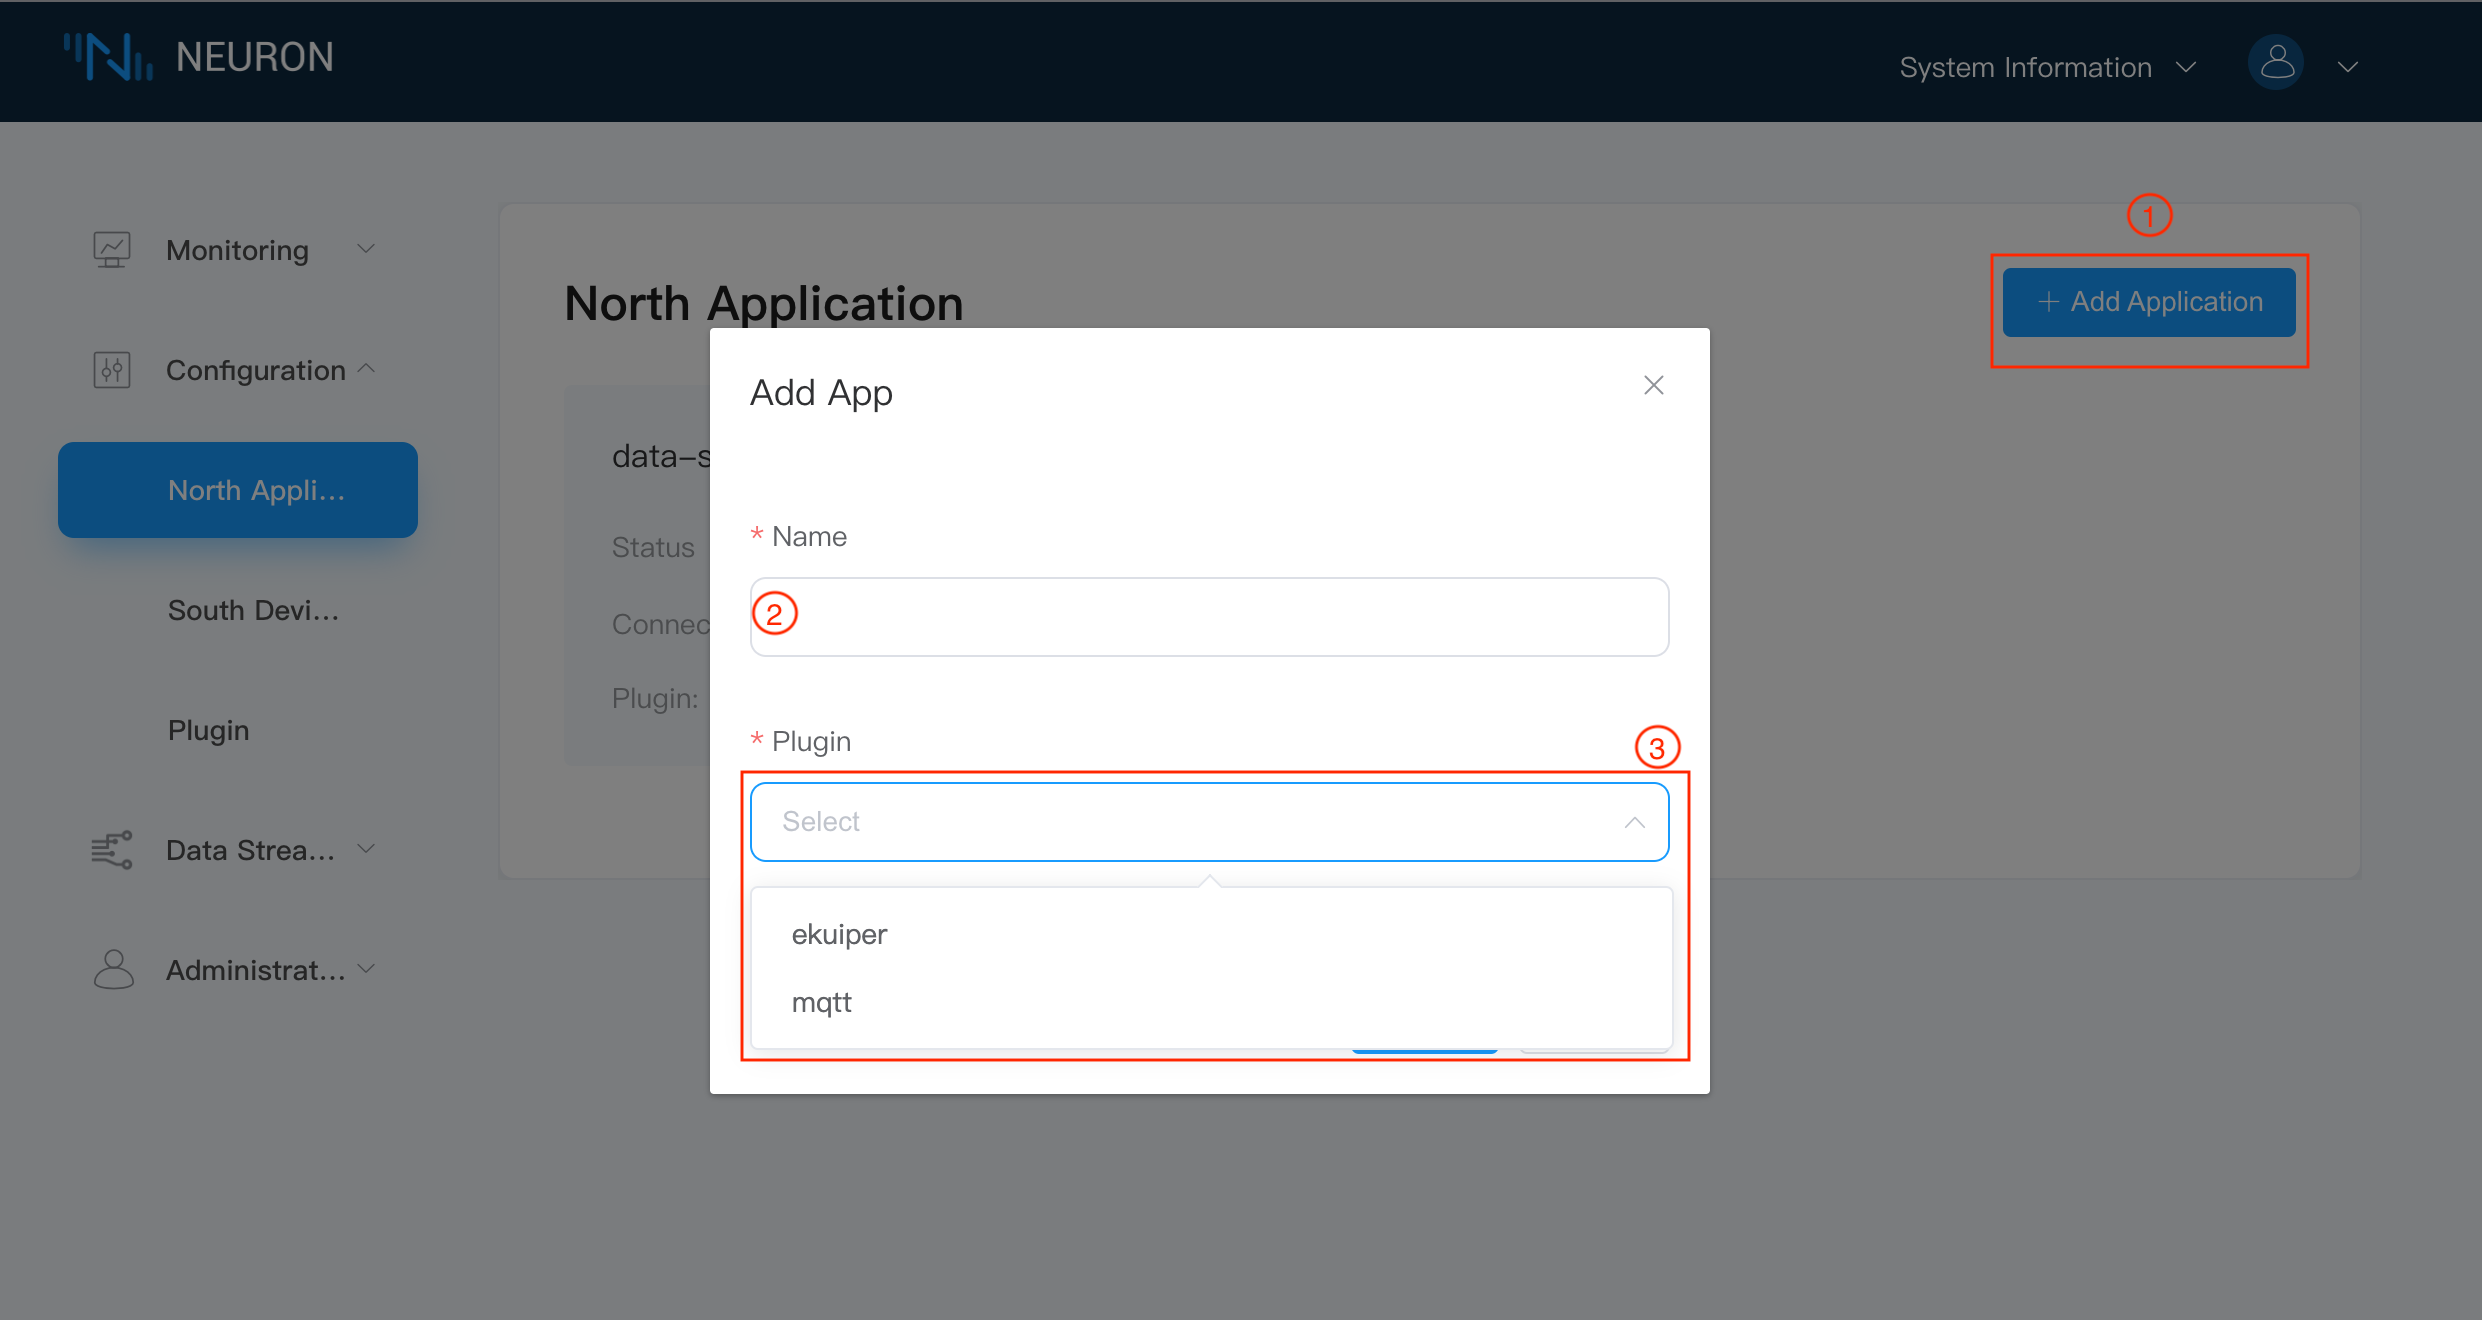
To add MQTT cloud connection module,
- Click on the
Add Applicationbutton in the top right hand corner. - Fill in the name of the application, for example, mqtt-1.
- The drop-down box shows the northbound applications available for this software version, in this case we choose the mqtt plugin.
Step 14 Manage northbound application node list
After the application node has been successfully created, an new application node will appear in the northbound application management screen, as shown below.
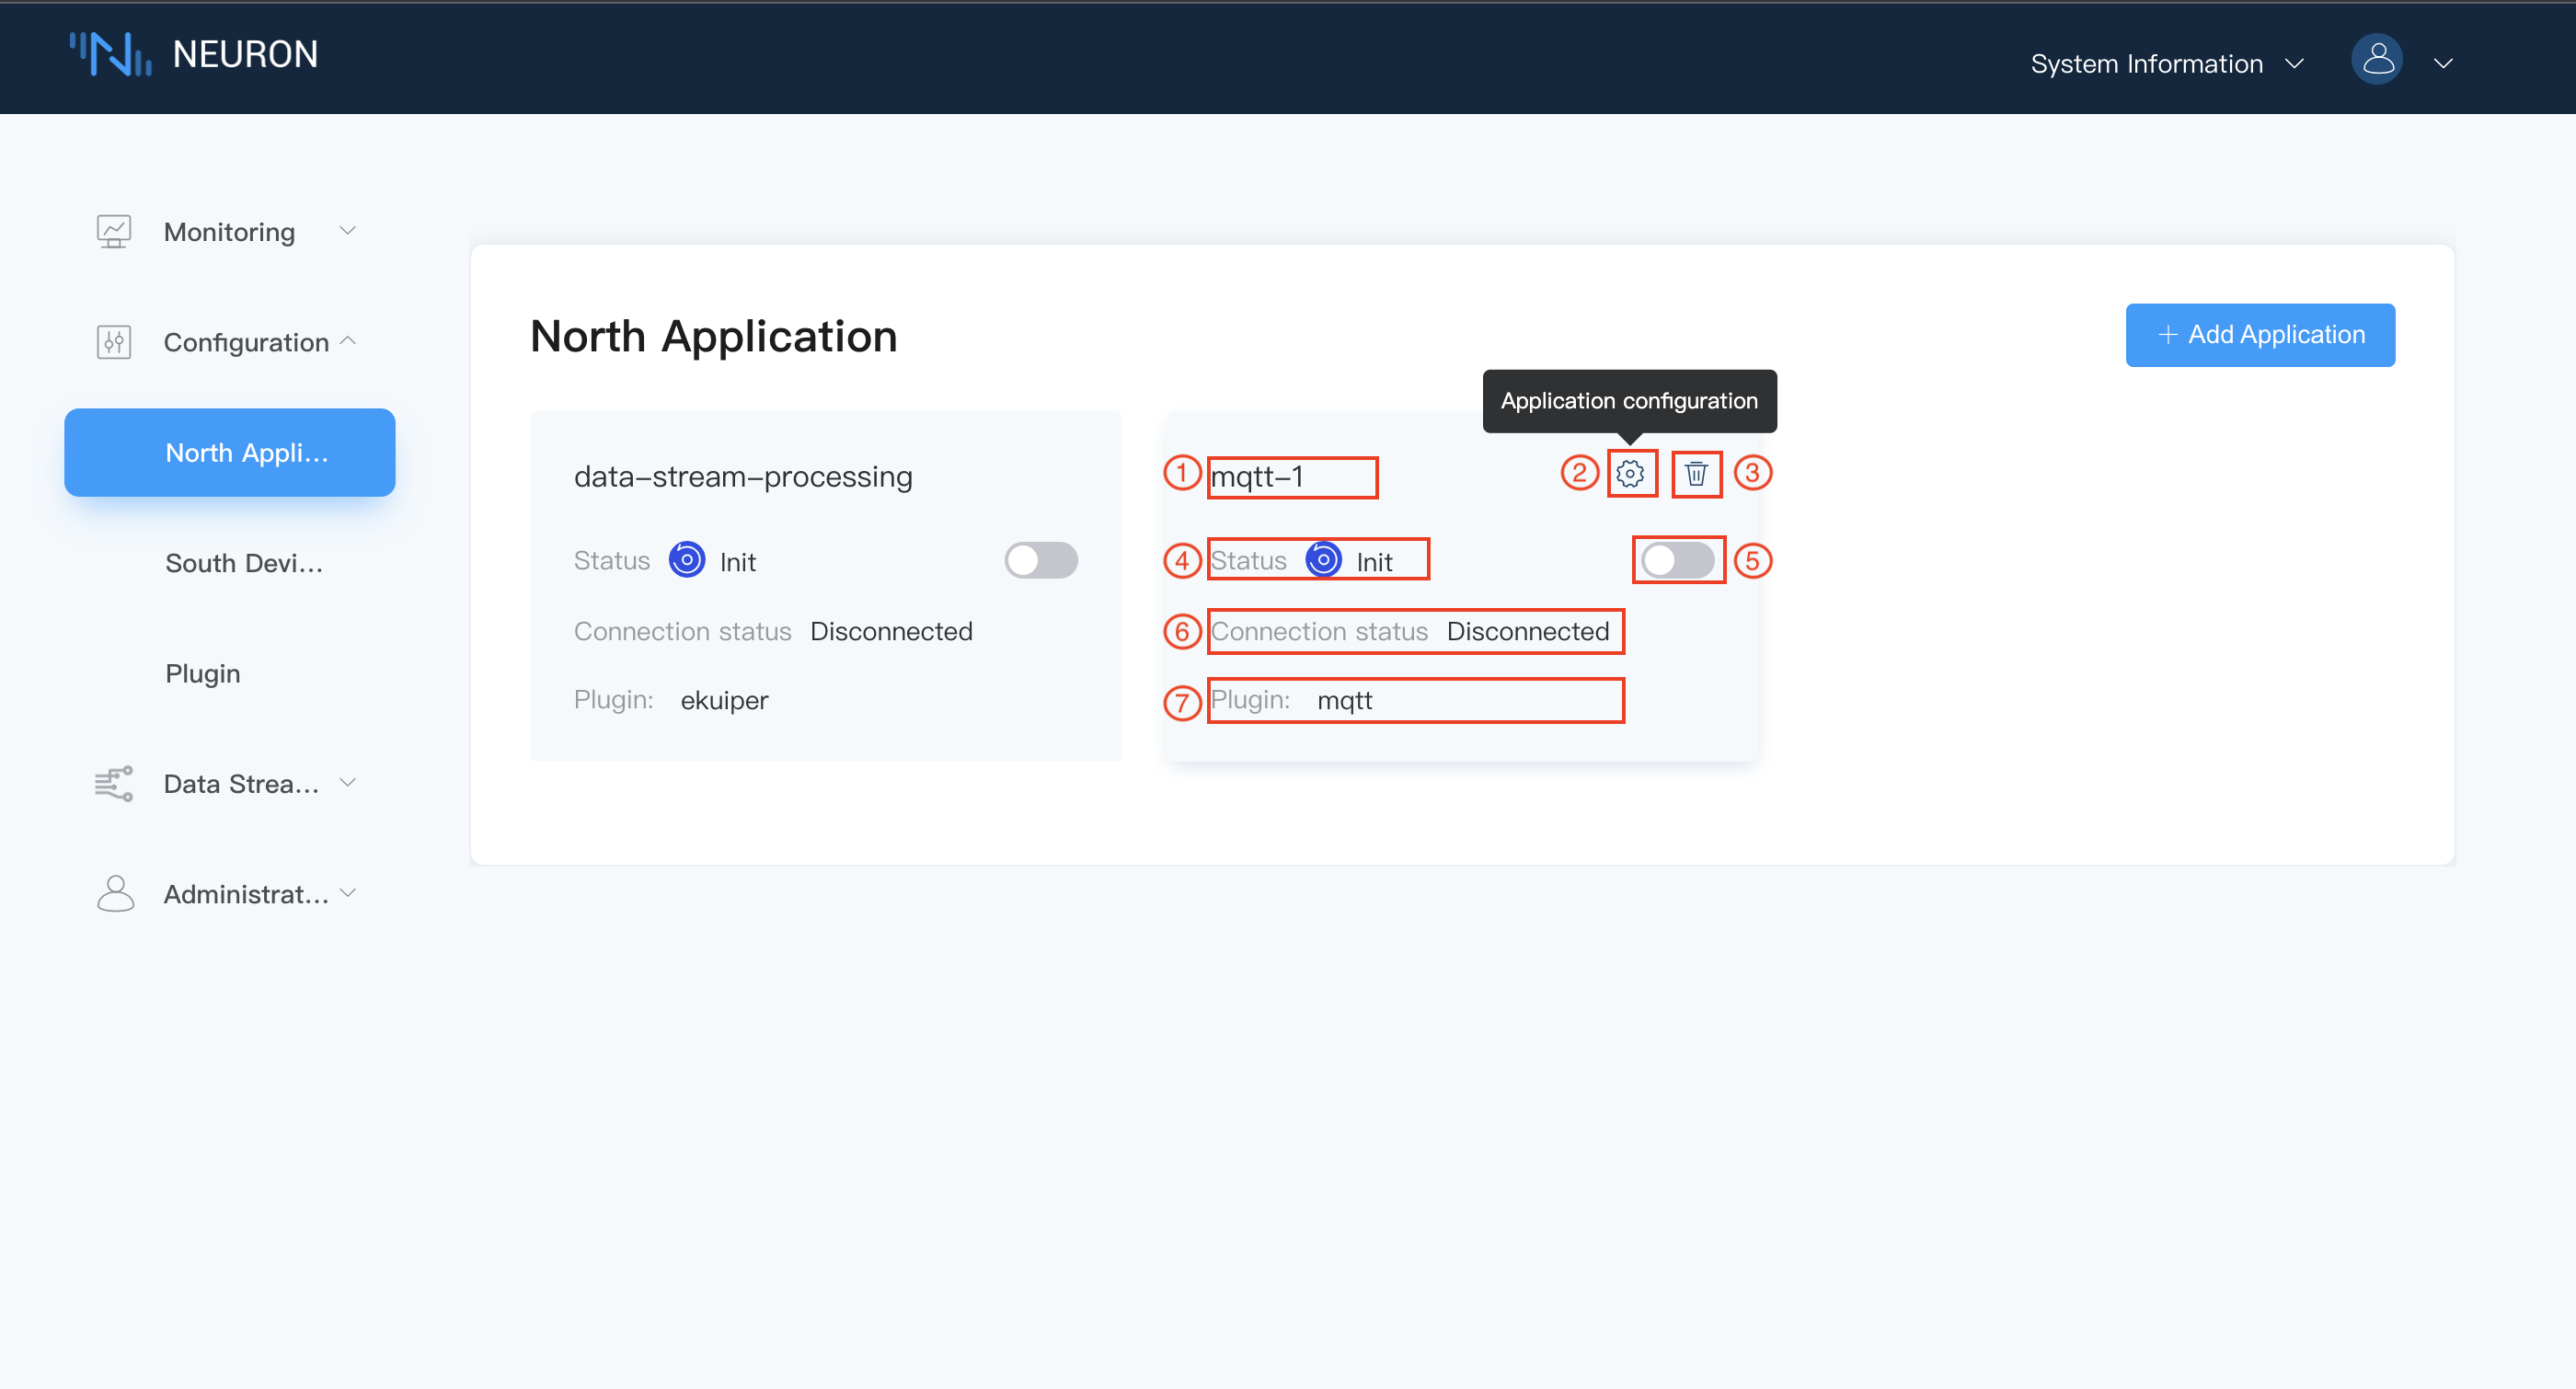
The device node contains the following information
- Application Name - the unique name you give to the application.
- Application Configuration Button - click on this button to show the application configuration screen.
- Delete Button - click on this to remove this application from northbound application list.
- Node Status - show the current status of application node, see below for details.
- State Change Button - switch on to connect to application.
- Connection Status - show connection status to application.
- Plugin Module Name - the name of plugin module used for this application.
There are five working status for each northbound application node.
- Init, the initial status for the first creation of northbound applications.
- Setup, when the configuration of application node is started, it goes to setup state.
- Ready, after successfully configuring the application node, it goes to ready state.
- Running, when the application node is started and is sending data to cloud. it goes running state.
- Stop, when the applicaiton node is stopped or for reason it can't connect to cloud, it goes to stop state.
Step 15 Setup northbound application parameters
Click on the Application Configuration button to enter the application configuration screen, as shown below.
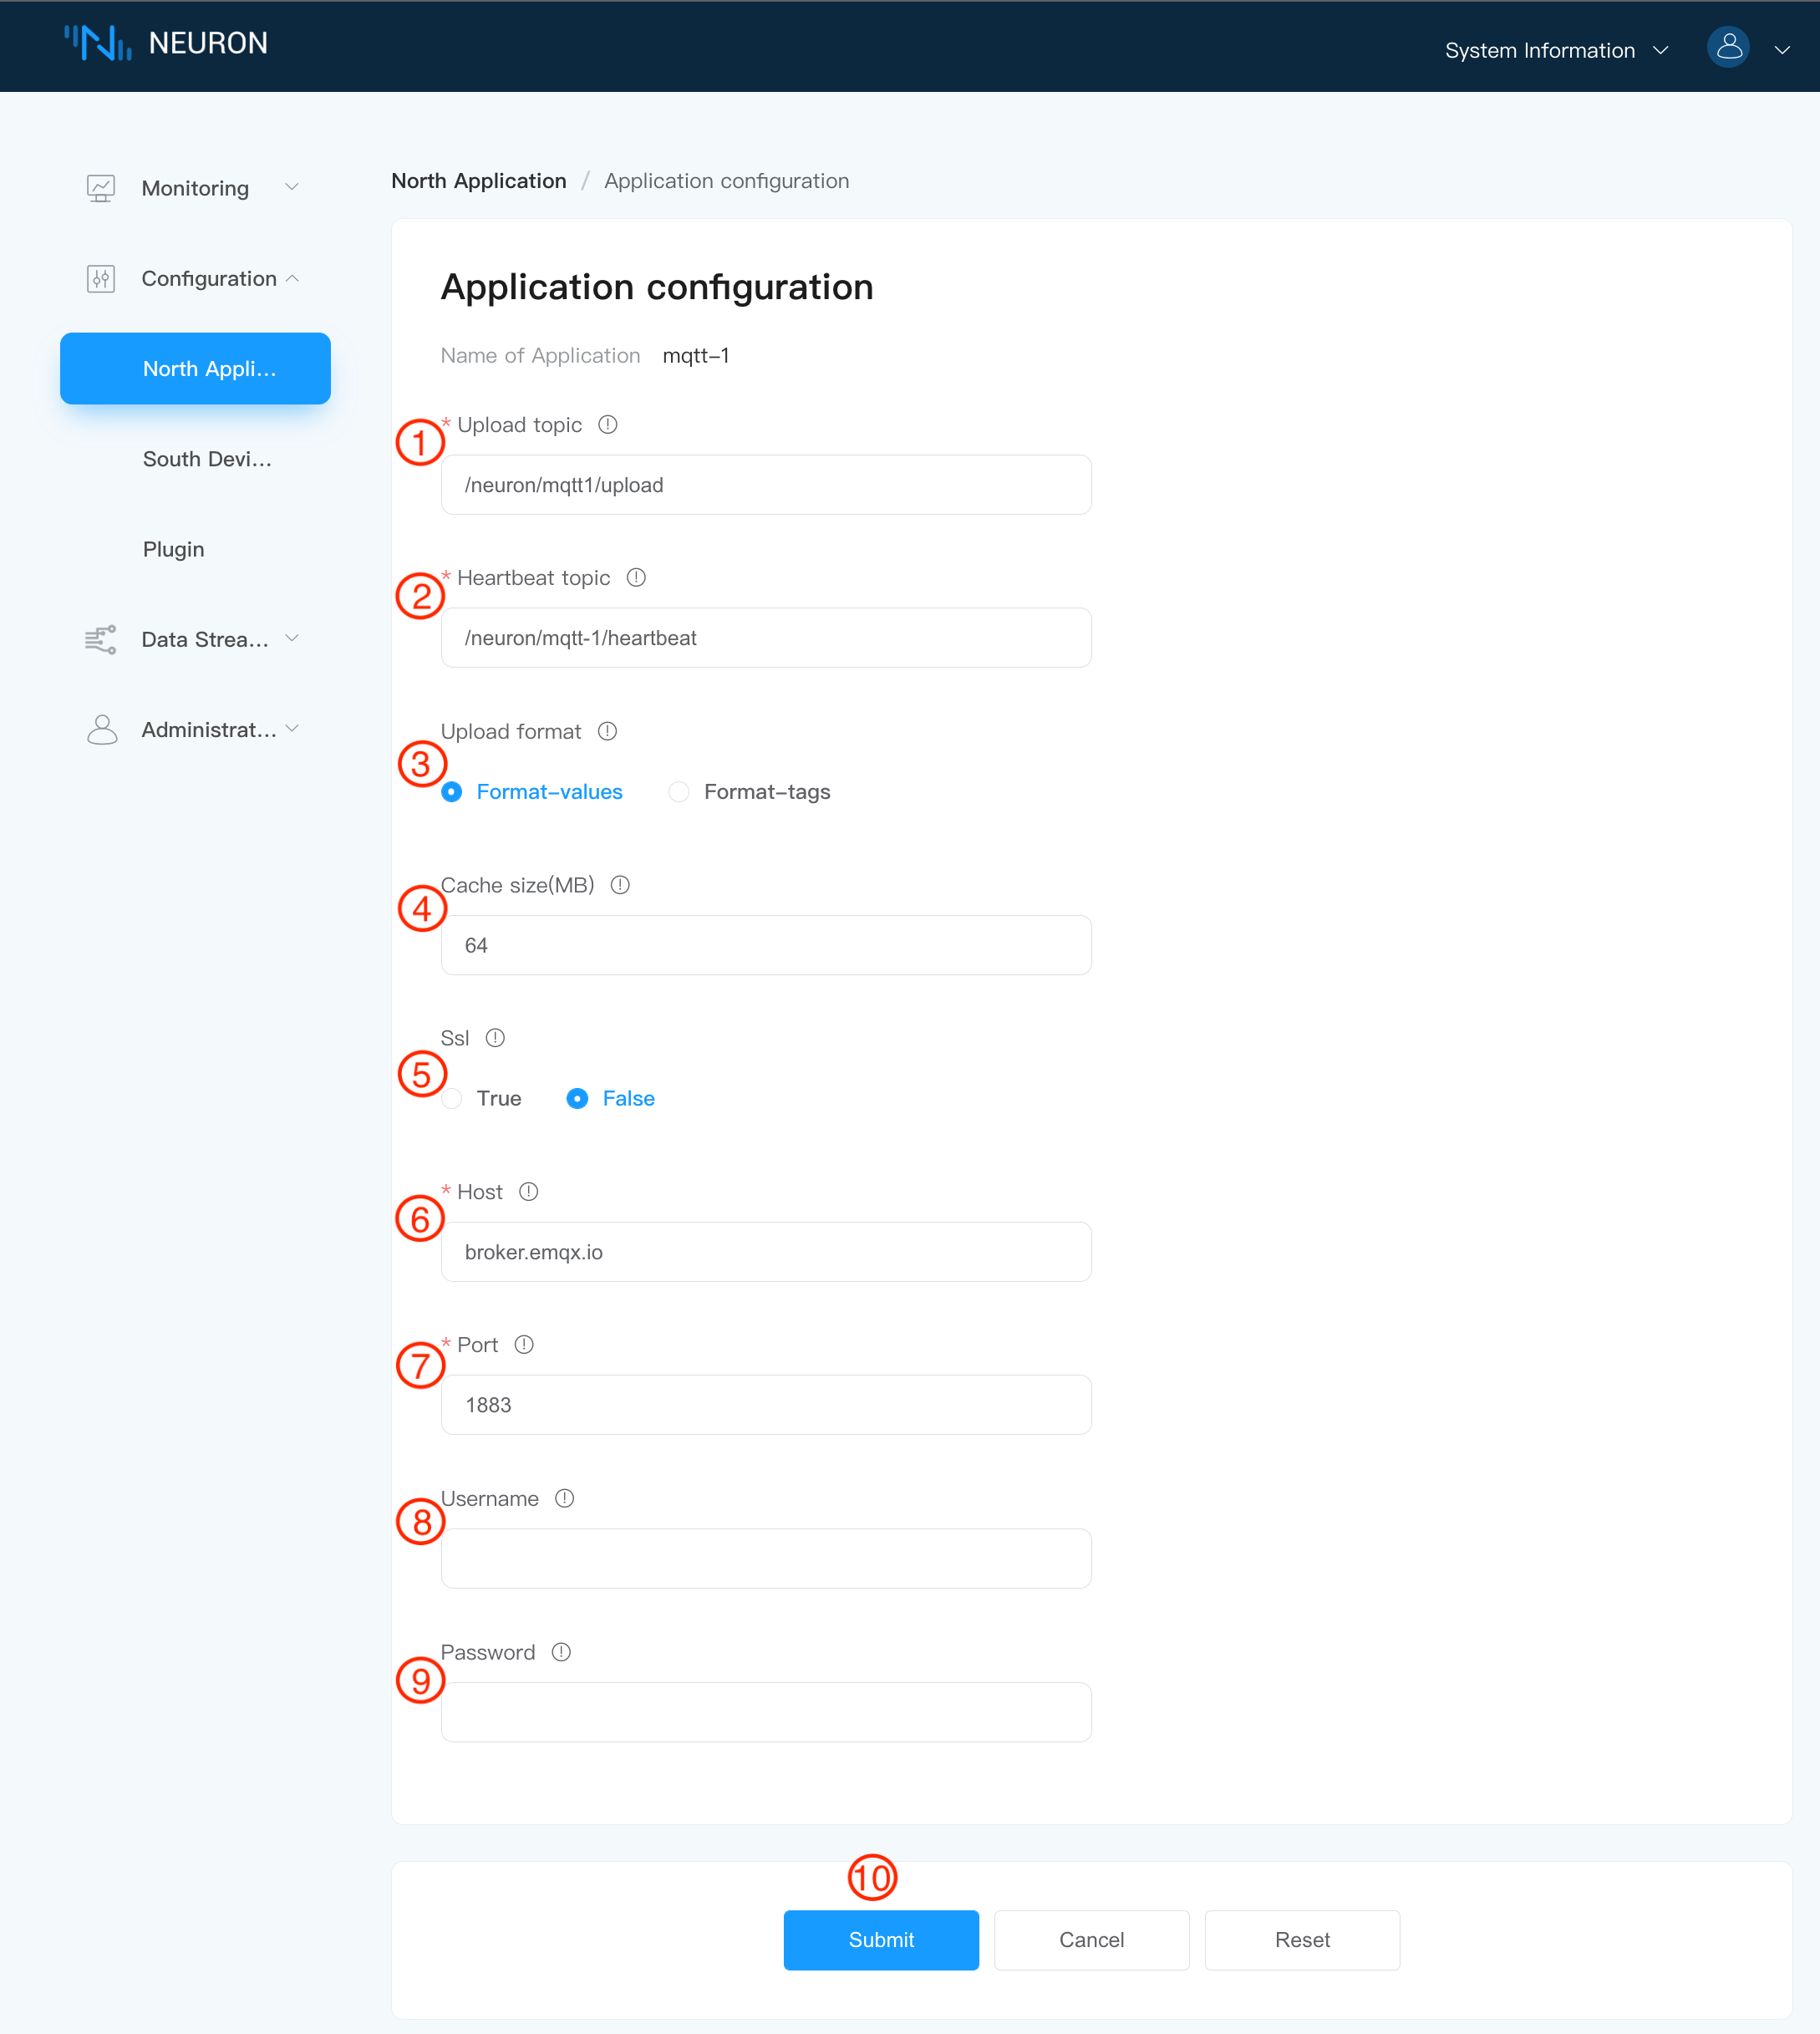
Items with * are required, and each item is followed by a field description key. Hovering over it will display a detailed description.
To setup MQTT connection,
- Required, fill in the topic of subscription data report, please refer to the MQTT API.
- Required, fill in the subject reported by the heartbeat message.
- Select the upload format.
- Optional, when the mqtt connection is abnormal, set the size limit of the uploaded data cache.
- Set up SSL authentication option.
- Fill in the hostname of MQTT Broker, where the default connection is to the emqx public broker.
- Fill in the port number of the MQTT Broker.
- Set up a username, which is optional.
- Set up a password, which is optional.
- Click on the
Submitbutton to complete the configuration of the northbound application, and the application card automatically enters the running state.
Step 16 Subscribe to southbound tag groups
Click any blank space of the application node to show the subscription group interface, as shown below.
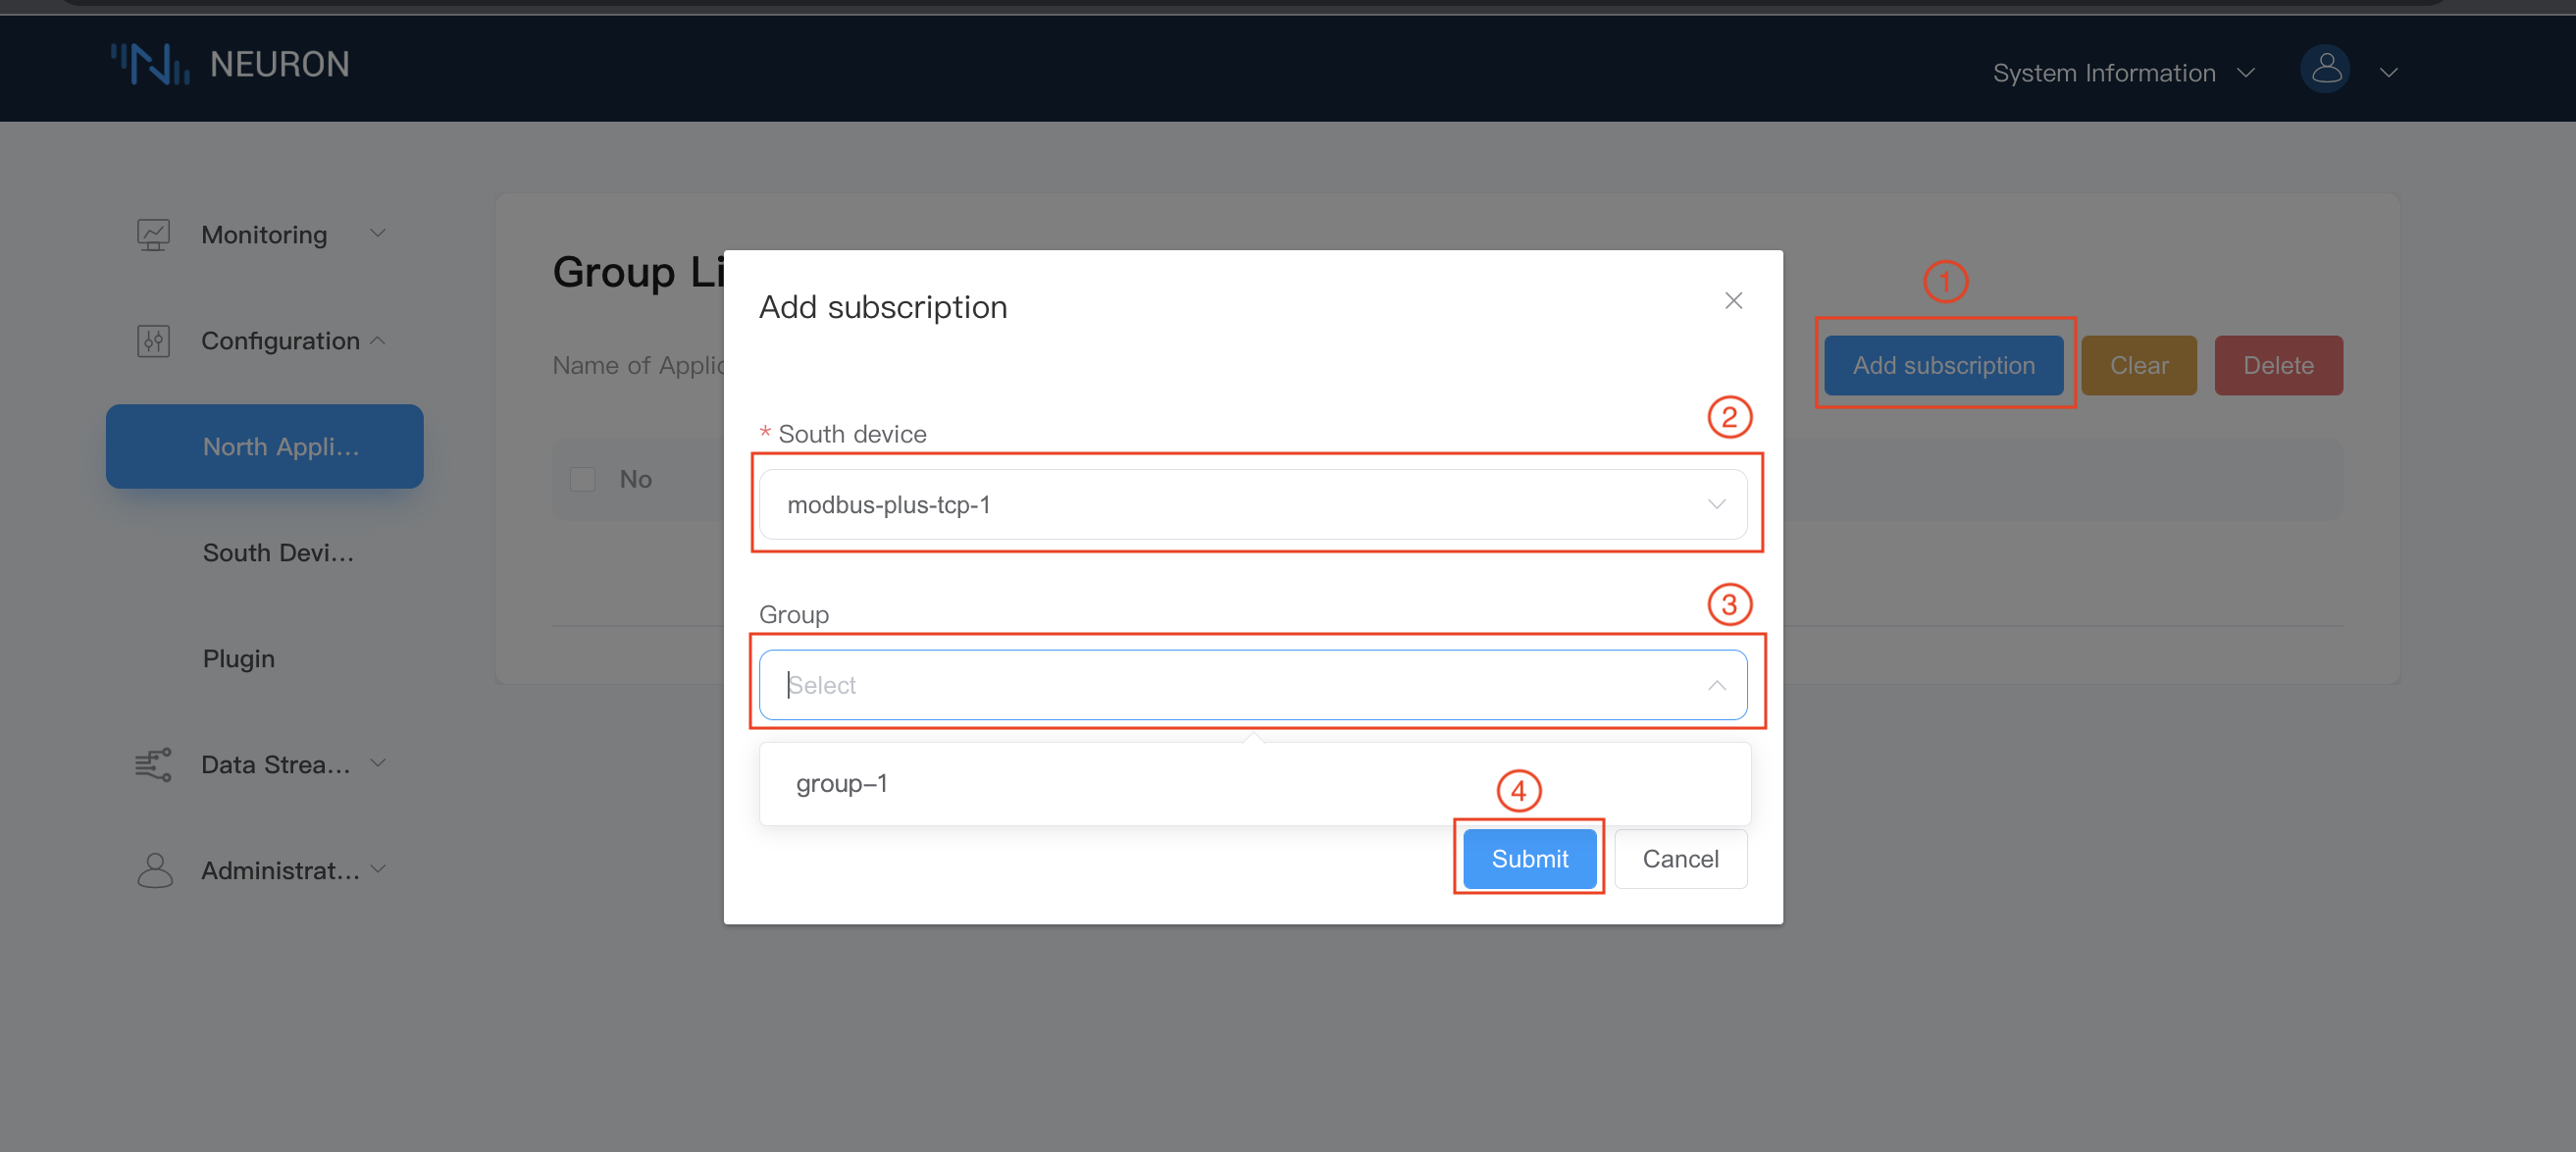
To subscribe data group of southbound devices,
- Click on the
Add subscriptionbutton in the upper-right corner to add a subscription. - Click on the drop down box to select the southbound device, in this case, we select the modbus-tcp-1 device built above.
- Select the Group you want to subscribe to in the drop-down box, in this case, we select the group-1 created above.
- Click on
Submitbutton to complete the subscription.
Step 17 Manage subscribed group list
After the subscription is added successfully, all subscribed Groups will be displayed in the Group list, as shown below.
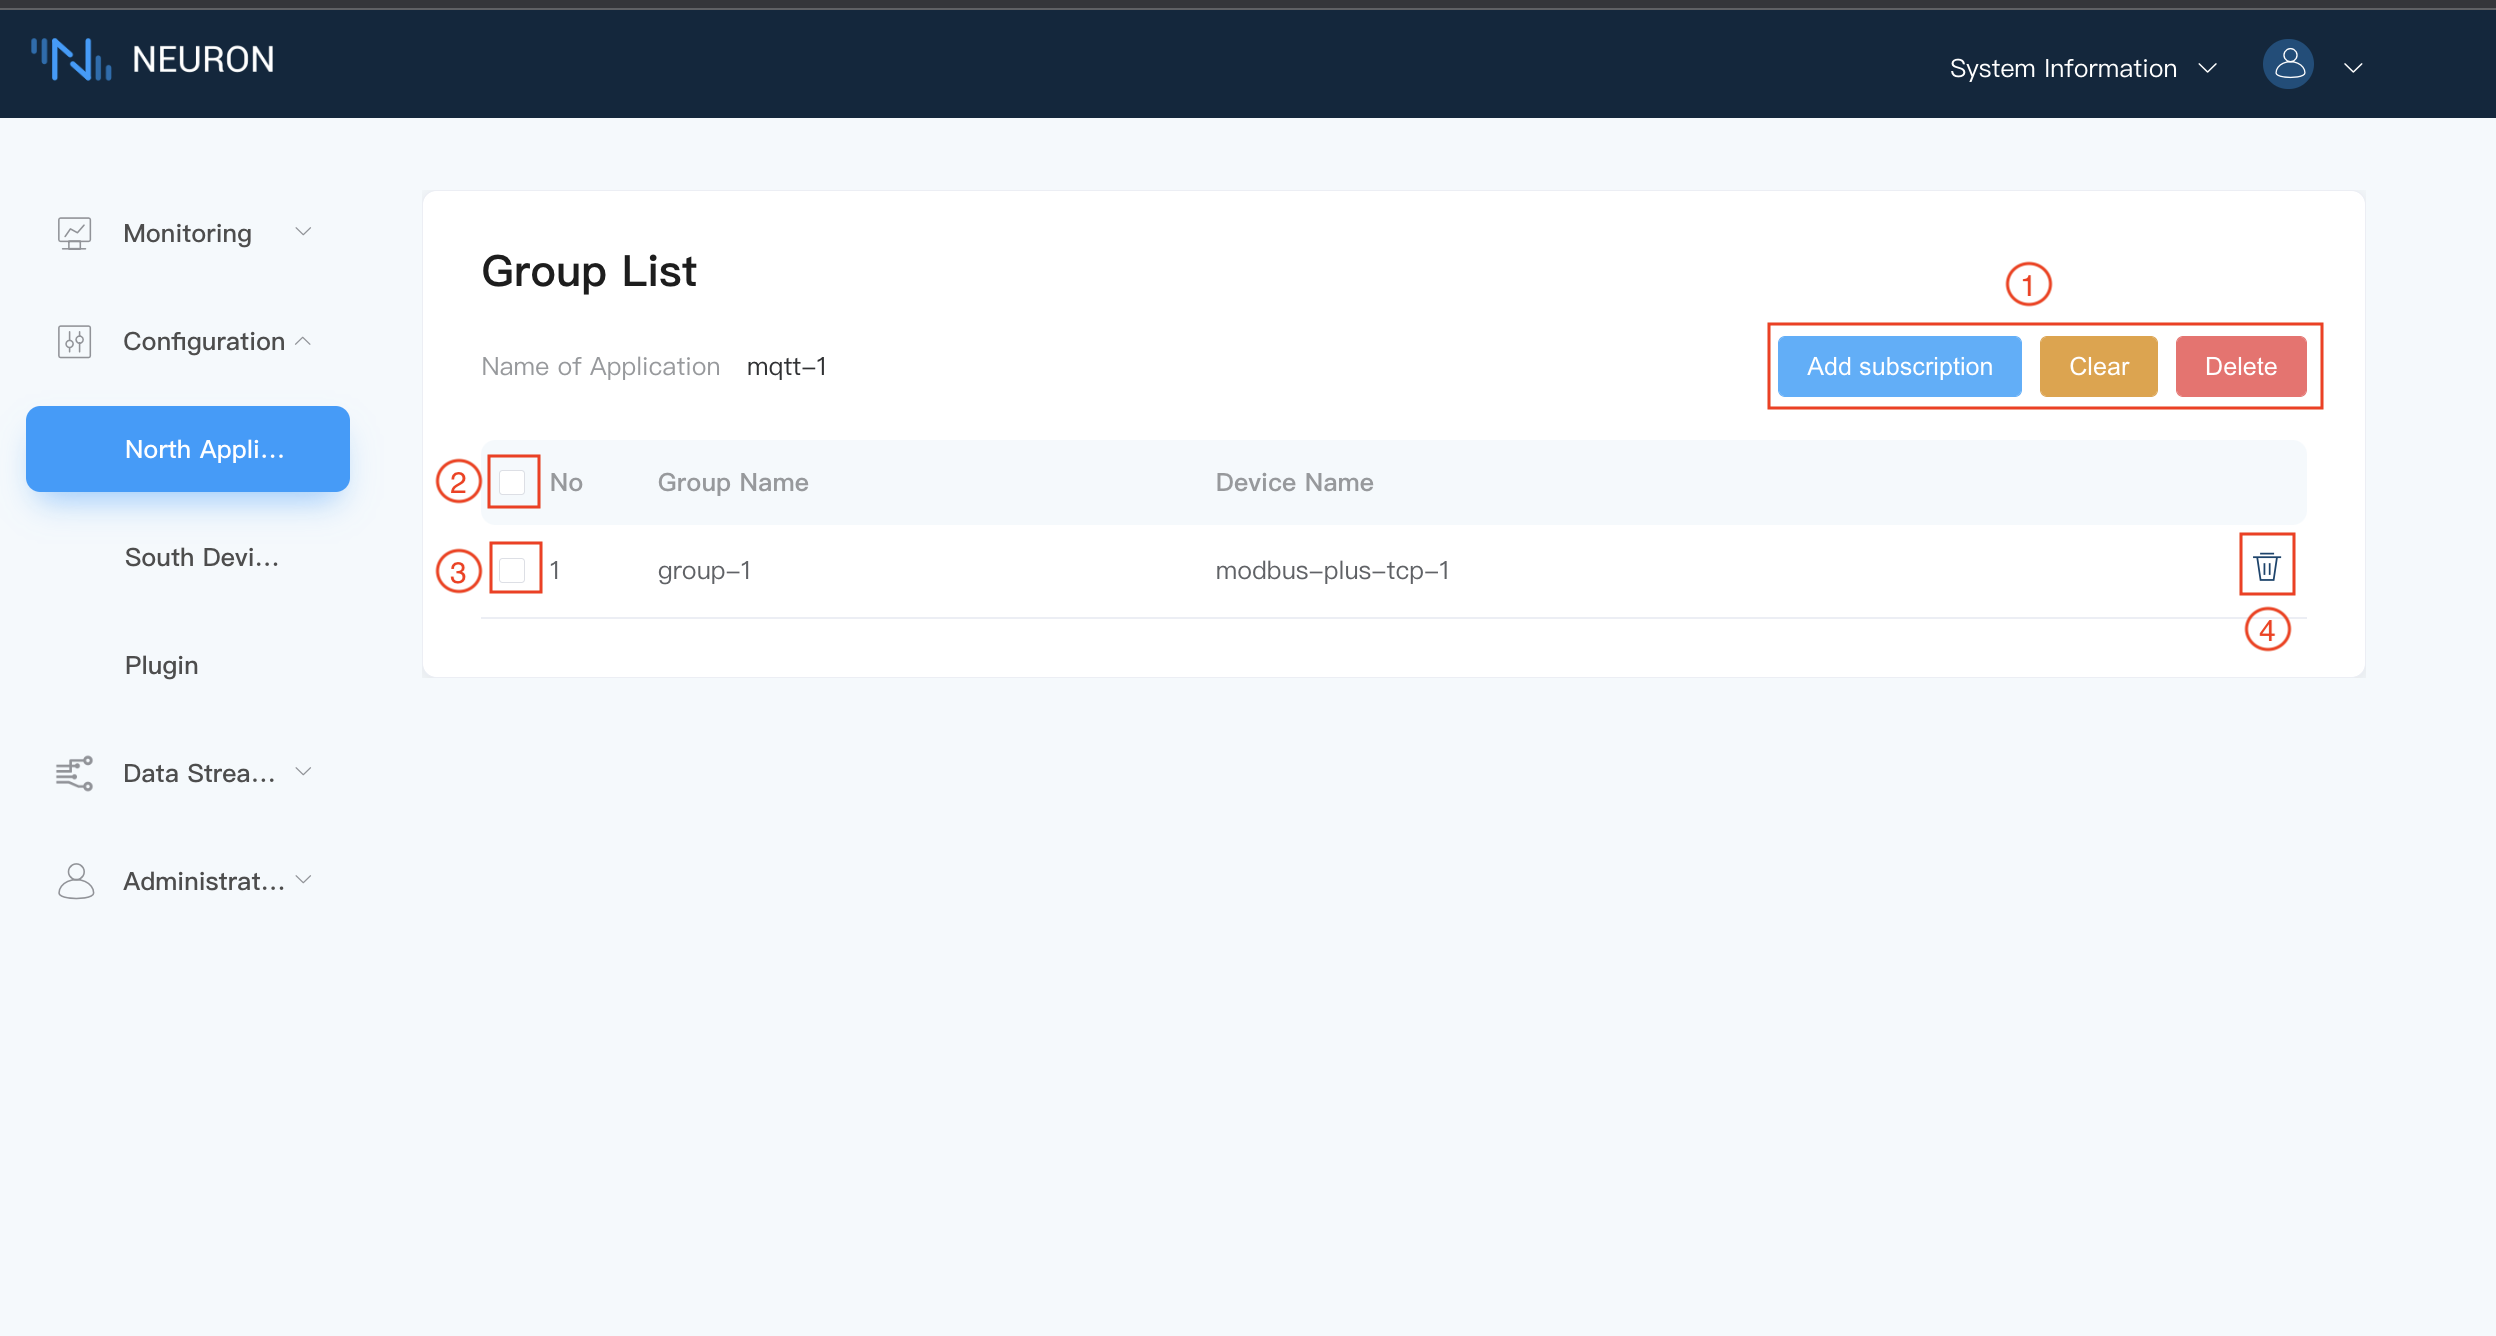
The Group list contains following components,
Clearbutton to cancel all subscribed groups with one click.Deletebutton, when selecting all, click theDeletebutton, the effect is equivalent toClear, which can cancel the subscription of all Groups. When you select some groups, and then click theDeletebutton, you can quickly cancel the subscription of the selected groups in batches.- Each group contains Group name, device name and
Deletebutton.
Step 18 Check over the payload in MQTT broker
Once the subscription is completed, we can use the MQTT client (MQTTX is recommended here and can be downloaded from the official website https://www.emqx.com/en/products/mqttx to connect to the EMQX broker to view the subscirbed topic's data, as shown below.
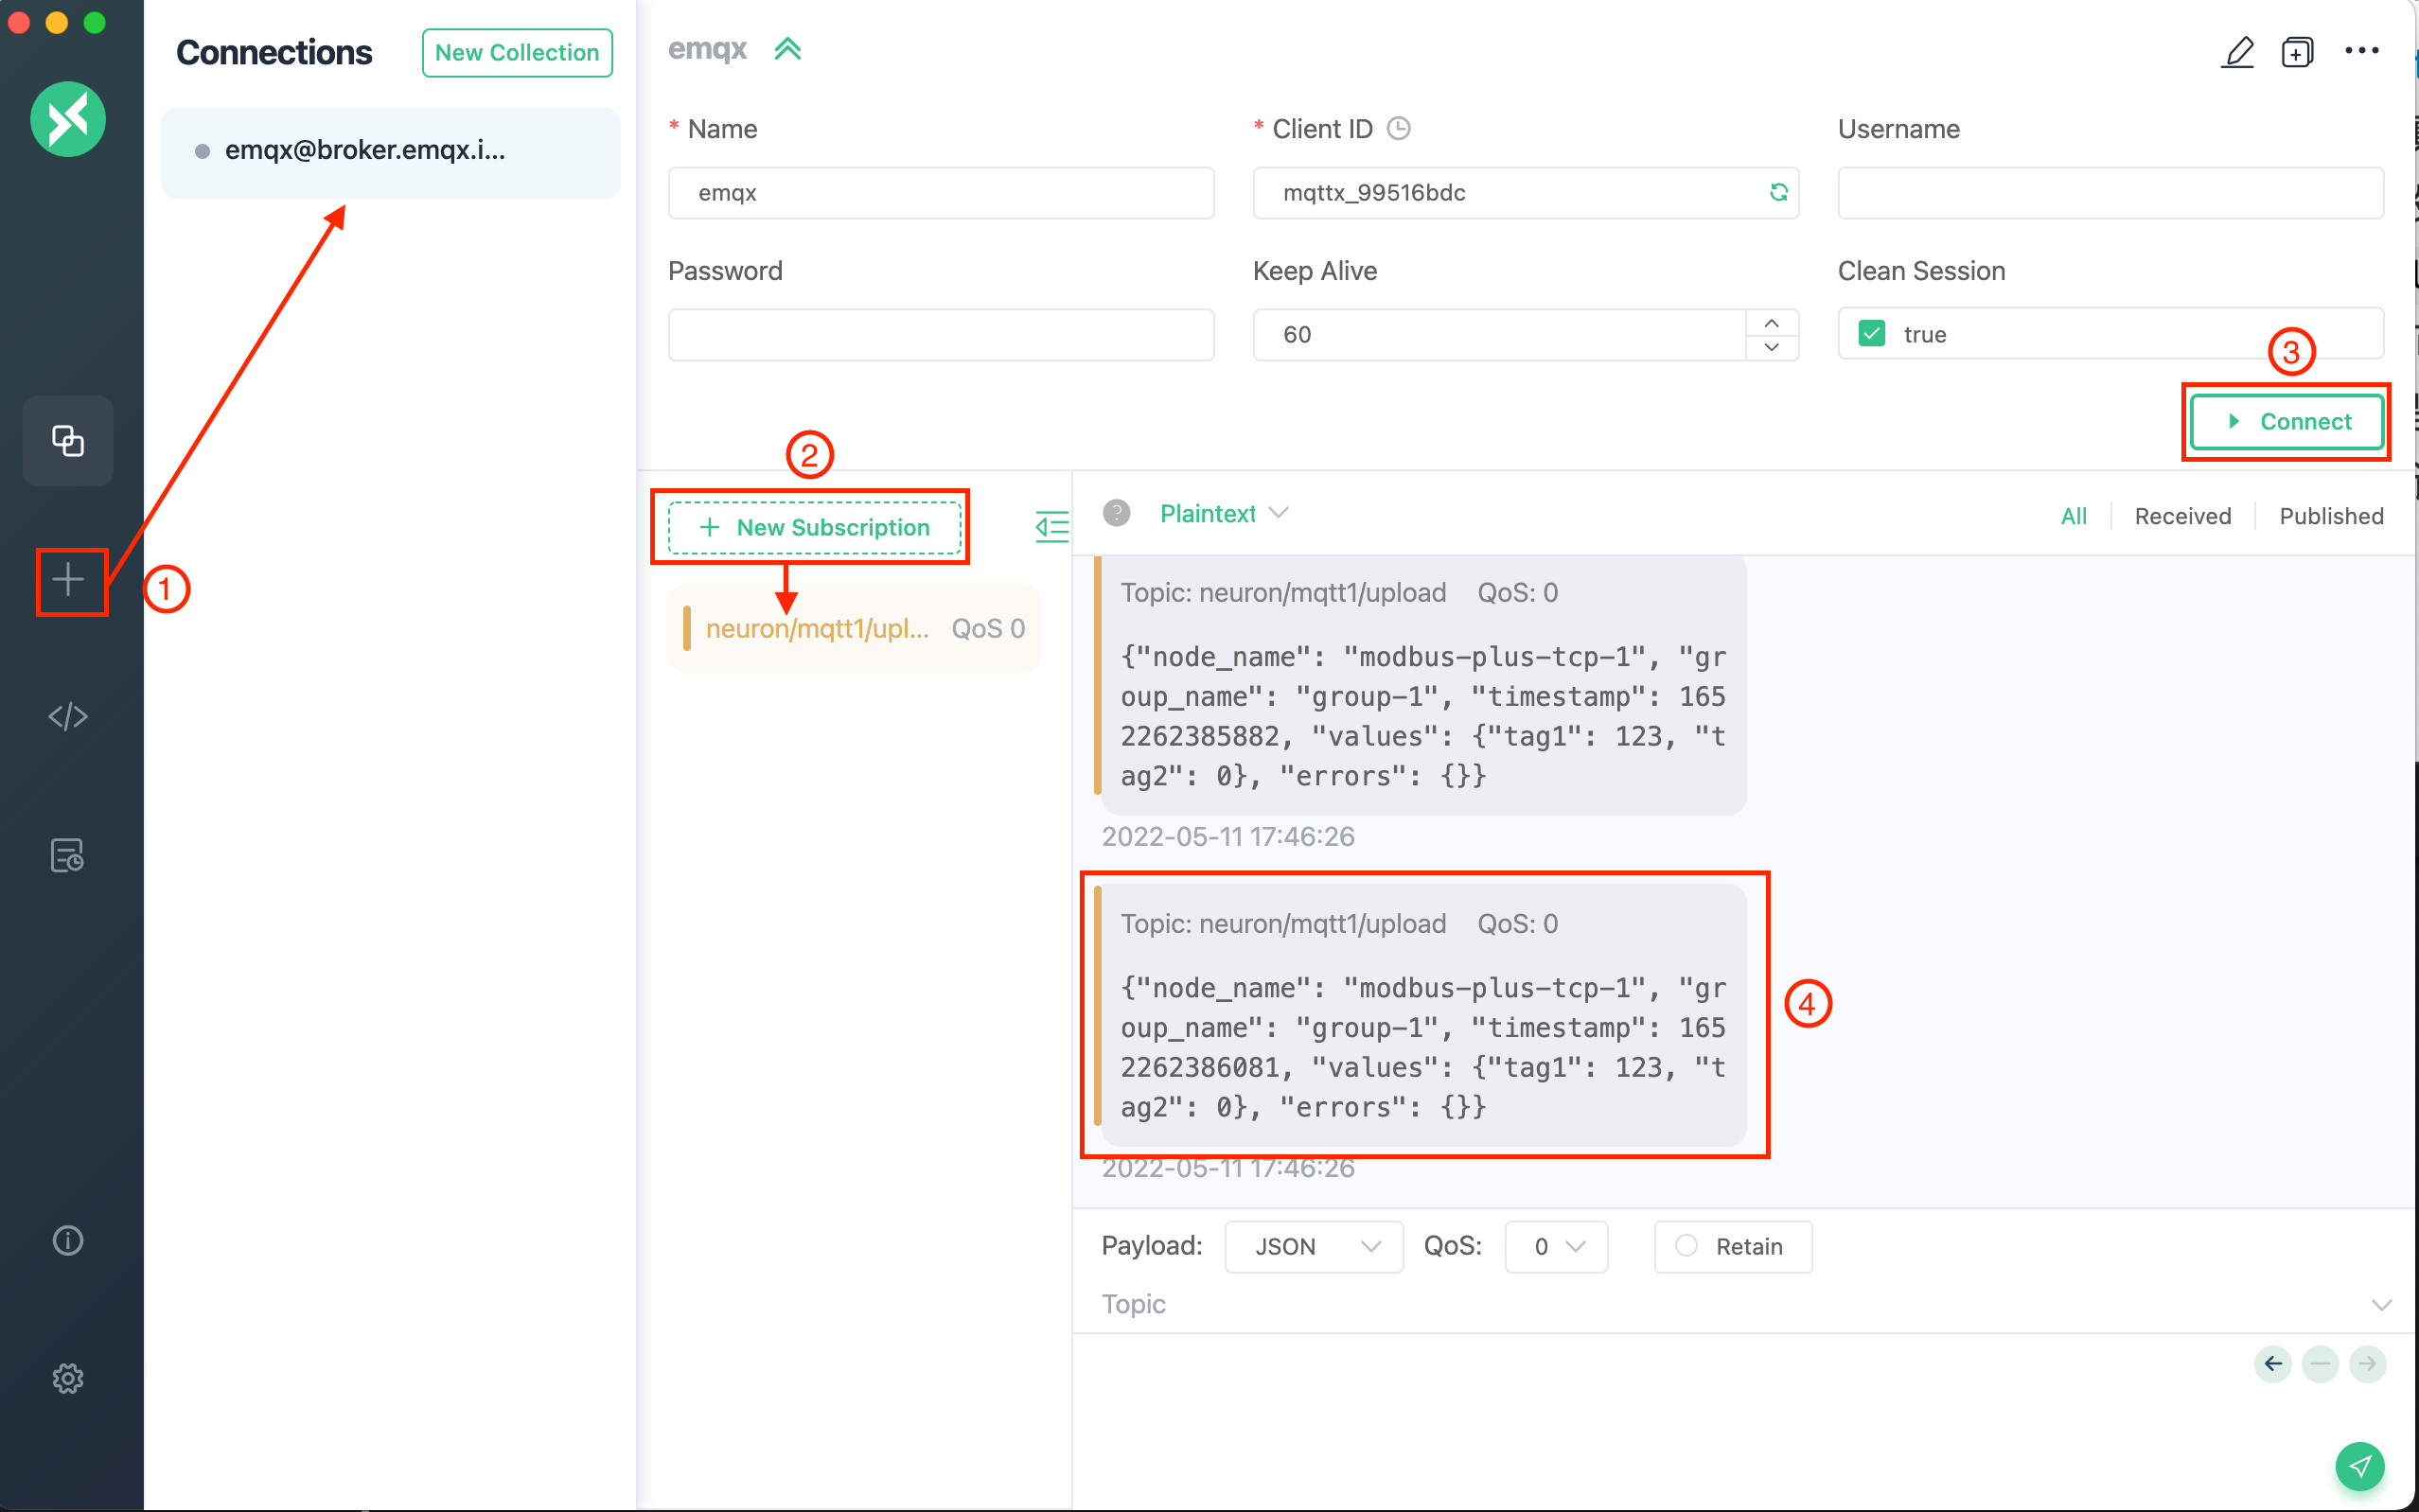
After successfully subscribed the topic, you can see that MQTTX can receive the data from Neuron.
Open MQTTX to add a new connection, Fill in the correct name and the Host and Port of the EMQX broker you have just connected, and then start the connection.
Add a new subscription, the default upload topic format is
/neuron/{node_name}/upload, where {node_name} is the configured in the northbound application node of MQTT, in this case, we fill inmqtt-1.
TIP
When the Subscribe attribute is set for the point, the changed value will be uploaded to the cloud only when the collected value changes.