Collect EMQX Logs In Kubernetes
Task Target
Use ELK to collect EMQX cluster logs.
Deploy ELK
ELK is the capitalized abbreviation of the three open source frameworks of Elasticsearch, Logstash, and Kibana, and is also known as the Elastic Stack. Elasticsearch is a near-real-time search platform framework based on Lucene, distributed, and interactive through Restful, also referred to as: es. Logstash is the central data flow engine of ELK, which is used to collect data in different formats from different targets (files/data storage/MQ), and supports after filtering Output to different destinations (file/MQ/redis/elasticsearch/kafka, etc.). Kibana can display es data on a page and provide real-time analysis functions.
Deploy Single Node Elasticsearch
The method of deploying single-node Elasticsearch is relatively simple. You can refer to the following YAML orchestration file to quickly deploy an Elasticsearch cluster.
Save the following content as a YAML file and deploy it via the
kubectl applycommandyaml--- apiVersion: v1 kind: Service metadata: name: elasticsearch-logging namespace: kube-logging labels: k8s-app: elasticsearch kubernetes.io/cluster-service: "true" addonmanager.kubernetes.io/mode: Reconcile spec: ports: - port: 9200 protocol: TCP targetPort: db selector: k8s-app: elasticsearch --- apiVersion: v1 kind: ServiceAccount metadata: name: elasticsearch-logging namespace: kube-logging labels: k8s-app: elasticsearch kubernetes.io/cluster-service: "true" addonmanager.kubernetes.io/mode: Reconcile --- kind: ClusterRole apiVersion: rbac.authorization.k8s.io/v1 metadata: name: elasticsearch-logging labels: k8s-app: elasticsearch kubernetes.io/cluster-service: "true" addonmanager.kubernetes.io/mode: Reconcile rules: - apiGroups: - "" resources: - "services" - "namespaces" - "endpoints" verbs: - "get" --- kind: ClusterRoleBinding apiVersion: rbac.authorization.k8s.io/v1 metadata: namespace: kube-logging name: elasticsearch-logging labels: k8s-app: elasticsearch kubernetes.io/cluster-service: "true" addonmanager.kubernetes.io/mode: Reconcile subjects: - kind: ServiceAccount name: elasticsearch-logging namespace: kube-logging apiGroup: "" roleRef: kind: ClusterRole name: elasticsearch apiGroup: "" --- apiVersion: apps/v1 kind: StatefulSet metadata: name: elasticsearch-logging namespace: kube-logging labels: k8s-app: elasticsearch kubernetes.io/cluster-service: "true" addonmanager.kubernetes.io/mode: Reconcile spec: serviceName: elasticsearch-logging replicas: 1 selector: matchLabels: k8s-app: elasticsearch template: metadata: labels: k8s-app: elasticsearch spec: serviceAccountName: elasticsearch-logging containers: - image: docker.io/library/elasticsearch:7.9.3 name: elasticsearch-logging limits: cpu: 1000m memory: 1Gi requests: cpu: 100m memory: 500Mi ports: - containerPort: 9200 name: db protocol: TCP - containerPort: 9300 name: transport protocol: TCP volumeMounts: - name: elasticsearch-logging mountPath: /usr/share/elasticsearch/data/ env: - name: "NAMESPACE" valueFrom: fieldRef: fieldPath: metadata.namespace - name: "discovery.type" value: "single-node" - name: ES_JAVA_OPTS value: "-Xms512m -Xmx2g" # Elasticsearch requires vm.max_map_count to be at least 262144. # If your OS already sets up this number to a higher value, feel free # to remove this init container. initContainers: - name: elasticsearch-logging-init image: alpine:3.6 command: ["/sbin/sysctl", "-w", "vm.max_map_count=262144"] securityContext: privileged: true - name: increase-fd-ulimit image: busybox imagePullPolicy: IfNotPresent command: ["sh", "-c", "ulimit -n 65536"] securityContext: privileged: true - name: elasticsearch-volume-init image: alpine:3.6 command: -chmod - -R - "777" - /usr/share/elasticsearch/data/ volumeMounts: - name: elasticsearch-logging mountPath: /usr/share/elasticsearch/data/ volumeClaimTemplates: - metadata: name: elasticsearch-logging spec: storageClassName: ${storageClassName} accessModes: [ "ReadWriteOnce" ] resources: requests: storage: 10GiThe
storageClassNamefield indicates the name ofStorageClass, you can use the commandkubectl get storageclassto get the StorageClass that already exists in the Kubernetes cluster, or you can create a StorageClass according to your own needs.Wait for the es to be ready, you can check the status of the es pod through the
kubectl getcommand, make sureSTATUSisRunningbash$ kubectl get pod -n kube-logging -l "k8s-app=elasticsearch" NAME READY STATUS RESTARTS AGE elasticsearch-0 1/1 Running 0 16m
Deploy Kibana
This article uses Deployment to deploy Kibana to visualize the collected logs. Service uses NodePort.
Save the following content as a YAML file and deploy it via the
kubectl applycommandyaml--- apiVersion: v1 kind: Service metadata: name: kibana namespace: kube-logging labels: k8s-app: kibana spec: type: NodePort - port: 5601 nodePort: 35601 protocol: TCP targetPort: ui selector: k8s-app: kibana --- apiVersion: apps/v1 kind: Deployment metadata: name: kibana namespace: kube-logging labels: k8s-app: kibana kubernetes.io/cluster-service: "true" addonmanager.kubernetes.io/mode: Reconcile spec: replicas: 1 selector: matchLabels: k8s-app: kibana template: metadata: labels: k8s-app: kibana annotations: seccomp.security.alpha.kubernetes.io/pod: 'docker/default' spec: containers: -name: kibana image: docker.io/kubeimages/kibana:7.9.3 resources: limits: cpu: 1000m requests: cpu: 100m env: # The access address of ES - name: ELASTICSEARCH_HOSTS value: http://elasticsearch-logging:9200 ports: - containerPort: 5601 name: ui protocol: TCPWait for Kibana to be ready, you can check the status of the Kibana pod through the
kubectl getcommand, make sureSTATUSisRunningbash$ kubectl get pod -n kube-logging -l "k8s-app=kibana" NAME READY STATUS RESTARTS AGE kibana-b7d98644-48gtm 1/1 Running 0 17mFinally, in the browser, enter
http://{node_ip}:35601, and you will enter the kibana web interface
Deploy Filebeat
Filebeat is a lightweight eating log collection component, which is part of the Elastic Stack and can work seamlessly with Logstash, Elasticsearch and Kibana. Whether you're transforming or enriching logs and files with Logstash, throwing around some data analysis in Elasticsearch, or building and sharing dashboards in Kibana, Filebeat makes it easy to get your data where it matters most.
Save the following content as a YAML file and deploy it via the
kubectl applycommandyaml--- apiVersion: v1 kind: ConfigMap metadata: name: filebeat-config namespace: kube-system labels: k8s-app: filebeat data: filebeat.yml: |- filebeat.inputs: - type: container paths: # The log path of the EMQX container on the host - /var/log/containers/^emqx.*.log processors: - add_kubernetes_metadata: host: ${NODE_NAME} matchers: - logs_path: logs_path: "/var/log/containers/" output.logstash: hosts: ["logstash:5044"] enabled: true --- apiVersion: v1 kind: ServiceAccount metadata: name: filebeat namespace: kube-logging labels: k8s-app: filebeat --- apiVersion: rbac.authorization.k8s.io/v1beta1 kind: ClusterRole metadata: name: filebeat labels: k8s-app: filebeat rules: - apiGroups: [""] resources: - namespaces - pods verbs: - get - watch - list --- apiVersion: rbac.authorization.k8s.io/v1beta1 kind: ClusterRoleBinding metadata: name: filebeat subjects: - kind: ServiceAccount name: filebeat namespace: kube-logging roleRef: kind: ClusterRole name: filebeat apiGroup: rbac.authorization.k8s.io --- apiVersion: apps/v1 kind: DaemonSet metadata: name: filebeat namespace: kube-logging labels: k8s-app: filebeat spec: selector: matchLabels: k8s-app: filebeat template: metadata: labels: k8s-app: filebeat spec: serviceAccountName: filebeat terminationGracePeriodSeconds: 30 containers: - name: filebeat image: docker.io/kubeimages/filebeat:7.9.3 args: [ "-c", "/etc/filebeat.yml", "-e","-httpprof","0.0.0.0:6060" ] env: - name: NODE_NAME valueFrom: fieldRef: fieldPath: spec.nodeName - name: ELASTICSEARCH_HOST value: elasticsearch - name: ELASTICSEARCH_PORT value: "9200" securityContext: runAsUser: 0 resources: limits: memory: 1000Mi cpu: 1000m requests: memory: 100Mi cpu: 100m volumeMounts: - name: config mountPath: /etc/filebeat.yml readOnly: true subPath: filebeat.yml - name: data mountPath: /usr/share/filebeat/data - name: varlibdockercontainers mountPath: /data/var/ readOnly: true -name: varlog mountPath: /var/log/ readOnly: true -name: timezone mountPath: /etc/localtime volumes: - name: config configMap: defaultMode: 0600 name: filebeat-config - name: varlibdockercontainers hostPath: path: /data/var/ -name: varlog hostPath: path: /var/log/ - name: inputs configMap: defaultMode: 0600 name: filebeat-inputs - name: data hostPath: path: /data/filebeat-data type: DirectoryOrCreate -name: timezone hostPath: path: /etc/localtimeWait for Filebeat to be ready, you can check the status of the Filebeat pod through the
kubectl getcommand, make sureSTATUSisRunningbash$ kubectl get pod -n kube-logging -l "k8s-app=filebeat" NAME READY STATUS RESTARTS AGE filebeat-82d2b 1/1 Running 0 45m filebeat-vwrjn 1/1 Running 0 45m
Deploy Logstash
This is mainly to combine the business needs and the secondary utilization of logs, and Logstash is added for log cleaning. This article uses the Beats Input plugin of Logstash to collect logs, and uses the Ruby filter plugin to filter logs. Logstash also provides many other input and filtering plug-ins for users to use, and you can configure appropriate plug-ins according to your business needs.
Save the following content as a YAML file and deploy it via the
kubectl applycommandyaml--- apiVersion: v1 kind: Service metadata: name: logstash namespace: kube-system spec: ports: - port: 5044 targetPort: beats selector: k8s-app: logstash clusterIP: None --- apiVersion: apps/v1 kind: Deployment metadata: name: logstash namespace: kube-system spec: selector: matchLabels: k8s-app: logstash template: metadata: labels: k8s-app: logstash spec: containers: - image: docker.io/kubeimages/logstash:7.9.3 name: logstash ports: - containerPort: 5044 name: beats command: - logstash - '-f' - '/etc/logstash_c/logstash.conf' env: - name: "XPACK_MONITORING_ELASTICSEARCH_HOSTS" value: "http://elasticsearch-logging:9200" volumeMounts: - name: config-volume mountPath: /etc/logstash_c/ - name: config-yml-volume mountPath: /usr/share/logstash/config/ -name: timezone mountPath: /etc/localtime resources: limits: cpu: 1000m memory: 2048Mi requests: cpu: 512m memory: 512Mi volumes: - name: config-volume configMap: name: logstash-conf items: - key: logstash.conf path: logstash.conf -name: timezone hostPath: path: /etc/localtime - name: config-yml-volume configMap: name: logstash-yml items: - key: logstash.yml path: logstash.yml --- apiVersion: v1 kind: ConfigMap metadata: name: logstash-conf namespace: kube-logging labels: k8s-app: logstash data: logstash.conf: |- input { beats { port => 5044 } } filter { ruby { code => " ss = event.get('message').split(' ') len = ss. length() level = '' index = '' msg = '' if len == 0 || len < 2 event.set('level','invalid') return end if ss[1][0] == '[' l = ss[1].length() level = ss[1][1..l-2] index = 2 else level = 'info' index = 0 end event.set('level',level) for i in ss[index..len] msg = msg + i msg = msg + ' ' end event.set('message',msg) " } if [level] == "invalid" { drop {} } } output { elasticsearch { hosts => ["http://elasticsearch-logging:9200"] codec => json index => "logstash-%{+YYYY.MM.dd}" } } --- apiVersion: v1 kind: ConfigMap metadata: name: logstash namespace: kube-logging labels: k8s-app: logstash data: logstash.yml: |- http.host: "0.0.0.0" xpack.monitoring.elasticsearch.hosts: http://elasticsearch-logging:9200Wait for Logstash to be ready, you can view the status of the Logstash pod through the
kubectl getcommand, make sureSTATUSisRunningbash$ kubectl get pod -n kube-logging -l "k8s-app=logstash" NAME READY STATUS RESTARTS AGE filebeat-82d2b 1/1 Running 0 45m filebeat-vwrjn 1/1 Running 0 45m
Deploy EMQX Cluster
To deploy EMQX cluster, please refer to the document Deploy EMQX
Verify Log Collection
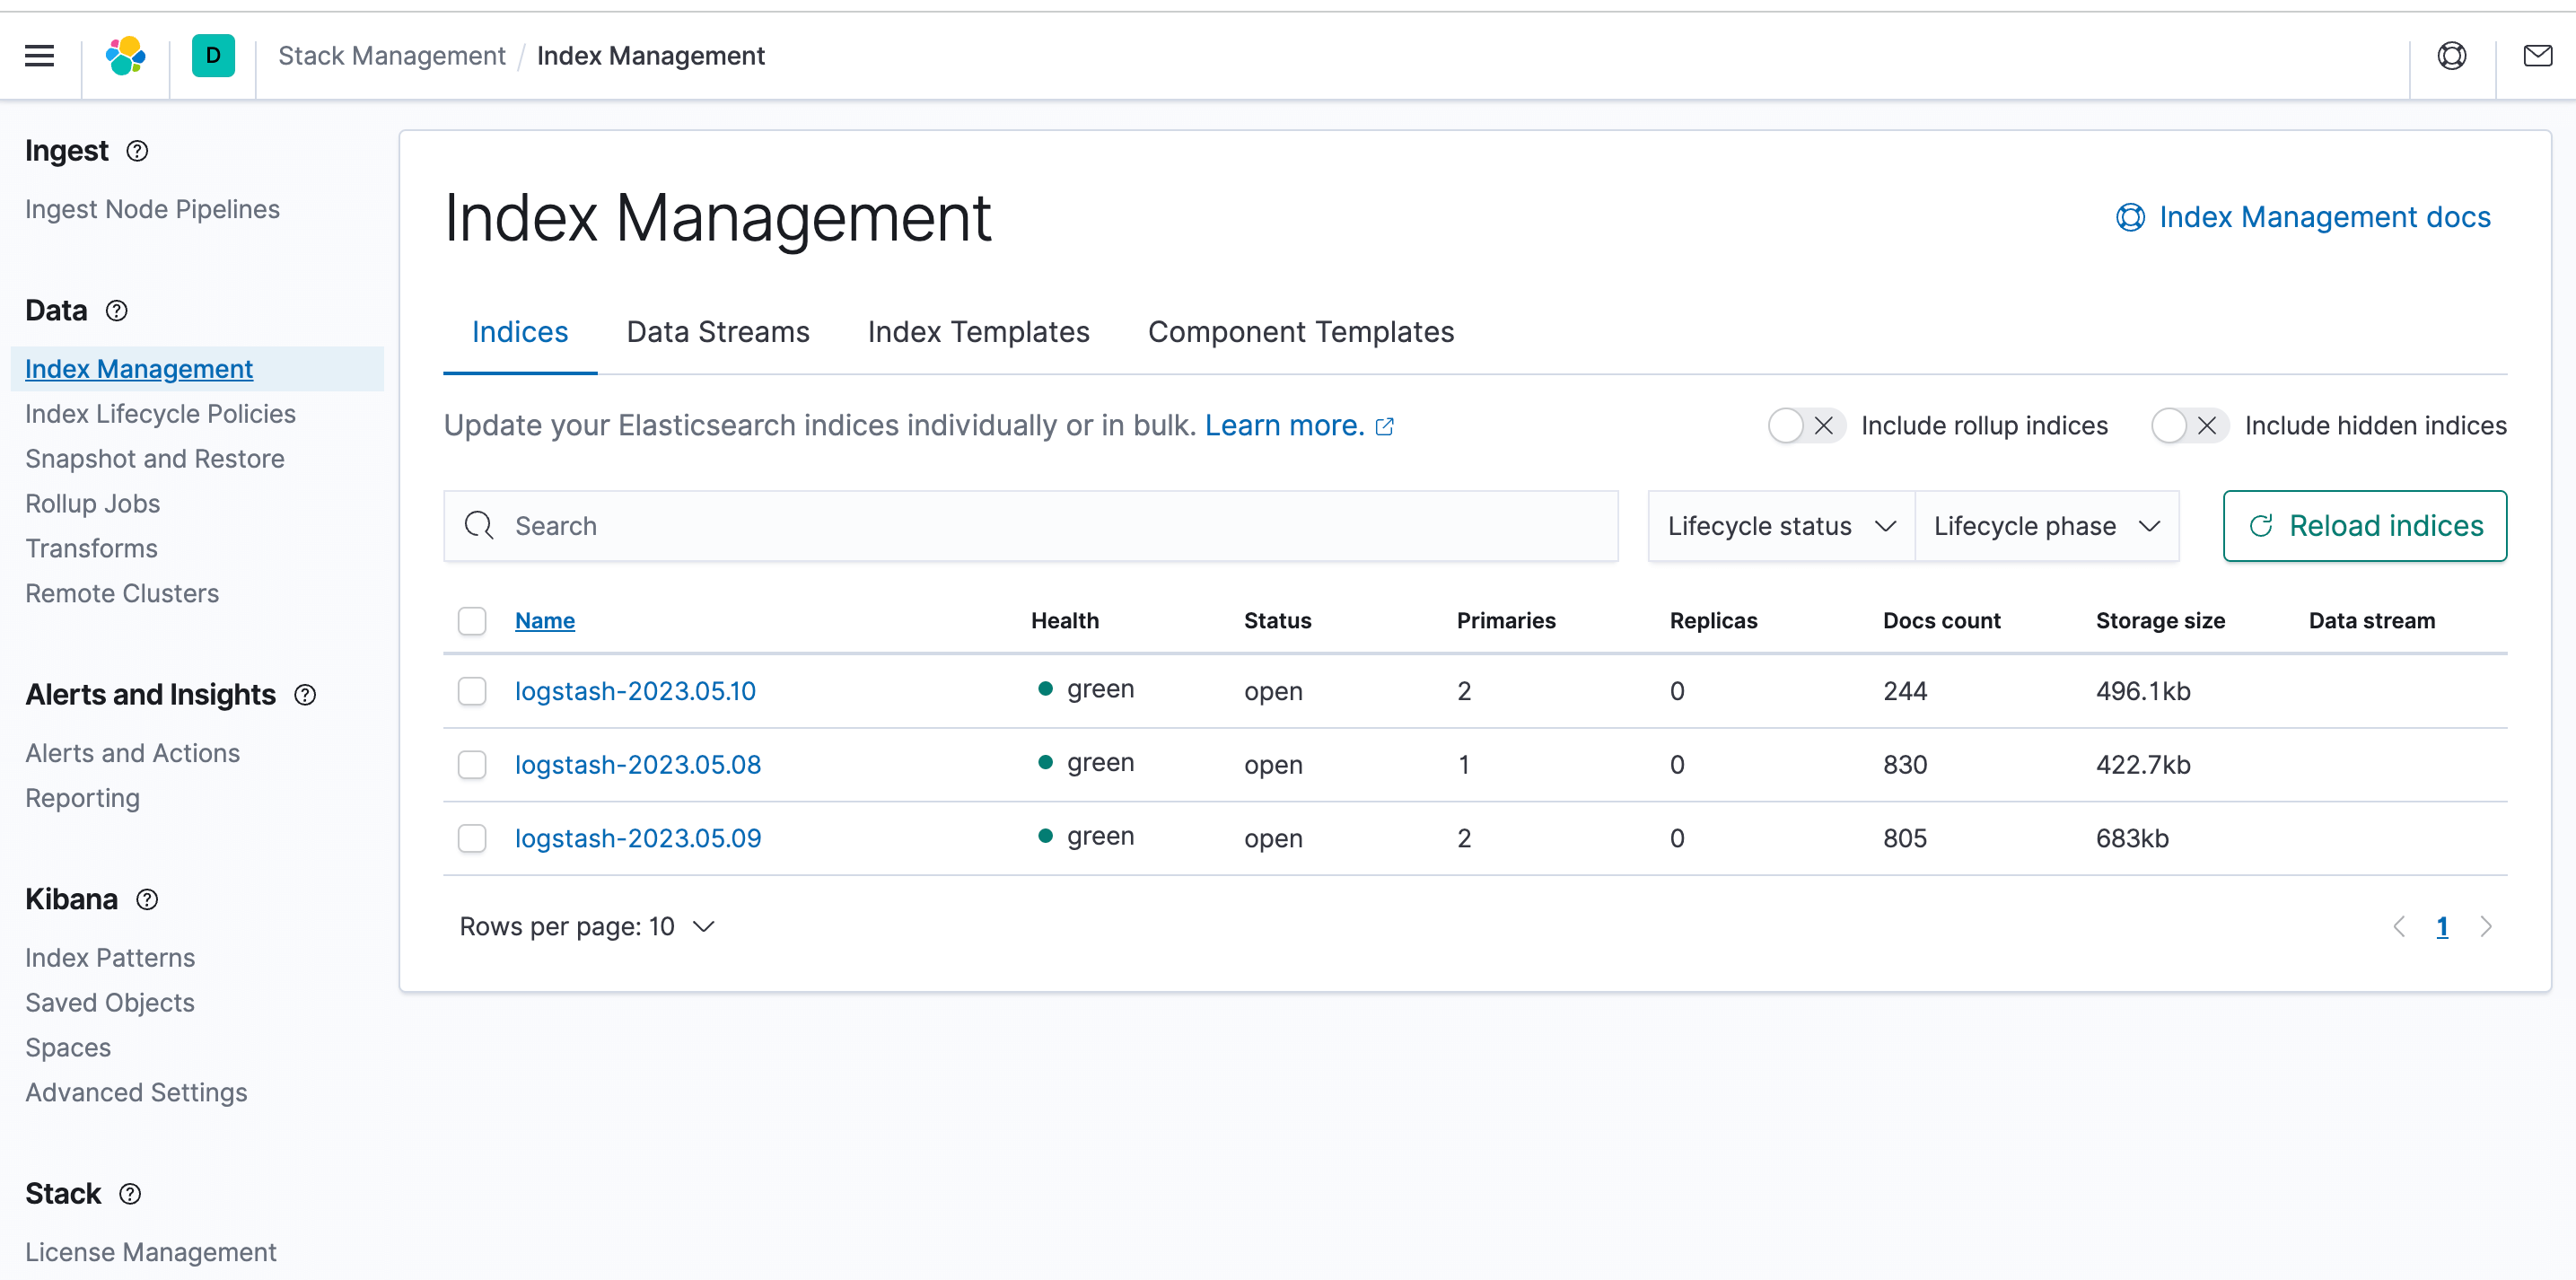
First log in to the Kibana interface, open the stack management module in the menu, click on the index management, you can find that there are already collected log indexes
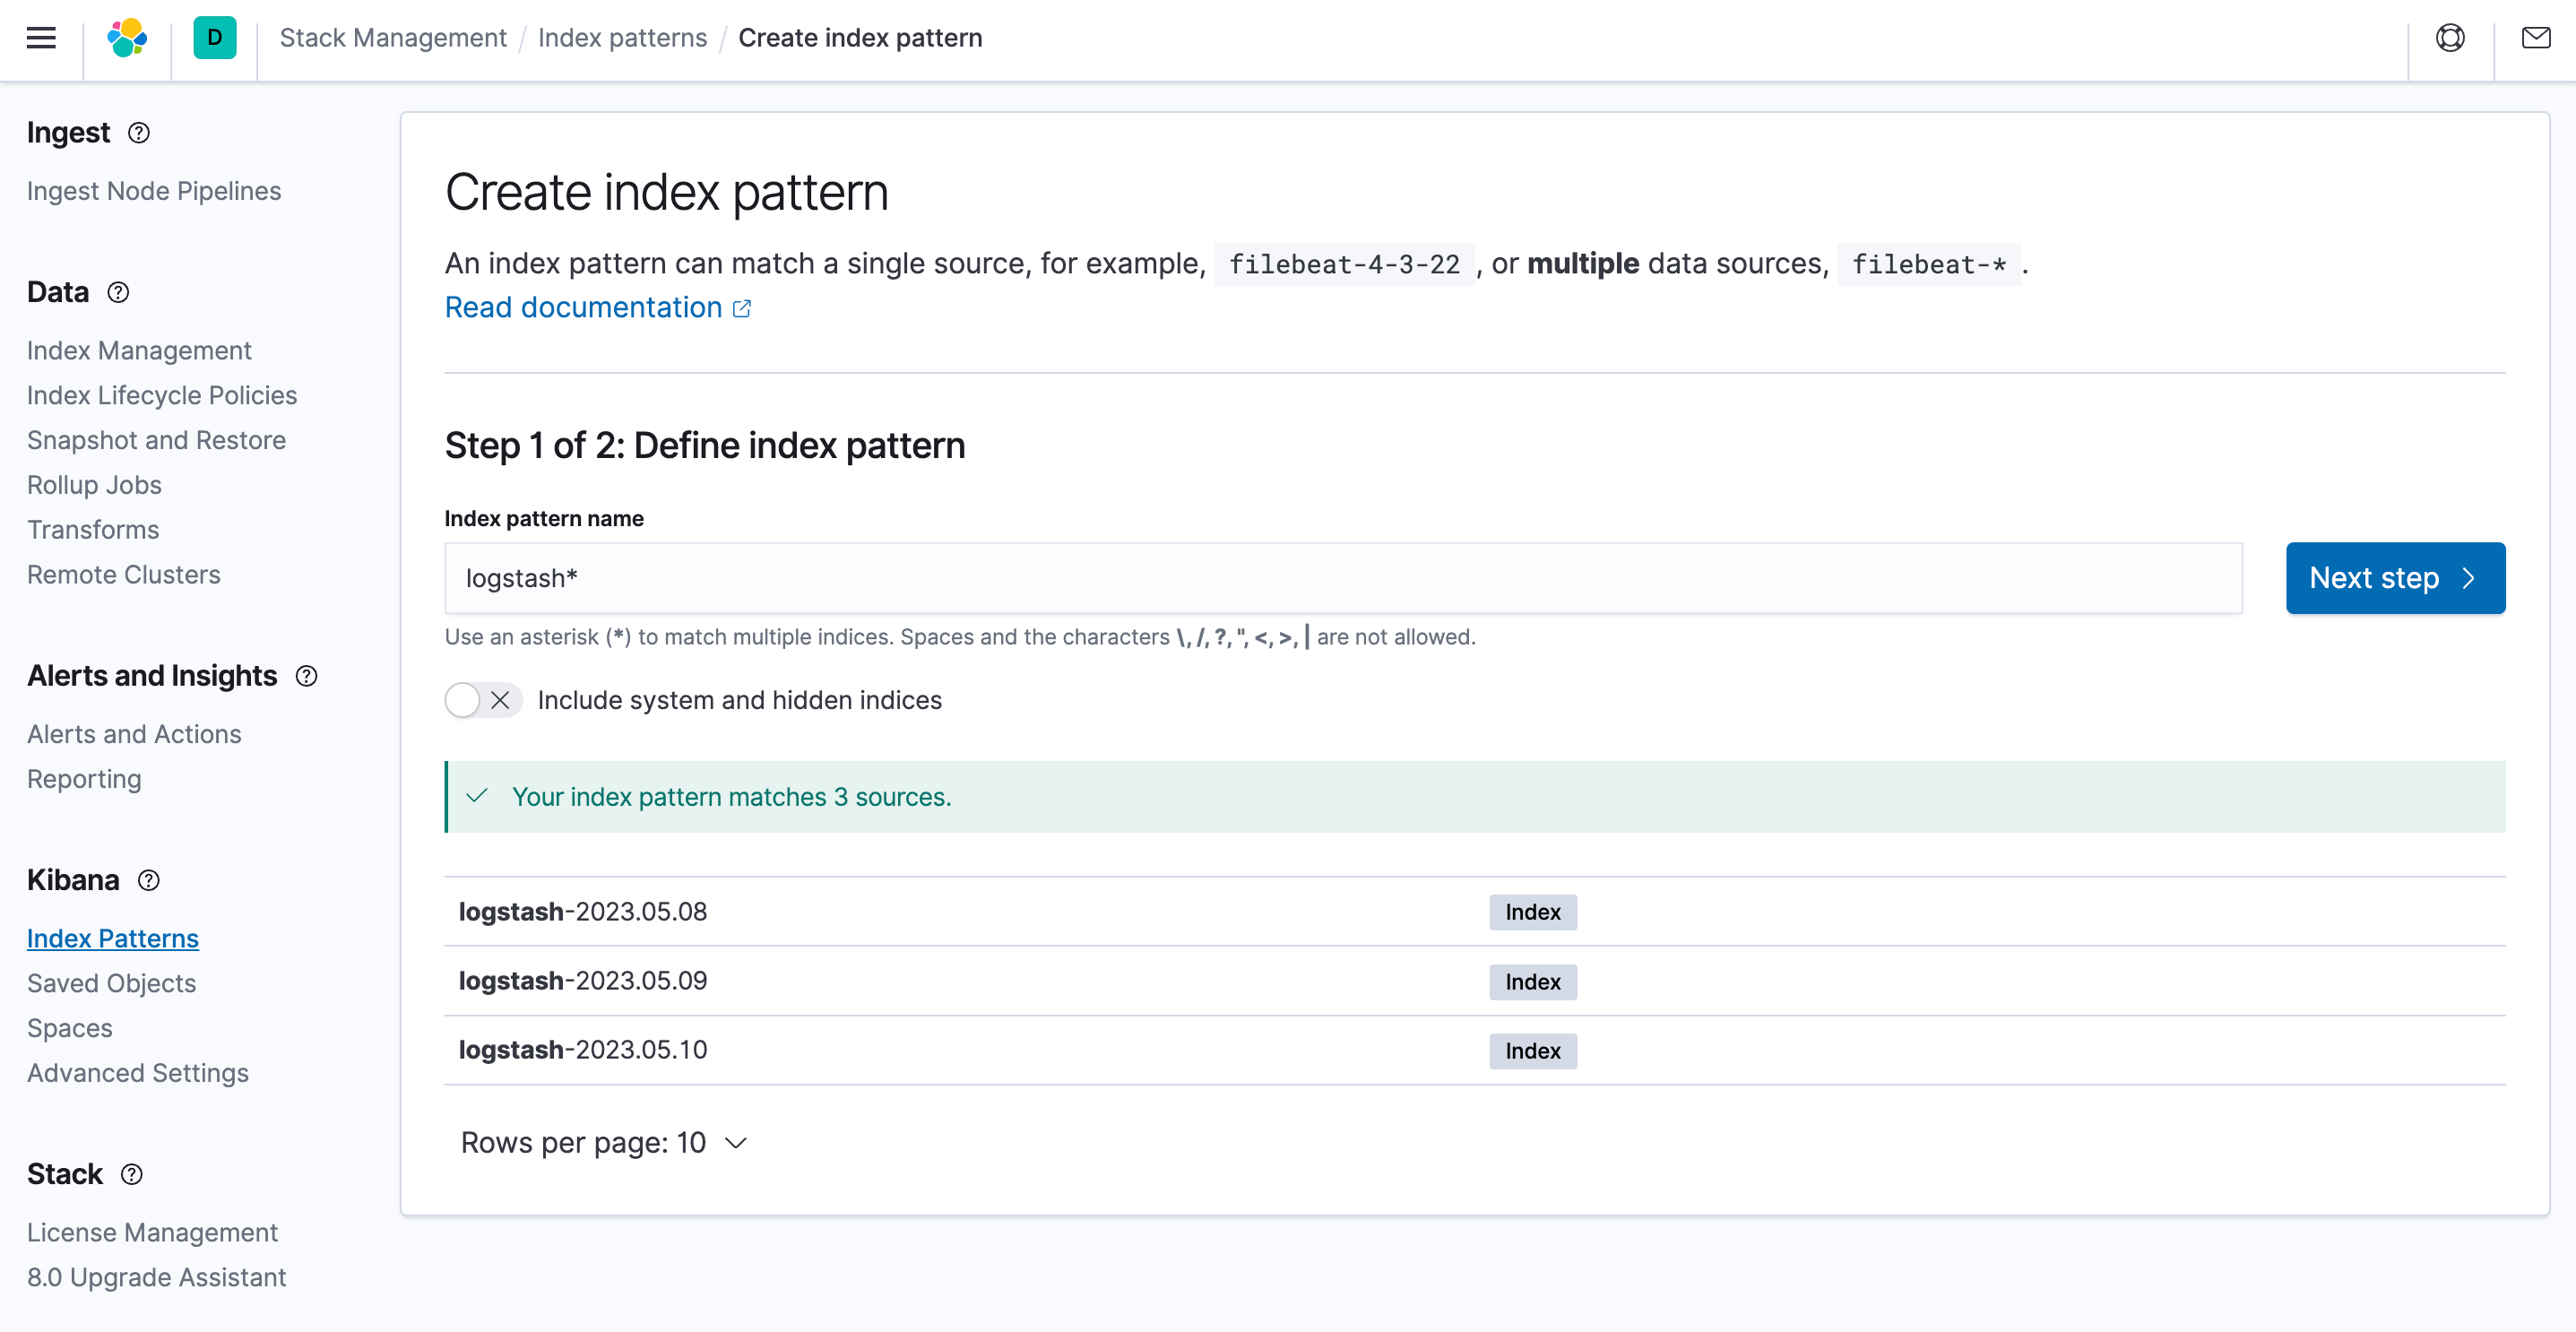
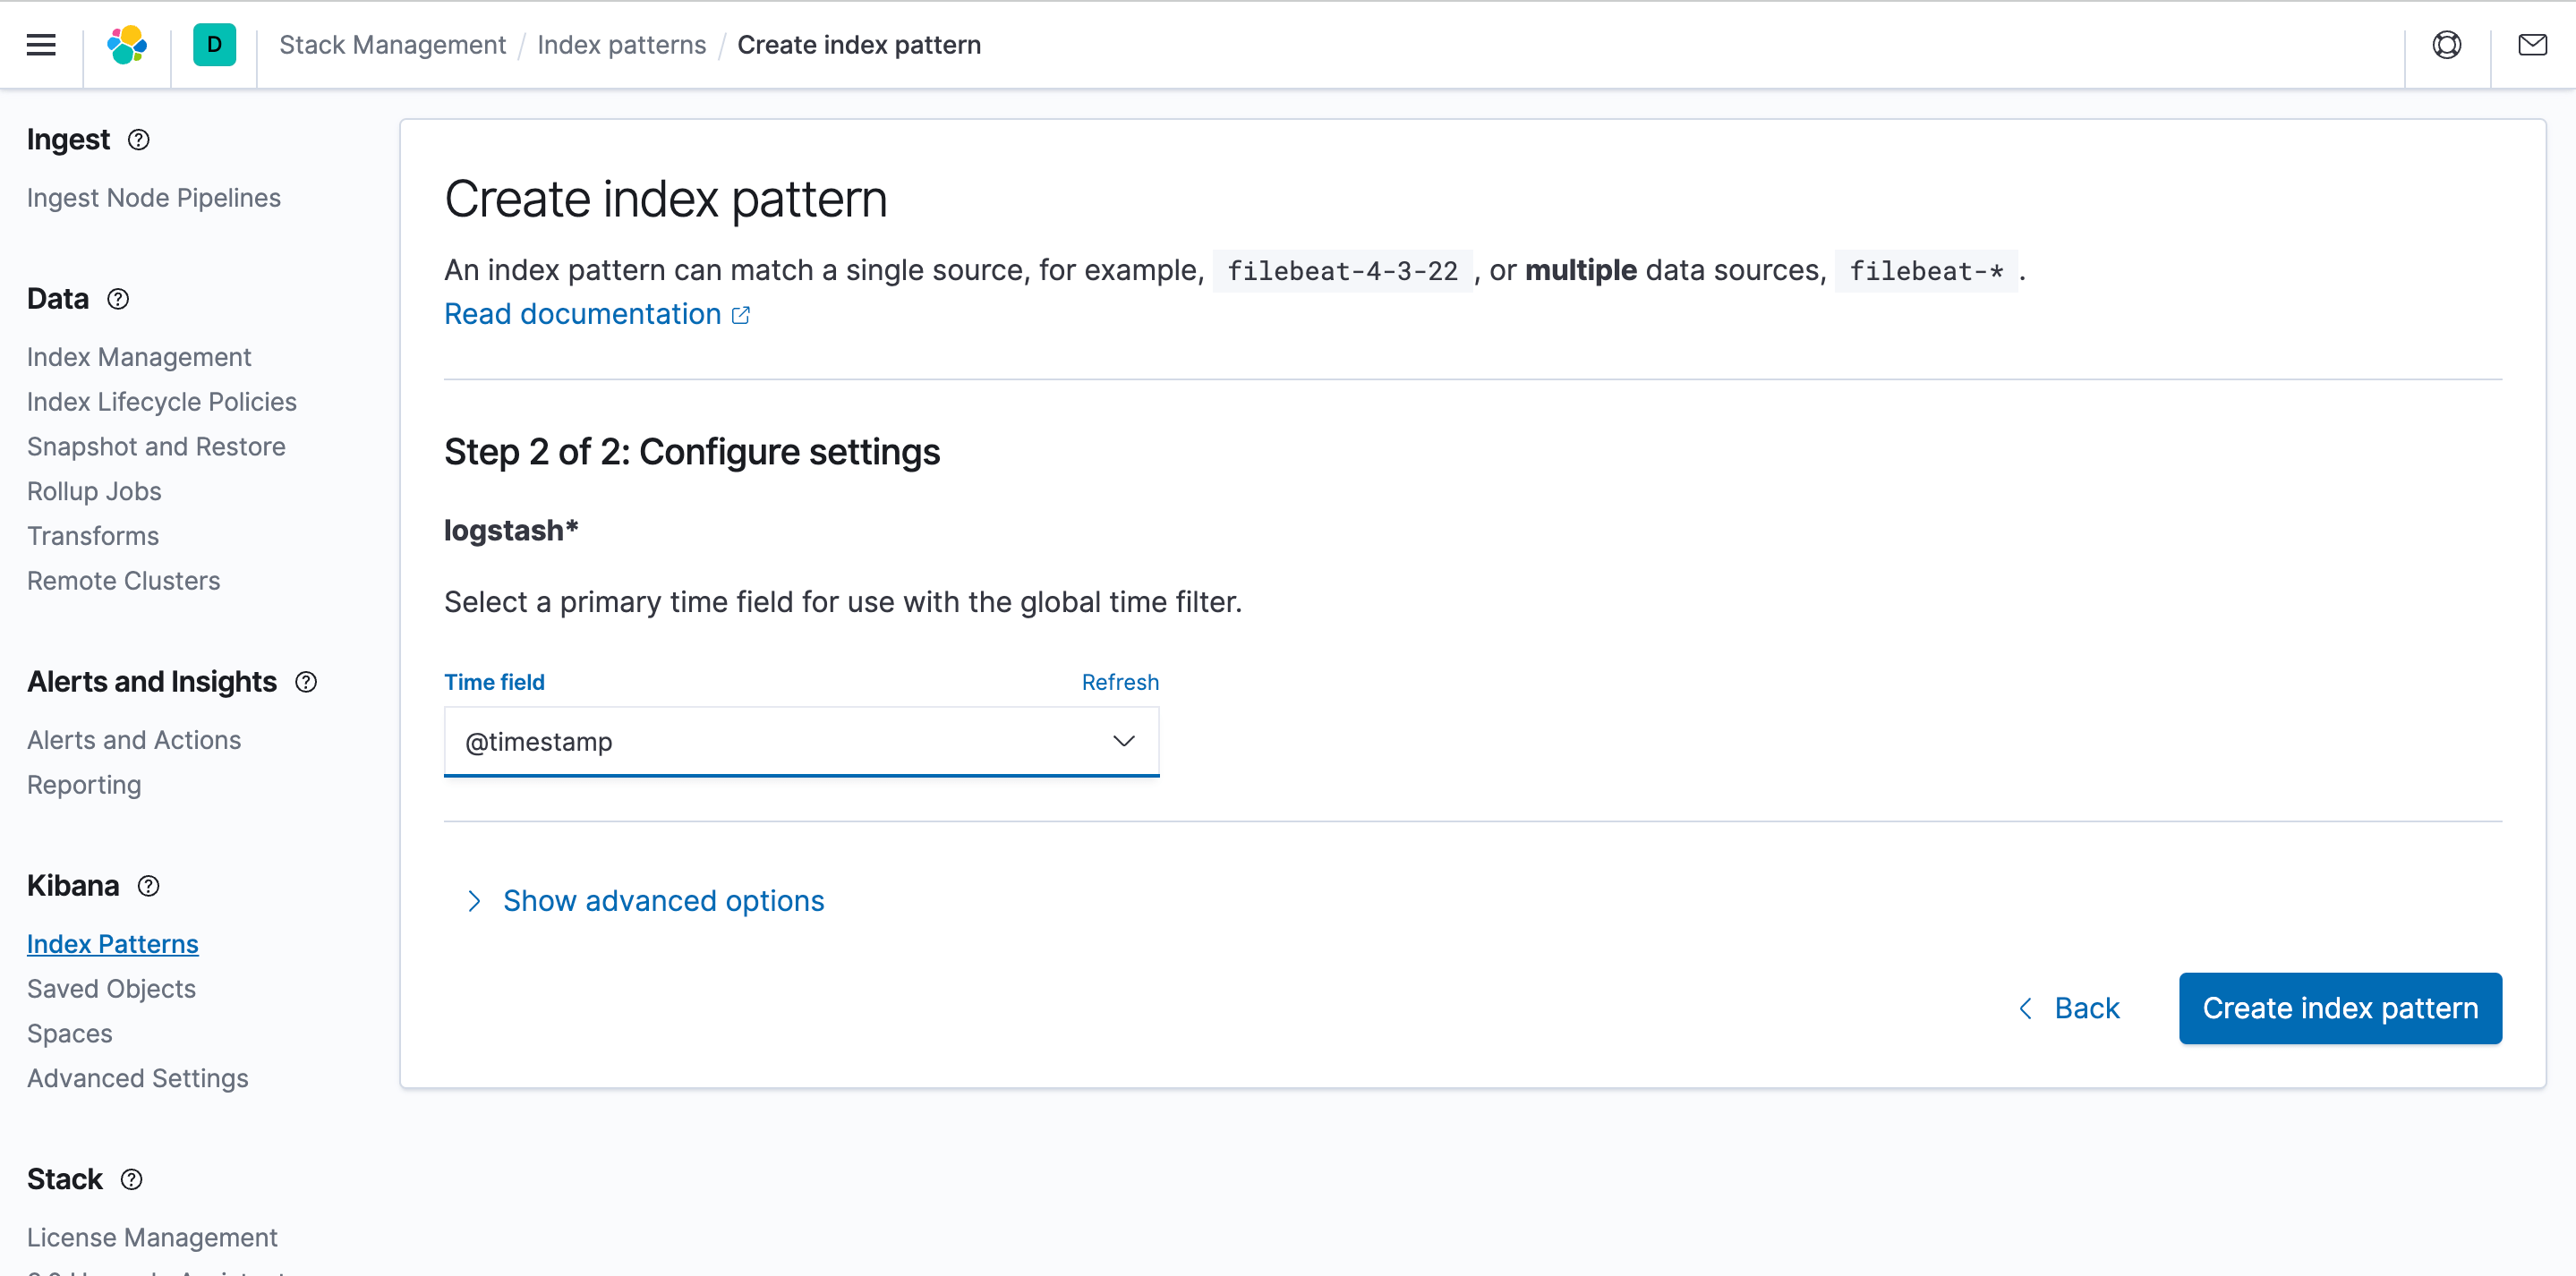
In order to be able to discover and view logs in Kibana, you need to set an index match, select index patterns, and click Create
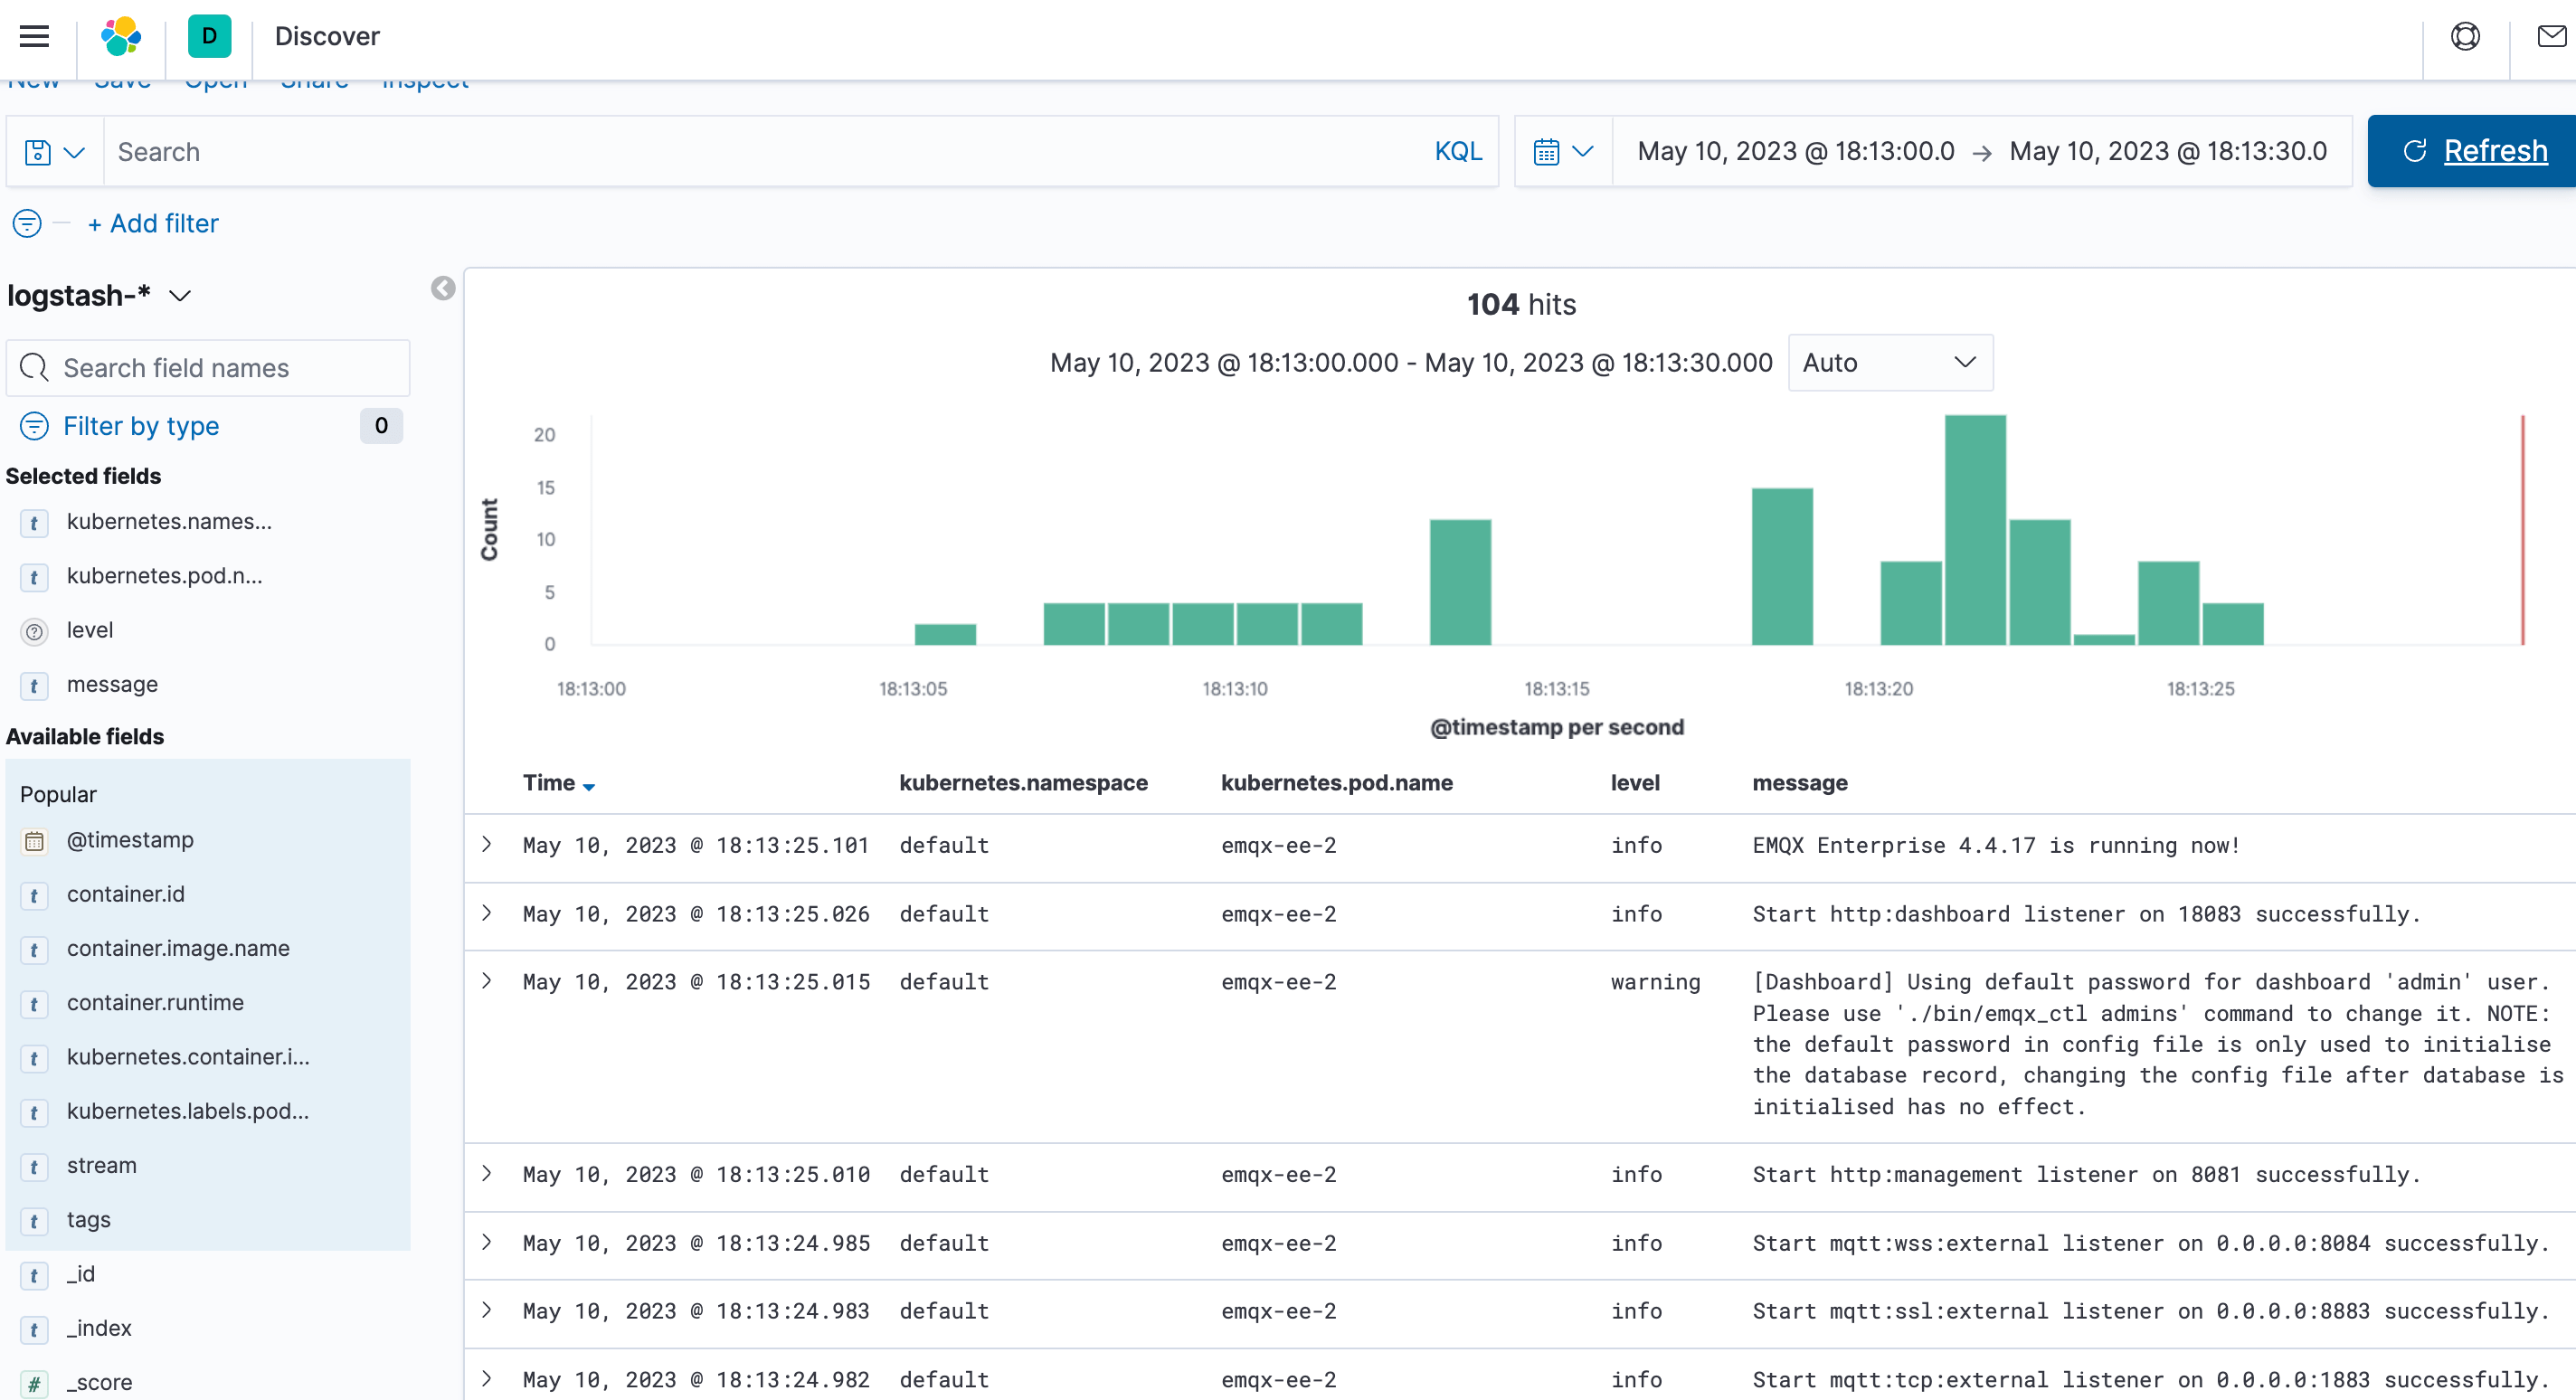
Finally verify whether the EMQX cluster logs are collected