Skip to content

Access EMQX Cluster Through LoadBalancer

Task Target

Access the EMQX cluster through the Service of LoadBalancer type.

Configure EMQX Cluster

The following is the relevant configuration of EMQX Custom Resource. You can choose the corresponding APIVersion according to the version of EMQX you want to deploy. For the specific compatibility relationship, please refer to EMQX Operator Compatibility:

apps.emqx.io/v2beta1 EMQX supports configuring EMQX cluster Dashboard Service through .spec.dashboardServiceTemplate, and configuring EMQX cluster listener Service through .spec.listenersServiceTemplate, its documentation can refer to Service.

  • Save the following content as a YAML file and deploy it via the kubectl apply command

    yaml
    apiVersion: apps.emqx.io/v2beta1
    kind: EMQX
    metadata:
      name: emqx
    spec:
      image: emqx:5
      listenersServiceTemplate:
        spec:
          type: LoadBalancer
      dashboardServiceTemplate:
        spec:
          type: LoadBalancer

    By default, EMQX will open an MQTT TCP listener tcp-default corresponding to port 1883 and Dashboard listener dashboard-listeners-http-bind corresponding to port 18083.

    Users can add new listeners through .spec.config.data field or EMQX Dashboard. EMQX Operator will automatically inject the default listener information into the Service when creating the Service, but when there is a conflict between the Service configured by the user and the listener configured by EMQX (name or port fields are repeated), EMQX Operator will use the user's configuration prevail.

  • Wait for the EMQX cluster to be ready, you can check the status of the EMQX cluster through kubectl get command, please make sure STATUS is Running, this may take some time

    bash
    $ kubectl get emqx emqx
    NAME   IMAGE      STATUS    AGE
    emqx   emqx:5.1   Running   10m
  • Obtain the Dashboard External IP of the EMQX cluster and access the EMQX console

    EMQX Operator will create two EMQX Service resources, one is emqx-dashboard and the other is emqx-listeners, corresponding to EMQX console and EMQX listening port respectively.

    bash
    $ kubectl get svc emqx-dashboard -o json | jq '.status.loadBalancer.ingress[0].ip'
    
    192.168.1.200

    Access http://192.168.1.200:18083 through a browser, and use the default username and password admin/public to log in to the EMQX console.

Connect To EMQX Cluster By MQTT X CLI

  • Obtain the External IP of the EMQX cluster

    bash
    external_ip=$(kubectl get svc emqx-listeners -o json | jq '.status.loadBalancer.ingress[0].ip')
  • Use MQTT X CLI to connect to the EMQX cluster

    bash
    $ mqttx conn -h ${external_ip} -p 1883
    
    [4/17/2023] [5:17:31 PM] › … Connecting...
    [4/17/2023] [5:17:31 PM] › ✔ Connected

Add New Listener Through EMQX Dashboard

TIP

The screenshots of the Dashboard below are from EMQX 5, EMQX 4 Dashboard also supports the corresponding function, please operate by yourself.

  • Add new Listener

    Open the browser to login the EMQX Dashboard and click Configuration → Listeners to enter the listener page, we first click the Add Listener button to add a name called test, port 1884 The listener, as shown in the following figure:

    Then click the Add button to create the listener, as shown in the following figure:

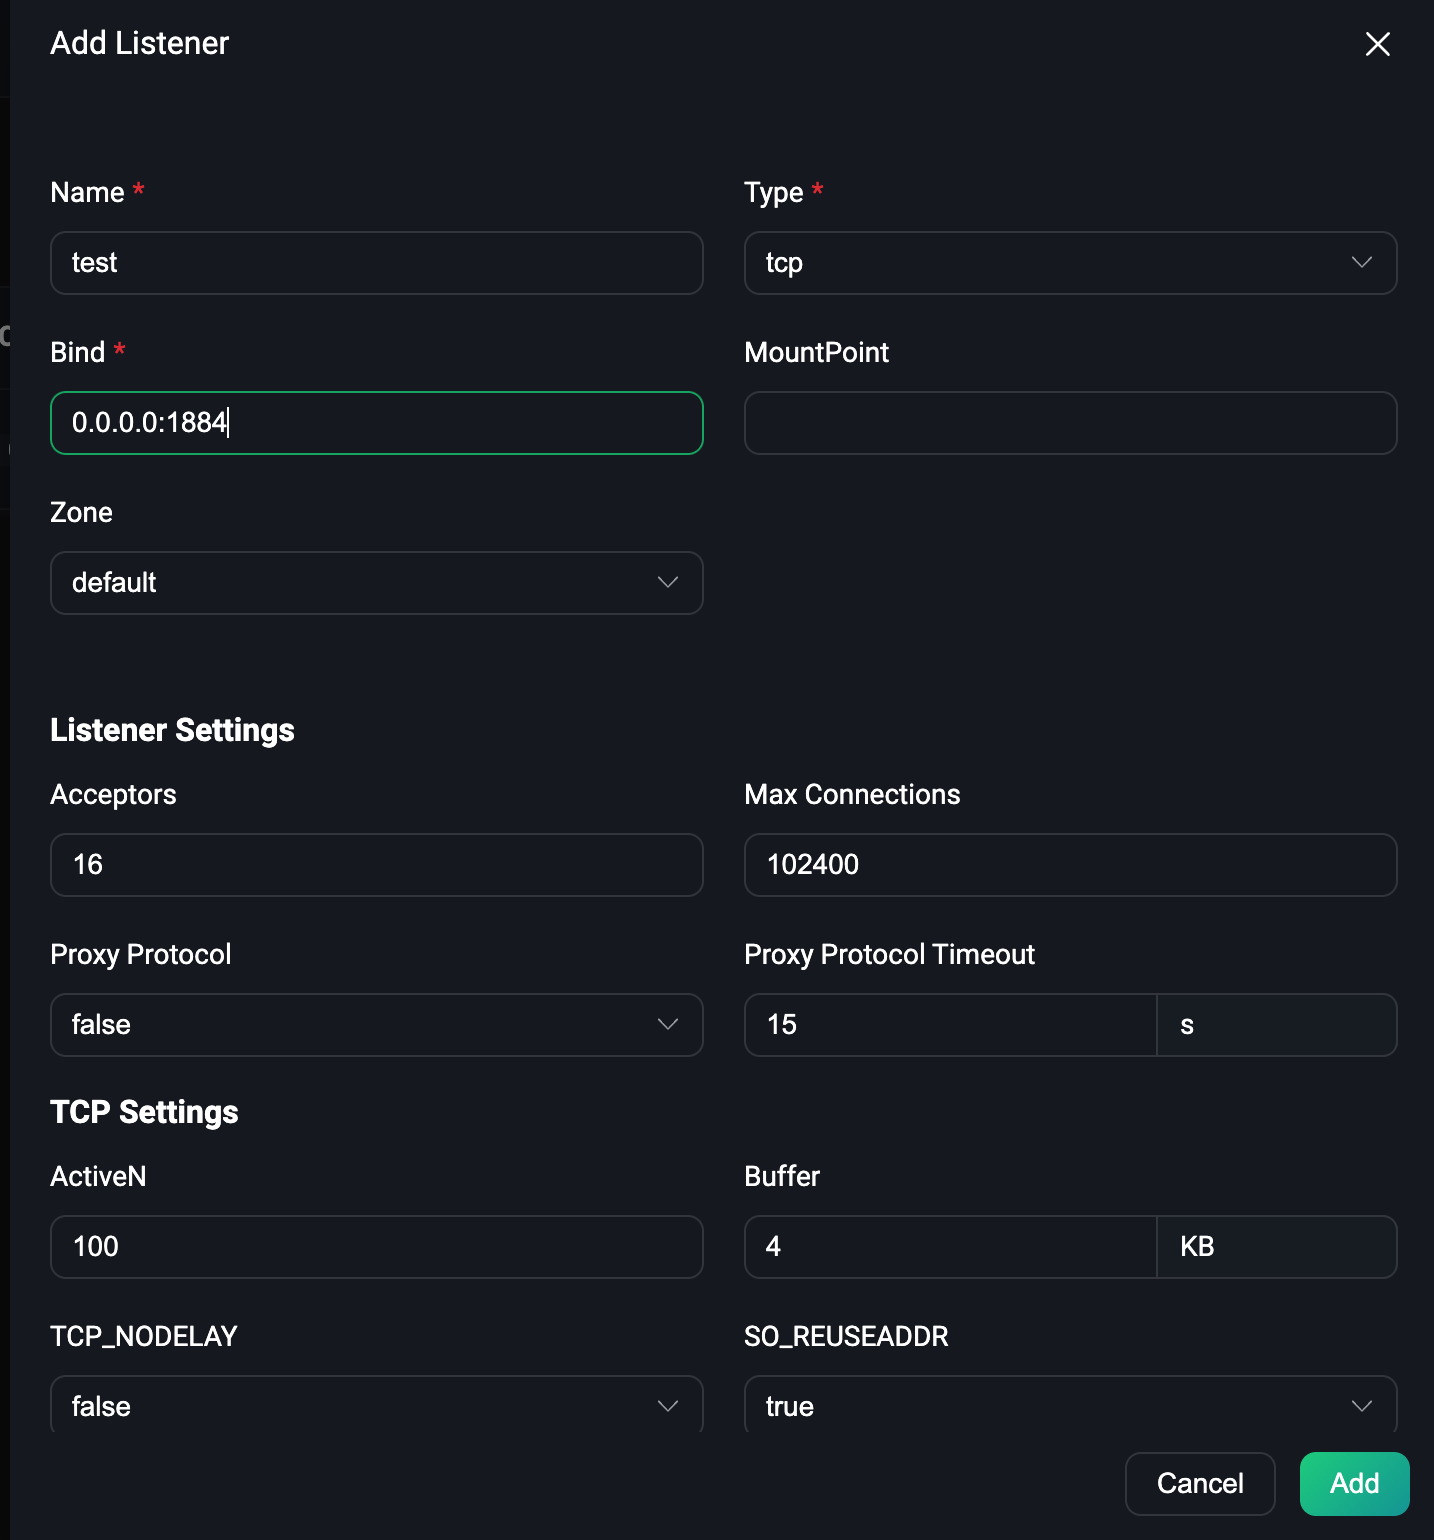
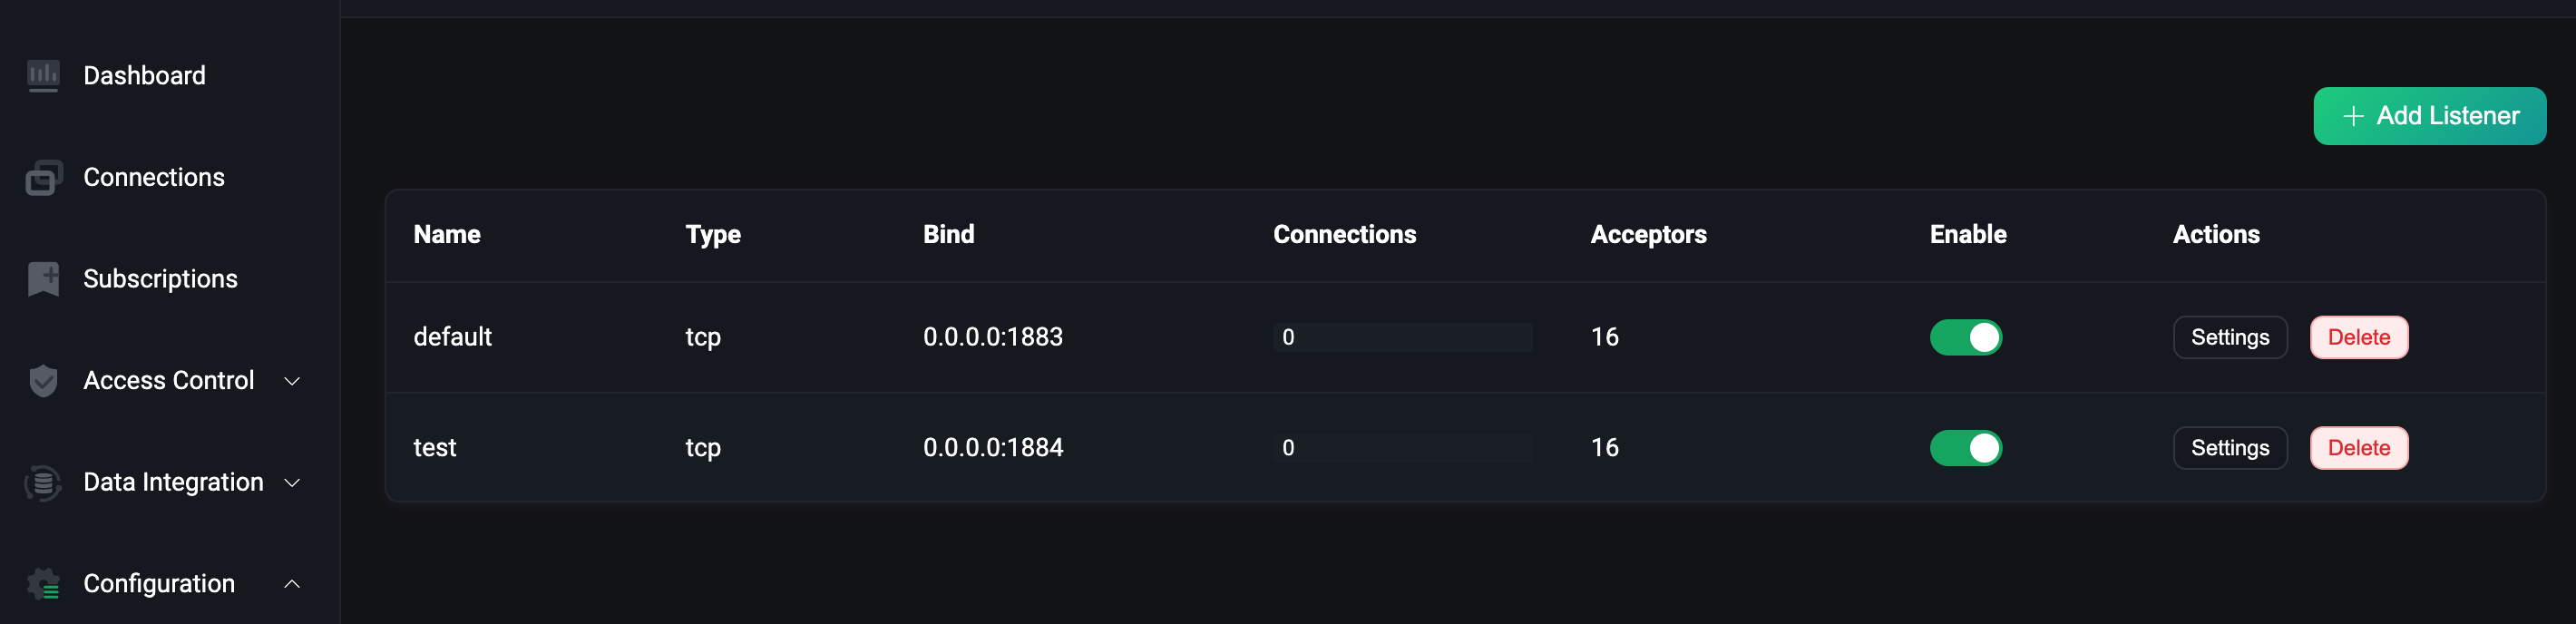
    As can be seen from the figure, the test listener we created has taken effect.

  • Check whether the newly added listener is injected into the Service

    bash
    kubectl get svc
    
    NAME             TYPE       CLUSTER-IP       EXTERNAL-IP   PORT(S)                                         AGE
    emqx-dashboard   NodePort   10.105.110.235   <none>        18083:32012/TCP                                 13m
    emqx-listeners   NodePort   10.106.1.58      <none>        1883:32010/TCP,1884:30763/TCP                   12m

    From the output results, we can see that the newly added listener 1884 has been injected into the emqx-listeners Service.