# Configure Prometheus to monitor EMQX cluster
# Task target
- How to monitor EMQX cluster through Prometheus.
# Deploy Prometheus
Prometheus deployment documentation can refer to: Prometheus (opens new window)
# Deploy EMQX cluster
EMQX supports exposing indicators through the http interface. For all statistical indicators under the cluster, please refer to the document: HTTP API (opens new window)
apiVersion: apps.emqx.io/v2alpha1
kind: EMQX
metadata:
name: emqx
spec:
image: emqx/emqx:5.0.14
imagePullPolicy: IfNotPresent
coreTemplate:
spec:
replicas: 3
ports:
- name: http-dashboard
containerPort: 18083
replicantTemplate:
spec:
replicas: 1
ports:
- name: http-dashboard
containerPort: 18083
2
3
4
5
6
7
8
9
10
11
12
13
14
15
16
17
18
19
EMQX supports exposing indicators through the http interface. For all statistical indicators under the cluster, you can refer to the document: HTTP API (opens new window)
apiVersion: apps.emqx.io/v1beta4
kind: EmqxEnterprise
metadata:
name: emqx-ee
spec:
replicas: 3
template:
spec:
emqxContainer:
image:
repository: emqx/emqx-ee
version: 4.4.14
ports:
- name: http-management
containerPort: 8081
2
3
4
5
6
7
8
9
10
11
12
13
14
15
EMQX supports exposing indicators through the http interface. For all statistical indicators under the cluster, you can refer to the document: HTTP API (opens new window)
apiVersion: apps.emqx.io/v1beta3
kind: EmqxEnterprise
metadata:
name: emqx-ee
spec:
replicas: 3
emqxTemplate:
image: emqx/emqx-ee:4.4.14
2
3
4
5
6
7
8
Save the above content as: emqx.yaml and deploy the EMQX cluster
The output is similar to:
emqx.apps.emqx.io/emqx created
- Check whether the EMQX cluster is ready
kubectl get emqx emqx -o json | jq ".status.emqxNodes"
The output is similar to:
[
{
"node": "emqx@10.244.2.13",
"node_status": "running",
"otp_release": "24.3.4.2-1/12.3.2.2",
"role": "replicant",
"version": "5.0.12"
},
{
"node": "emqx@emqx-core-0.emqx-headless.default.svc.cluster.local",
"node_status": "running",
"otp_release": "24.3.4.2-1/12.3.2.2",
"role": "core",
"version": "5.0.12"
},
{
"node": "emqx@emqx-core-1.emqx-headless.default.svc.cluster.local",
"node_status": "running",
"otp_release": "24.3.4.2-1/12.3.2.2",
"role": "core",
"version": "5.0.12"
},
{
"node": "emqx@emqx-core-2.emqx-headless.default.svc.cluster.local",
"node_status": "running",
"otp_release": "24.3.4.2-1/12.3.2.2",
"role": "core",
"version": "5.0.12"
}
]
2
3
4
5
6
7
8
9
10
11
12
13
14
15
16
17
18
19
20
21
22
23
24
25
26
27
28
29
30
NOTE: node represents the unique identifier of the EMQX node in the cluster. node_status indicates the status of EMQX nodes. otp_release indicates the version of Erlang used by EMQX. role represents the EMQX node role type. version indicates the EMQX version. EMQX Operator creates an EMQX cluster with three core nodes and three replicant nodes by default, so when the cluster is running normally, you can see information about three running core nodes and three replicant nodes. If you configure the .spec.coreTemplate.spec.replicas
field, when the cluster is running normally, the number of running core nodes displayed in the output should be equal to the value of this replicas. If you configure the .spec.replicantTemplate.spec.replicas
field, when the cluster is running normally, the number of running replicant nodes displayed in the output should be equal to the replicas value.
kubectl get emqxenterprise emqx-ee -o json | jq ".status.emqxNodes"
The output is similar to:
[
{
"node": "emqx-ee@emqx-ee-0.emqx-ee-headless.default.svc.cluster.local",
"node_status": "Running",
"otp_release": "24.3.4.2/12.3.2.2",
"version": "4.4.14"
},
{
"node": "emqx-ee@emqx-ee-1.emqx-ee-headless.default.svc.cluster.local",
"node_status": "Running",
"otp_release": "24.3.4.2/12.3.2.2",
"version": "4.4.14"
},
{
"node": "emqx-ee@emqx-ee-2.emqx-ee-headless.default.svc.cluster.local",
"node_status": "Running",
"otp_release": "24.3.4.2/12.3.2.2",
"version": "4.4.14"
}
]
2
3
4
5
6
7
8
9
10
11
12
13
14
15
16
17
18
19
20
NOTE: node represents the unique identifier of the EMQX node in the cluster. node_status indicates the status of EMQX nodes. otp_release indicates the version of Erlang used by EMQX. version indicates the EMQX version. EMQX Operator will pull up the EMQX cluster with three nodes by default, so when the cluster is running normally, you can see the information of the three running nodes. If you configure the .spec.replicas
field, when the cluster is running normally, the number of running nodes displayed in the output should be equal to the value of replicas.
# Configure Prometheus Monitor
A PodMonitor Custom Resource Definition (CRD) allows to declaratively define how a dynamic set of services should be monitored. Use label selection to define which services are selected to monitor with the desired configuration, and its documentation can be referred to: PodMonitor (opens new window)
apiVersion: monitoring.coreos.com/v1
kind: PodMonitor
metadata:
name: emqx
namespace: default
labels:
app.kubernetes.io/name: emqx
spec:
jobLabel: emqx-scraping
namespaceSelector:
matchNames:
- default
podMetricsEndpoints:
- basicAuth:
password:
key: password
name: emqx-basic-auth
username:
key: username
name: emqx-basic-auth
interval: 10s
params:
type:
-prometheus
path: /api/v5/prometheus/stats
port: http-dashboard
scheme: http
selector:
matchLabels:
apps.emqx.io/instance: emqx
2
3
4
5
6
7
8
9
10
11
12
13
14
15
16
17
18
19
20
21
22
23
24
25
26
27
28
29
30
NOTE: path
indicates the path of the indicator collection interface. In EMQX 5, the path is: /api/v5/prometheus/stats
. selector.matchLabels
indicates the label of the matching Pod: apps.emqx.io/instance: emqx
.
A PodMonitor Custom Resource Definition (CRD) allows to declaratively define how a dynamic set of services should be monitored. Use label selection to define which services are selected to monitor with the desired configuration, and its documentation can refer to: PodMonitor (opens new window)
apiVersion: monitoring.coreos.com/v1
kind: PodMonitor
metadata:
name: emqx
namespace: default
labels:
app.kubernetes.io/name: emqx
spec:
jobLabel: emqx-scraping
namespaceSelector:
matchNames:
- default
podMetricsEndpoints:
- basicAuth:
password:
key: password
name: emqx-basic-auth
username:
key: username
name: emqx-basic-auth
interval: 10s
params:
type:
-prometheus
path: /api/v4/emqx_prometheus
port: http-management
scheme: http
selector:
matchLabels:
apps.emqx.io/instance: emqx-ee
2
3
4
5
6
7
8
9
10
11
12
13
14
15
16
17
18
19
20
21
22
23
24
25
26
27
28
29
30
NOTE: path
indicates the path of the indicator collection interface. In EMQX 4, the path is: /api/v4/emqx_prometheus
. selector.matchLabels
indicates the label of the matching Pod: apps.emqx.io/instance: emqx-ee
.
A ServiceMonitor Custom Resource Definition (CRD) allows to declaratively define how a dynamic set of services should be monitored. Use label selection to define which services are selected to monitor with the desired configuration, and its documentation can be referred to: ServiceMonitor (opens new window)
apiVersion: monitoring.coreos.com/v1
kind: ServiceMonitor
metadata:
name: emqx
namespace: default
labels:
app.kubernetes.io/name: emqx
spec:
jobLabel: emqx-scraping
namespaceSelector:
matchNames:
- default
ServiceMetricsEndpoints:
- basicAuth:
password:
key: password
name: emqx-basic-auth
username:
key: username
name: emqx-basic-auth
interval: 10s
params:
type:
-prometheus
path: /api/v4/emqx_prometheus
port: http-management-8081
scheme: http
selector:
matchLabels:
apps.emqx.io/instance: emqx-ee
2
3
4
5
6
7
8
9
10
11
12
13
14
15
16
17
18
19
20
21
22
23
24
25
26
27
28
29
30
NOTE: path
indicates the path of the indicator collection interface. In EMQX 4, the path is: /api/v4/emqx_prometheus
. selector.matchLabels
means matching the label of Service: apps.emqx.io/instance: emqx-ee
.
Save the above content as: monitor.yaml and execute the following command:
kubectl apply -f monitor.yaml
Use basicAuth to provide Monitor with password and account information for accessing EMQX interface
apiVersion: v1
kind: Secret
metadata:
name: emqx-basic-auth
namespace: default
type: kubernetes.io/basic-auth
stringData:
username: admin
password: public
2
3
4
5
6
7
8
9
Save the above content as: secret.yaml and create Secret
kubectl apply -f secret.yaml
# Visit Prometheus to view the indicators of EMQX cluster
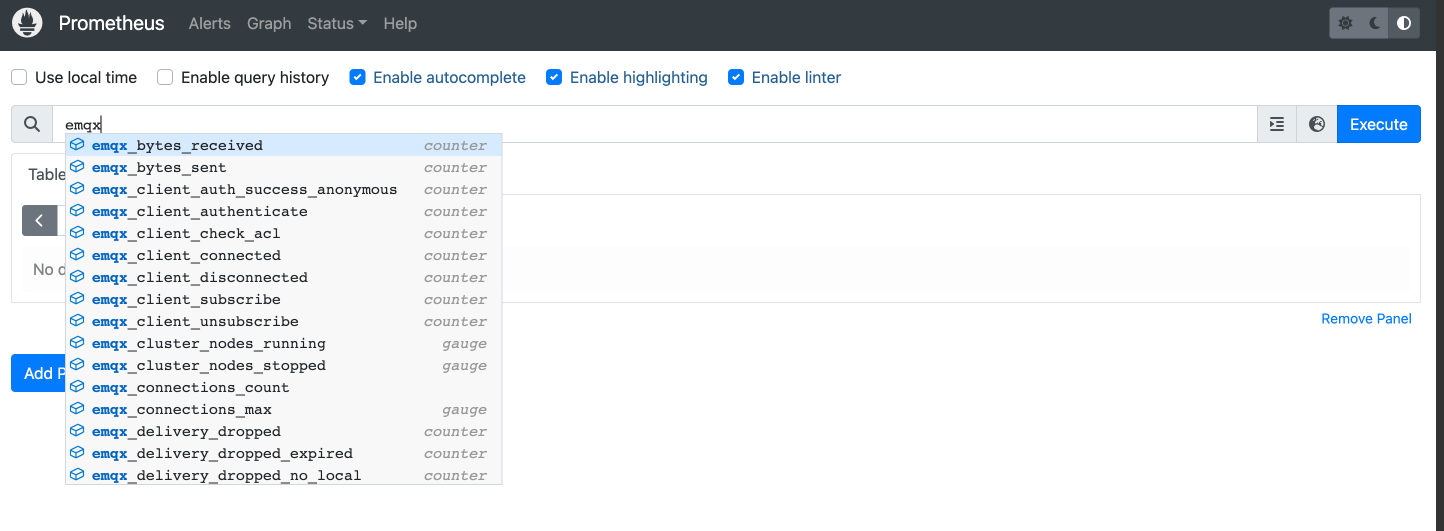
Open the Prometheus interface, switch to the Graph page, and enter emqx to display as shown in the following figure:
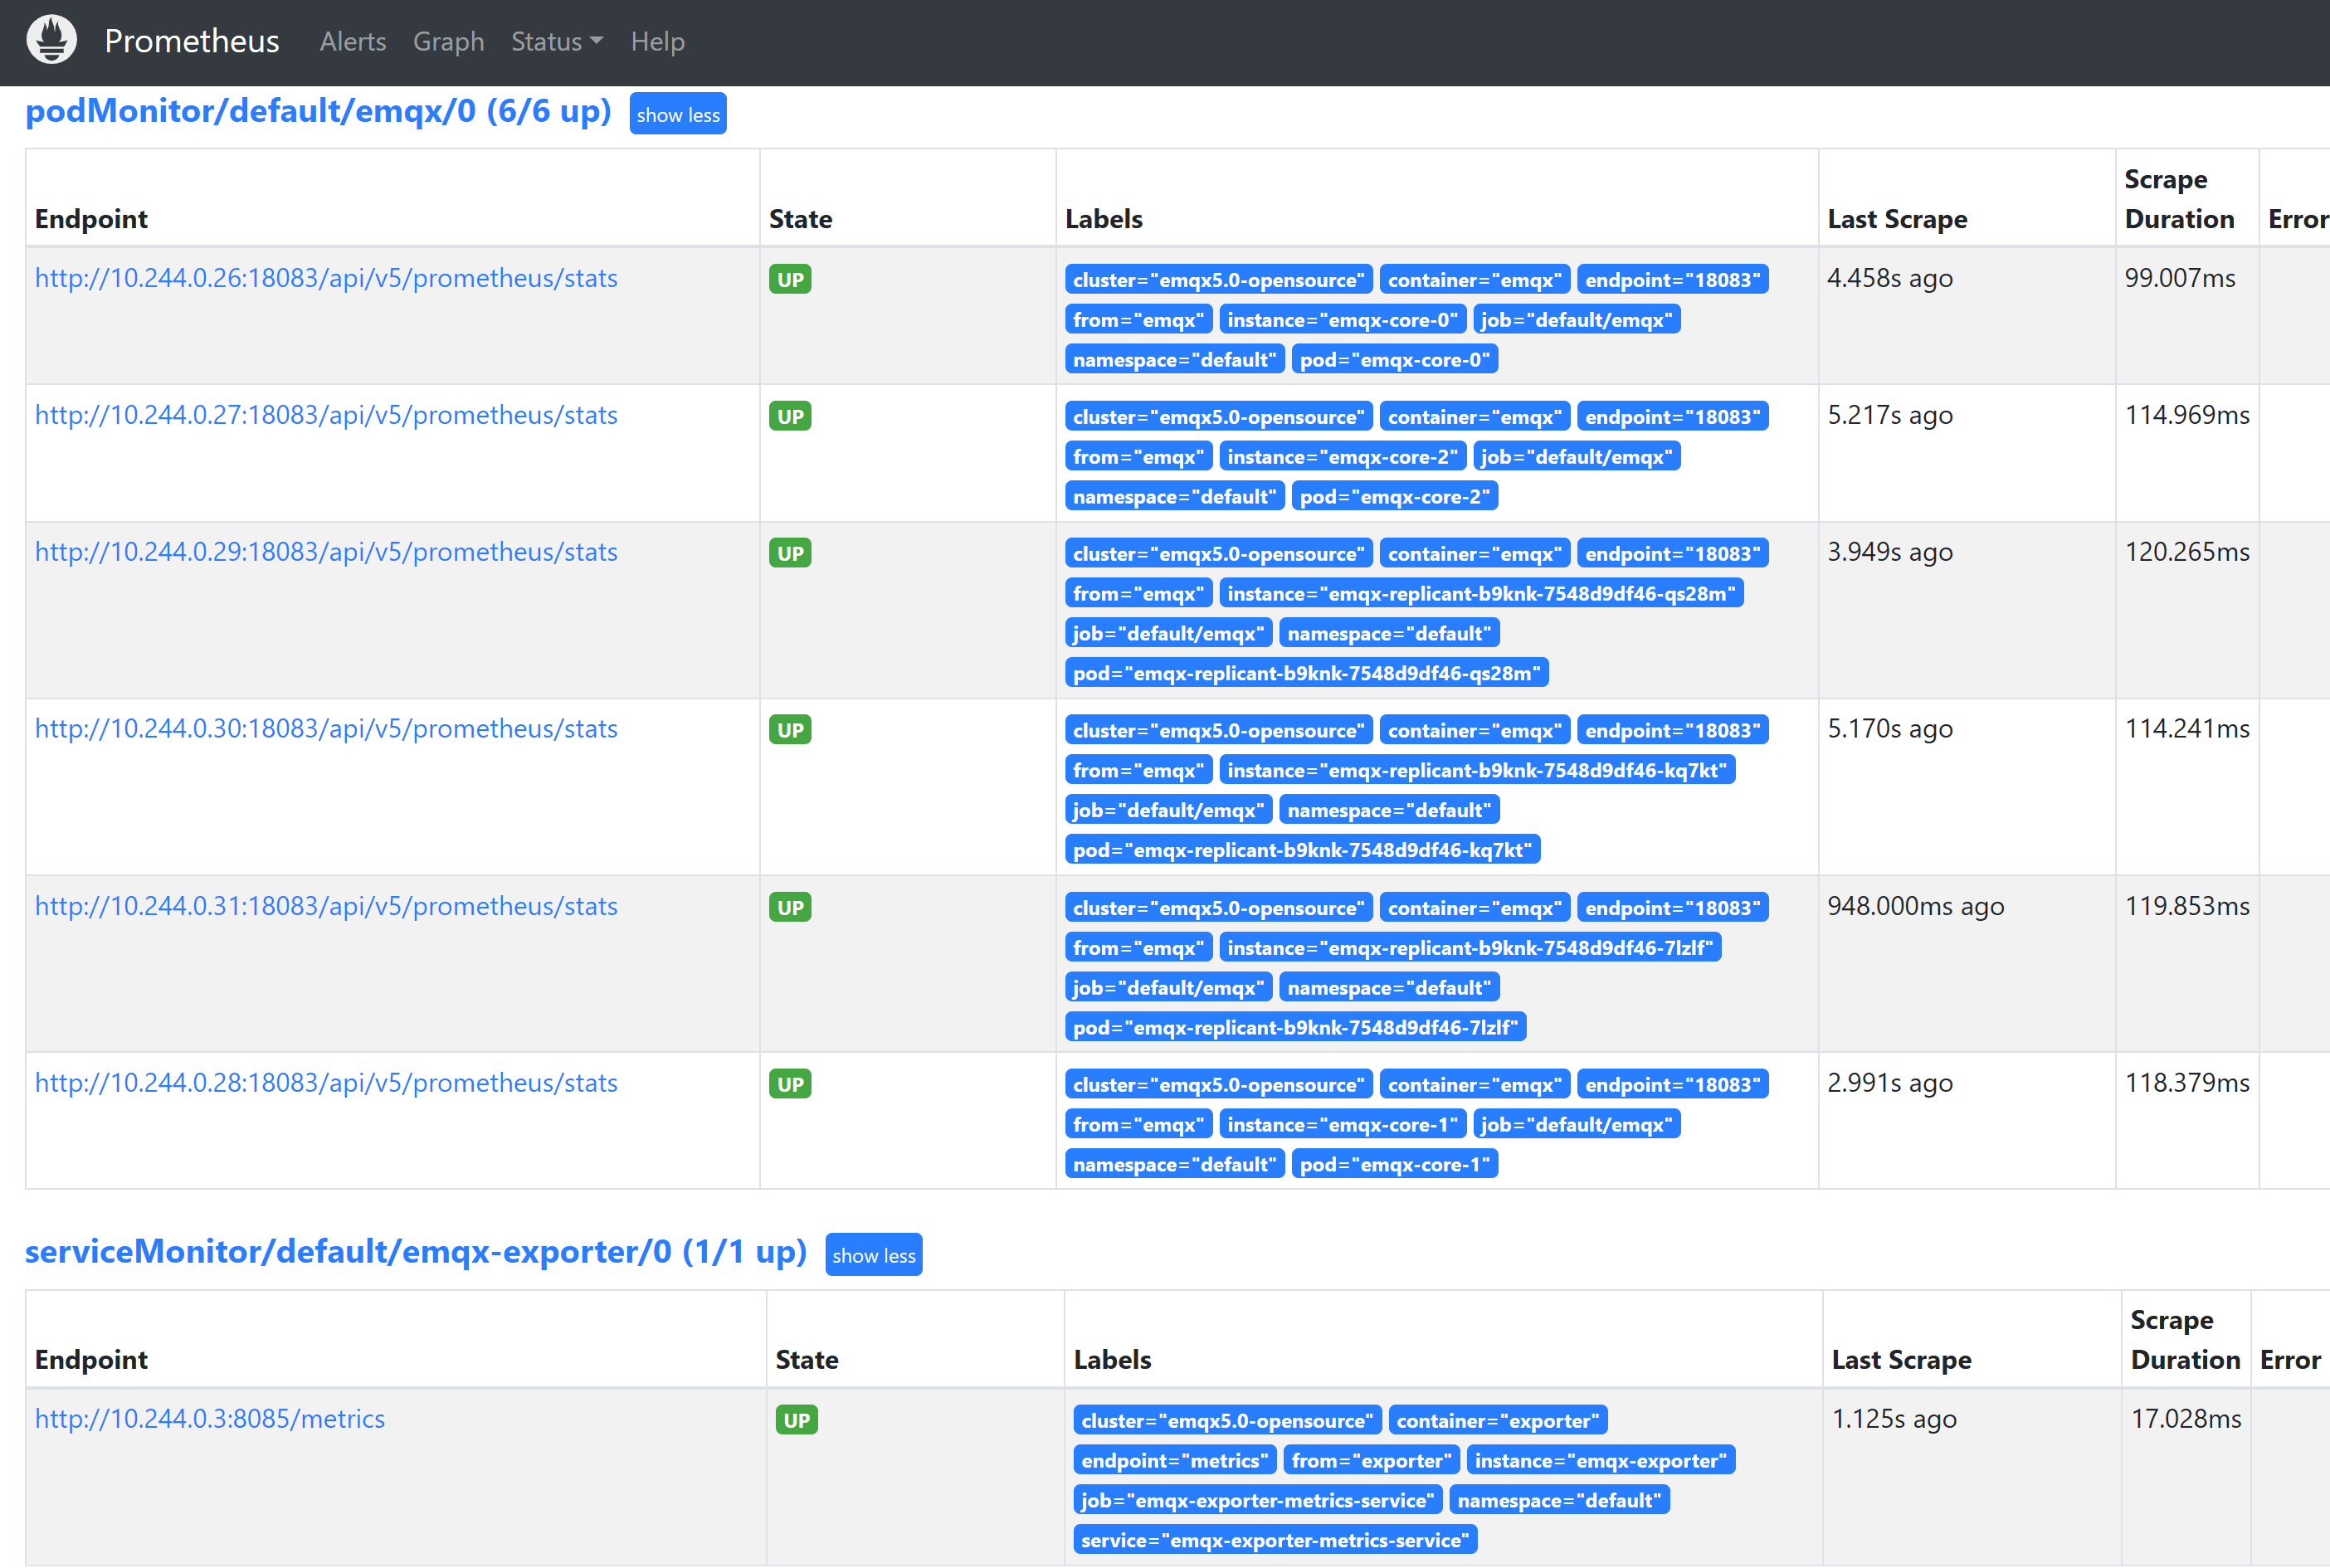
Switch to the Status → Targets page, the following figure is displayed, and you can see all monitored EMQX Pod information in the cluster:
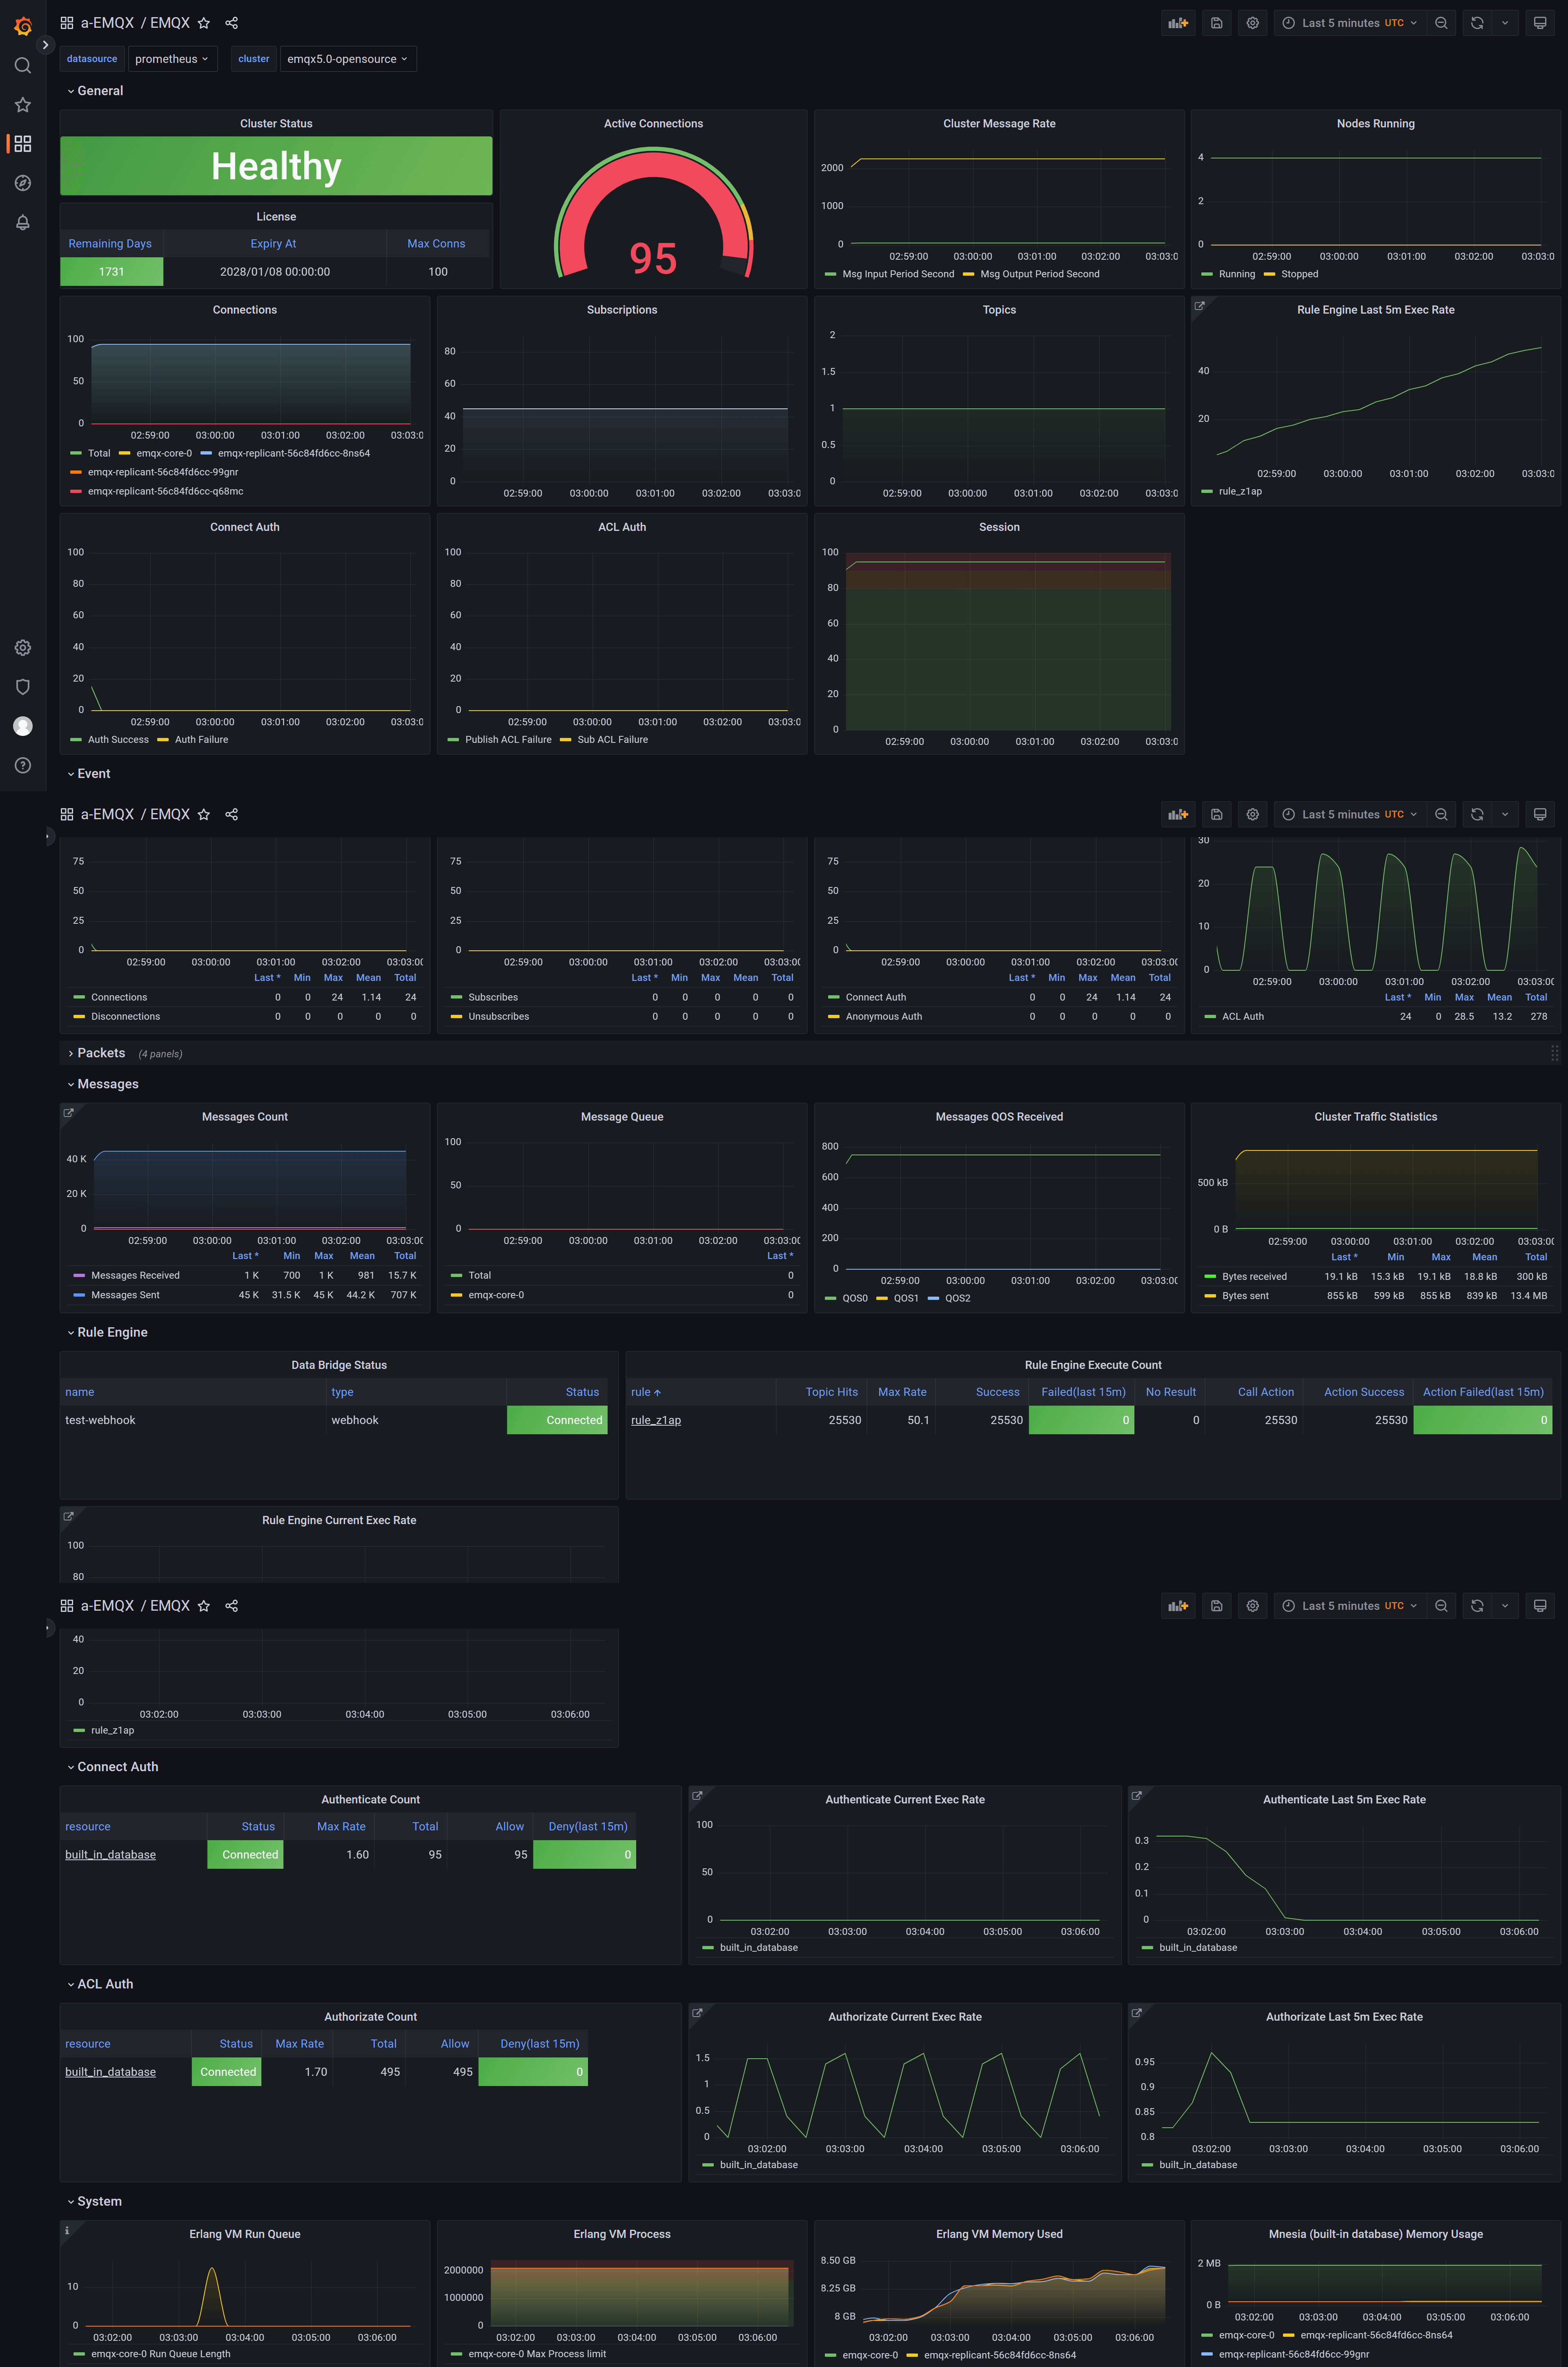