MQTT Data Bridge
MQTT Data Bridge is a core capability of EMQX Edge that enables MQTT messages to be forwarded between an edge deployment and an upstream MQTT broker. It provides a flexible and reliable way to connect edge-side device traffic to the cloud while decoupling device connectivity from upstream network conditions.
With the MQTT Data Bridge, devices connect to EMQX Edge using standard MQTT protocols, while EMQX Edge handles message forwarding, subscription, and transport selection toward the upstream broker.
What Is an MQTT Data Bridge in EMQX Edge
In EMQX Edge, an MQTT Data Bridge acts as an MQTT client running inside the broker. It establishes a connection to an upstream MQTT broker and performs the following functions:
- Forwards selected local topics from the edge to the upstream broker
- Subscribes to upstream topics and republishes them locally
- Preserves MQTT semantics such as QoS levels, retain flags, and topic mappings
From the perspective of devices, the bridge is transparent. Devices continue to communicate only with EMQX Edge, while EMQX Edge manages the cloud–edge data exchange.
Supported Bridge Transports
EMQX Edge supports multiple transport protocols for the MQTT Data Bridge, allowing users to choose the most suitable option based on network conditions and deployment requirements.
MQTT over TCP Bridge
MQTT over TCP Bridge uses traditional TCP or TLS/TCP as the transport layer for the MQTT connection between EMQX Edge and the upstream broker.
This bridge type is widely supported and easy to deploy, making it suitable for most stable network environments.
Learn more: MQTT over TCP Bridge
MQTT over QUIC Bridge
MQTT over QUIC Bridge uses QUIC as the transport layer for the edge-to-cloud MQTT connection. QUIC runs over UDP and is designed to provide faster connection establishment and improved behavior in weak or high-latency networks.
This bridge type is well-suited for mobile networks, cross-region deployments, or environments with packet loss and frequent reconnections.
Learn more: MQTT over QUIC Bridge
When to Use MQTT Data Bridge
MQTT Data Bridge is commonly used in scenarios such as:
- Aggregating device data at the edge and forwarding it to the cloud
- Improving cloud–edge connectivity without modifying device firmware
- Adapting to unstable, high-latency, or lossy network environments
- Gradually introducing new transport technologies while preserving reliability
Use MQTT over TCP Bridge in Dashboard
The EMQX Edge Dashboard provides a user-friendly web interface to configure and manage bridges without editing the configuration file.
View Bridge Status and Metrics
You can monitor bridge performance from two places in the EMQX Edge Dashboard:
Monitor Page
Navigate to Monitor > Overview to see basic bridge metrics in the Bridges section.
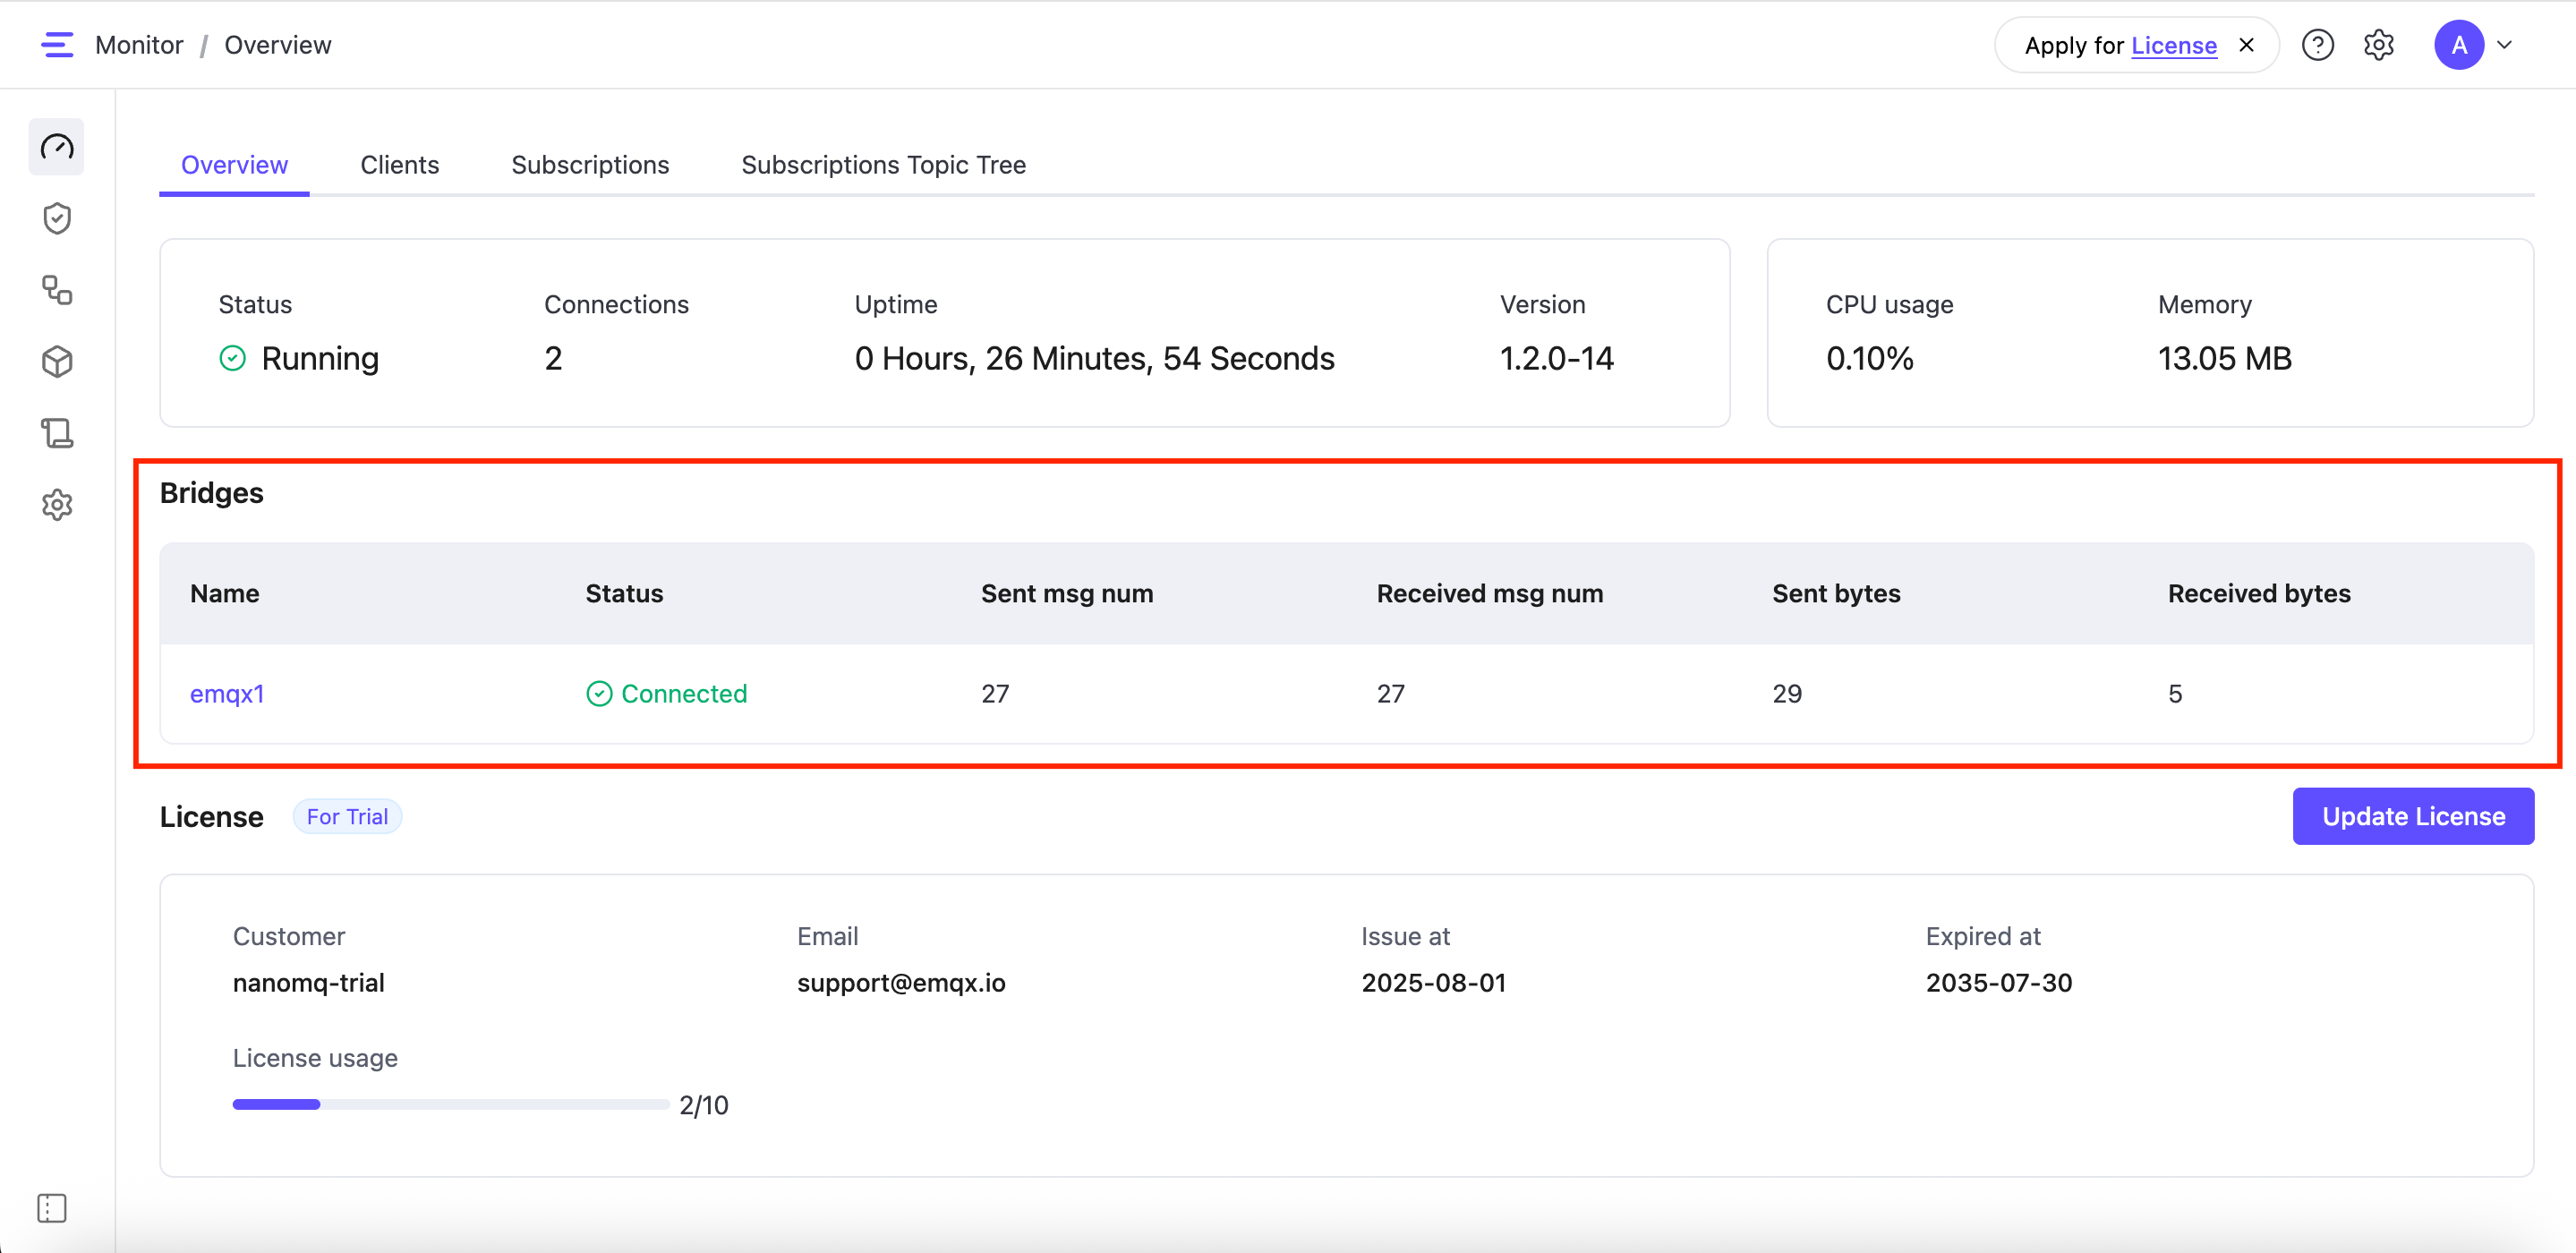
Here you'll find a summary for each bridge, including:
- Name: Custom name of the bridge
- Sent Messages Number: Messages sent to the remote broker
- Received Messages Number: Messages received from the remote broker
- Sent Bytes: Total data sent
- Received Bytes: Total data received
This is useful for quickly verifying that message traffic is flowing.
Bridges Page
Navigate to Bridges to view all configured MQTT bridges. The bridge list displays each bridge in a table format, giving you a detailed view of its status and performance.
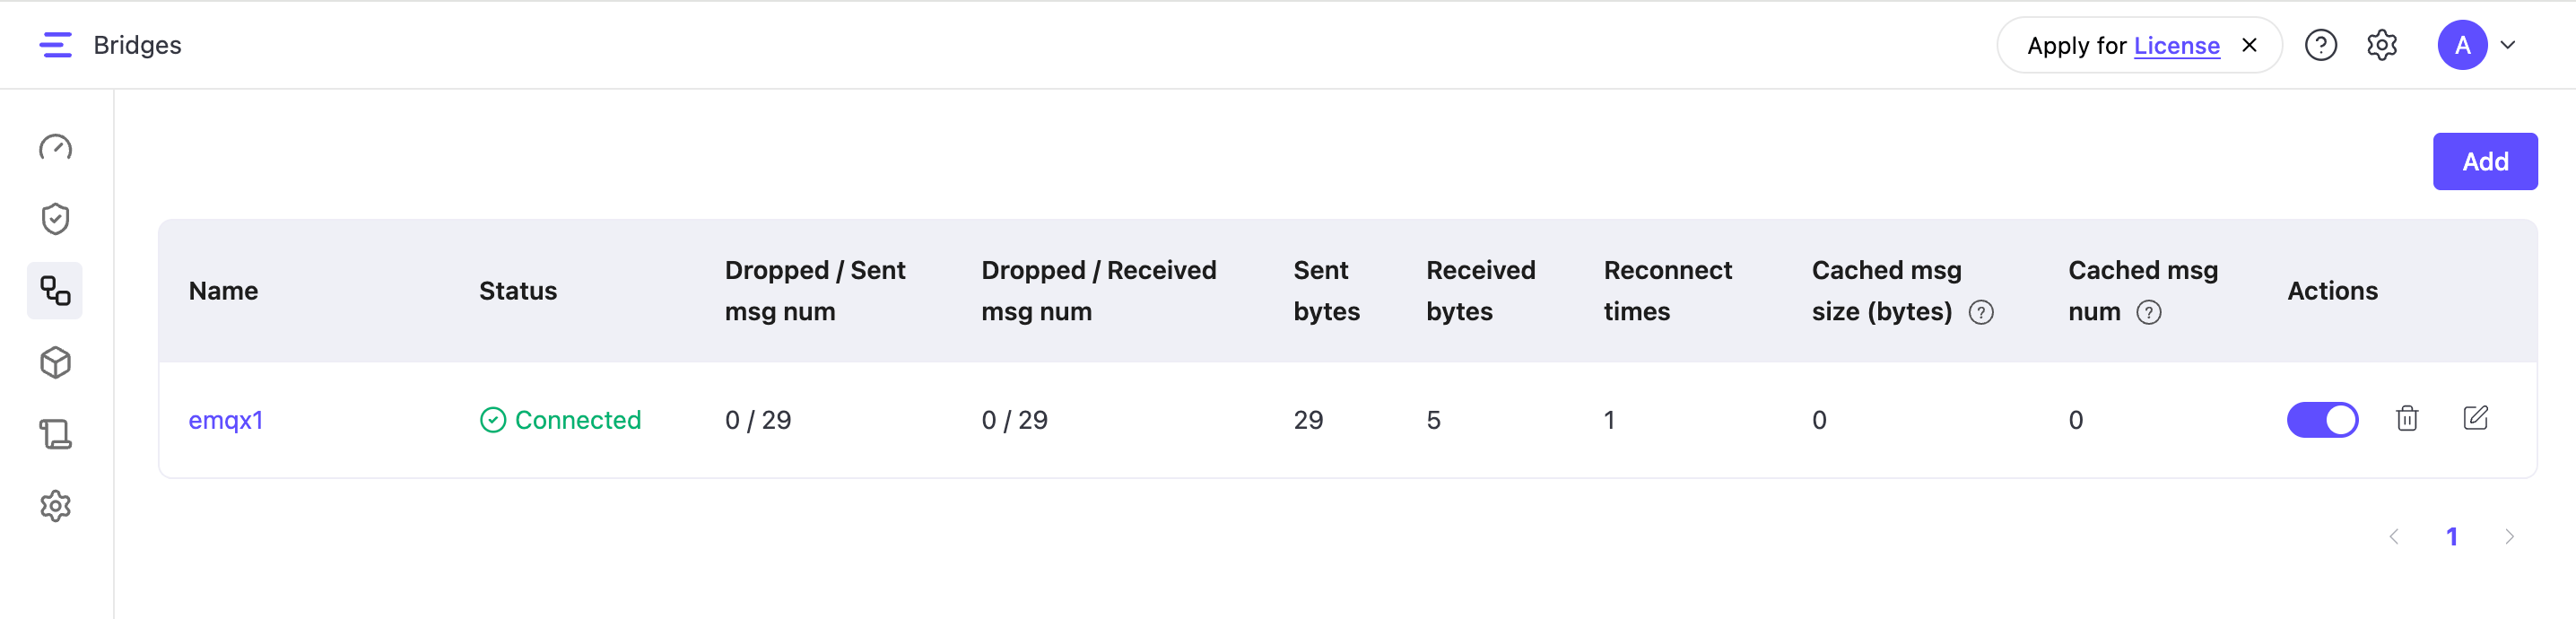
Each bridge is displayed in a table with key metrics to help you assess performance and connection health at a glance:
Message Counts
Dropped / Sent messages number: Number of messages successfully sent from the local broker, and how many were dropped
Dropped / Received messages number: Number of messages successfully received from the remote broker, and how many were dropped
Data Transfer
Sent bytes: Total amount of data (in bytes) sent through this bridge
Received bytes: Total amount of data (in bytes) received through this bridge
Connection Health
- Reconnect times: How many times the bridge connection has been re-established (useful for monitoring connection stability)
- Cached message size: Number of messages currently stored in the bridge's cache (messages waiting to be sent when the connection is restored)
Manage Bridges
On the Bridges page, each listed bridge includes action buttons to:
- Enable / Disable: Temporarily toggle the bridge on or off without deleting it.
- Edit: Modify connection, forwarding, or subscription settings.
- Delete: Permanently remove the bridge.
Add a New Bridge
To create a new bridge, click the Add button in the top-right corner. This opens a guided setup where you can configure:
- Connection settings
- Forwarding rules
- Subscription rules
For detailed steps, refer to:
Monitor Bridge and Client Connection Status
EMQX Edge provides system-level MQTT topics (prefixed with $SYS/) that publish real-time status updates for both clients and bridges. These topics help monitor connection events, such as when a client or a bridge connects or disconnects. Each message includes a unique client identifier defined by the clientid in your bridge configuration.
This mechanism makes it easy to build dashboards, monitoring tools, or alerting systems that track the health and connectivity of bridges and clients in real time.
View Connection Events via System Topics
To observe the bridge or client connection status:
- Use any MQTT client (e.g., MQTTX).
- Connect to EMQX Edge.
- Subscribe to the relevant system topics, such as:
$SYS/brokers/client_status/#This allows you to receive both connection and disconnection event messages as they occur.
Message Format Examples
The following examples illustrate the format of system event messages published by EMQX Edge for client connection and disconnection events. The message format varies slightly depending on the EMQX Edge version.
Online Event (Before v1.2.0)
Topic: $SYS/brokers/connected
Message: {"username":"hello", "ts":1691225605933,"proto_name":"MQTT","keepalive":60,"return_code":"0","proto_ver":4,"client_id":"nanomq-8a2a5c2e","clean_start":1, "IPv4":"127.0.0.1"}
Offline Event (Before v1.2.0)
Topic: $SYS/brokers/disconnected
Message: {"username":"hello","ts":1691225608391,"reason_code":"8b","client_id":"nanomq-8a2a5c2e","IPv4":"127.0.0.1"}
Merged Status Topic (Since v1.2.0)
From version 1.2.0, online/offline events are published to a unified topic:
Topic: $SYS/brokers/client_status/${clientid}Online Event
Topic: $SYS/brokers/client_status/${clientid}
Message: {"status":"online", "username":"hello", "ts":1691225605933,"proto_name":"MQTT","keepalive":60,"return_code":"0","proto_ver":4,"client_id":"nanomq-8a2a5c2e","clean_start":1, "IPv4":"127.0.0.1"}
Offline Event
Topic: $SYS/brokers/client_status/${clientid}
Message: {"status":"offline", "username":"hello","ts":1691225608391,"reason_code":"8b","client_id":"nanomq-8a2a5c2e","IPv4":"127.0.0.1"}
Retained Messages for Latest Status
These system events support the MQTT retain flag, which means the most recent connection state is stored. When a new subscriber connects and subscribes to $SYS/brokers/client_status/#, they immediately receive the last known status of each client or bridge.
Best Practices for Bridge Management
Setting up and managing bridges correctly is key to ensuring reliable and efficient data flow between EMQX Edge and remote MQTT brokers. The Dashboard makes this process much easier by providing a visual interface, allowing you to focus on your application logic rather than complex configuration syntax. Follow these best practices to optimize your MQTT over TCP bridges.
Monitoring Tips
- Check Bridge Status Regularly Ensure each bridge remains connected. Unexpected disconnections may indicate authentication or network issues.
- Monitor Reconnection Attempts A high number of reconnects may indicate network instability, misconfigured keepalive intervals, or the unavailability of the remote broker.
- Track Dropped Messages Frequent message drops, either on send or receive, may indicate problems such as:
- Queue overflows
- Incorrect QoS settings
- Poor network conditions
- Observe Cached Message Size A growing cache may signal that the bridge is disconnected or the remote broker is not processing messages quickly enough.
Configuration Guidelines
- Use Descriptive Bridge Names Name your bridges clearly to reflect their purpose or target (e.g.,
cloud_bridge_ny,emqx_enterprise_main). This improves manageability in environments with multiple bridges. - Start with QoS 1
- Use QoS 1 for most applications, as a good balance between reliability and performance.
- Use QoS 2 only when exactly-once delivery is required. It ensures no message duplication but comes with higher overhead.
- Use QoS 0 for non-critical data or in loss-tolerant scenarios, where delivery is not guaranteed, and messages are sent at most once.
- Test Before Production Deployment Validate bridge settings with test topics before using them in production. This helps catch misconfigurations early.
- Tune Performance Parameters Monitor throughput and adjust settings, such as
max_parallel_processes, based on message volume and system capacity. Avoid over-provisioning, which can lead to resource contention.
TIP
For long-running or large-scale deployments, consider enabling logging and monitoring tools to alert on bridge failures or degraded performance.
Troubleshooting Bridge Issues
If your bridge isn’t working as expected, the table below can help you identify common problems and how to fix them.
| Issue | Possible Cause | Recommended Action |
|---|---|---|
| Connection Failures | Invalid broker address, incorrect credentials, or network issues | Check the broker address, authentication credentials, and network connectivity. |
| Message Loss | QoS 0 used, disconnection, or unstable network | Use an appropriate QoS level, verify network conditions, and check message caching settings. |
| High Latency | Network performance issues or limited parallelism | Reduce parallel connections or assess network performance. |
| Authentication Errors | Incorrect username/password or TLS certificate issues | Verify login credentials and TLS certificate configuration. |
| High Reconnect Counts | Unstable network or misconfigured keepalive | Check network reliability and fine-tune the keepalive interval. |