Logs
Logs help diagnose runtime issues in Device Agent creation, device access, chat control, IM access, voice, and vision workflows. You can inspect and filter records in the console, or read local log files directly.
Open the Logs Page
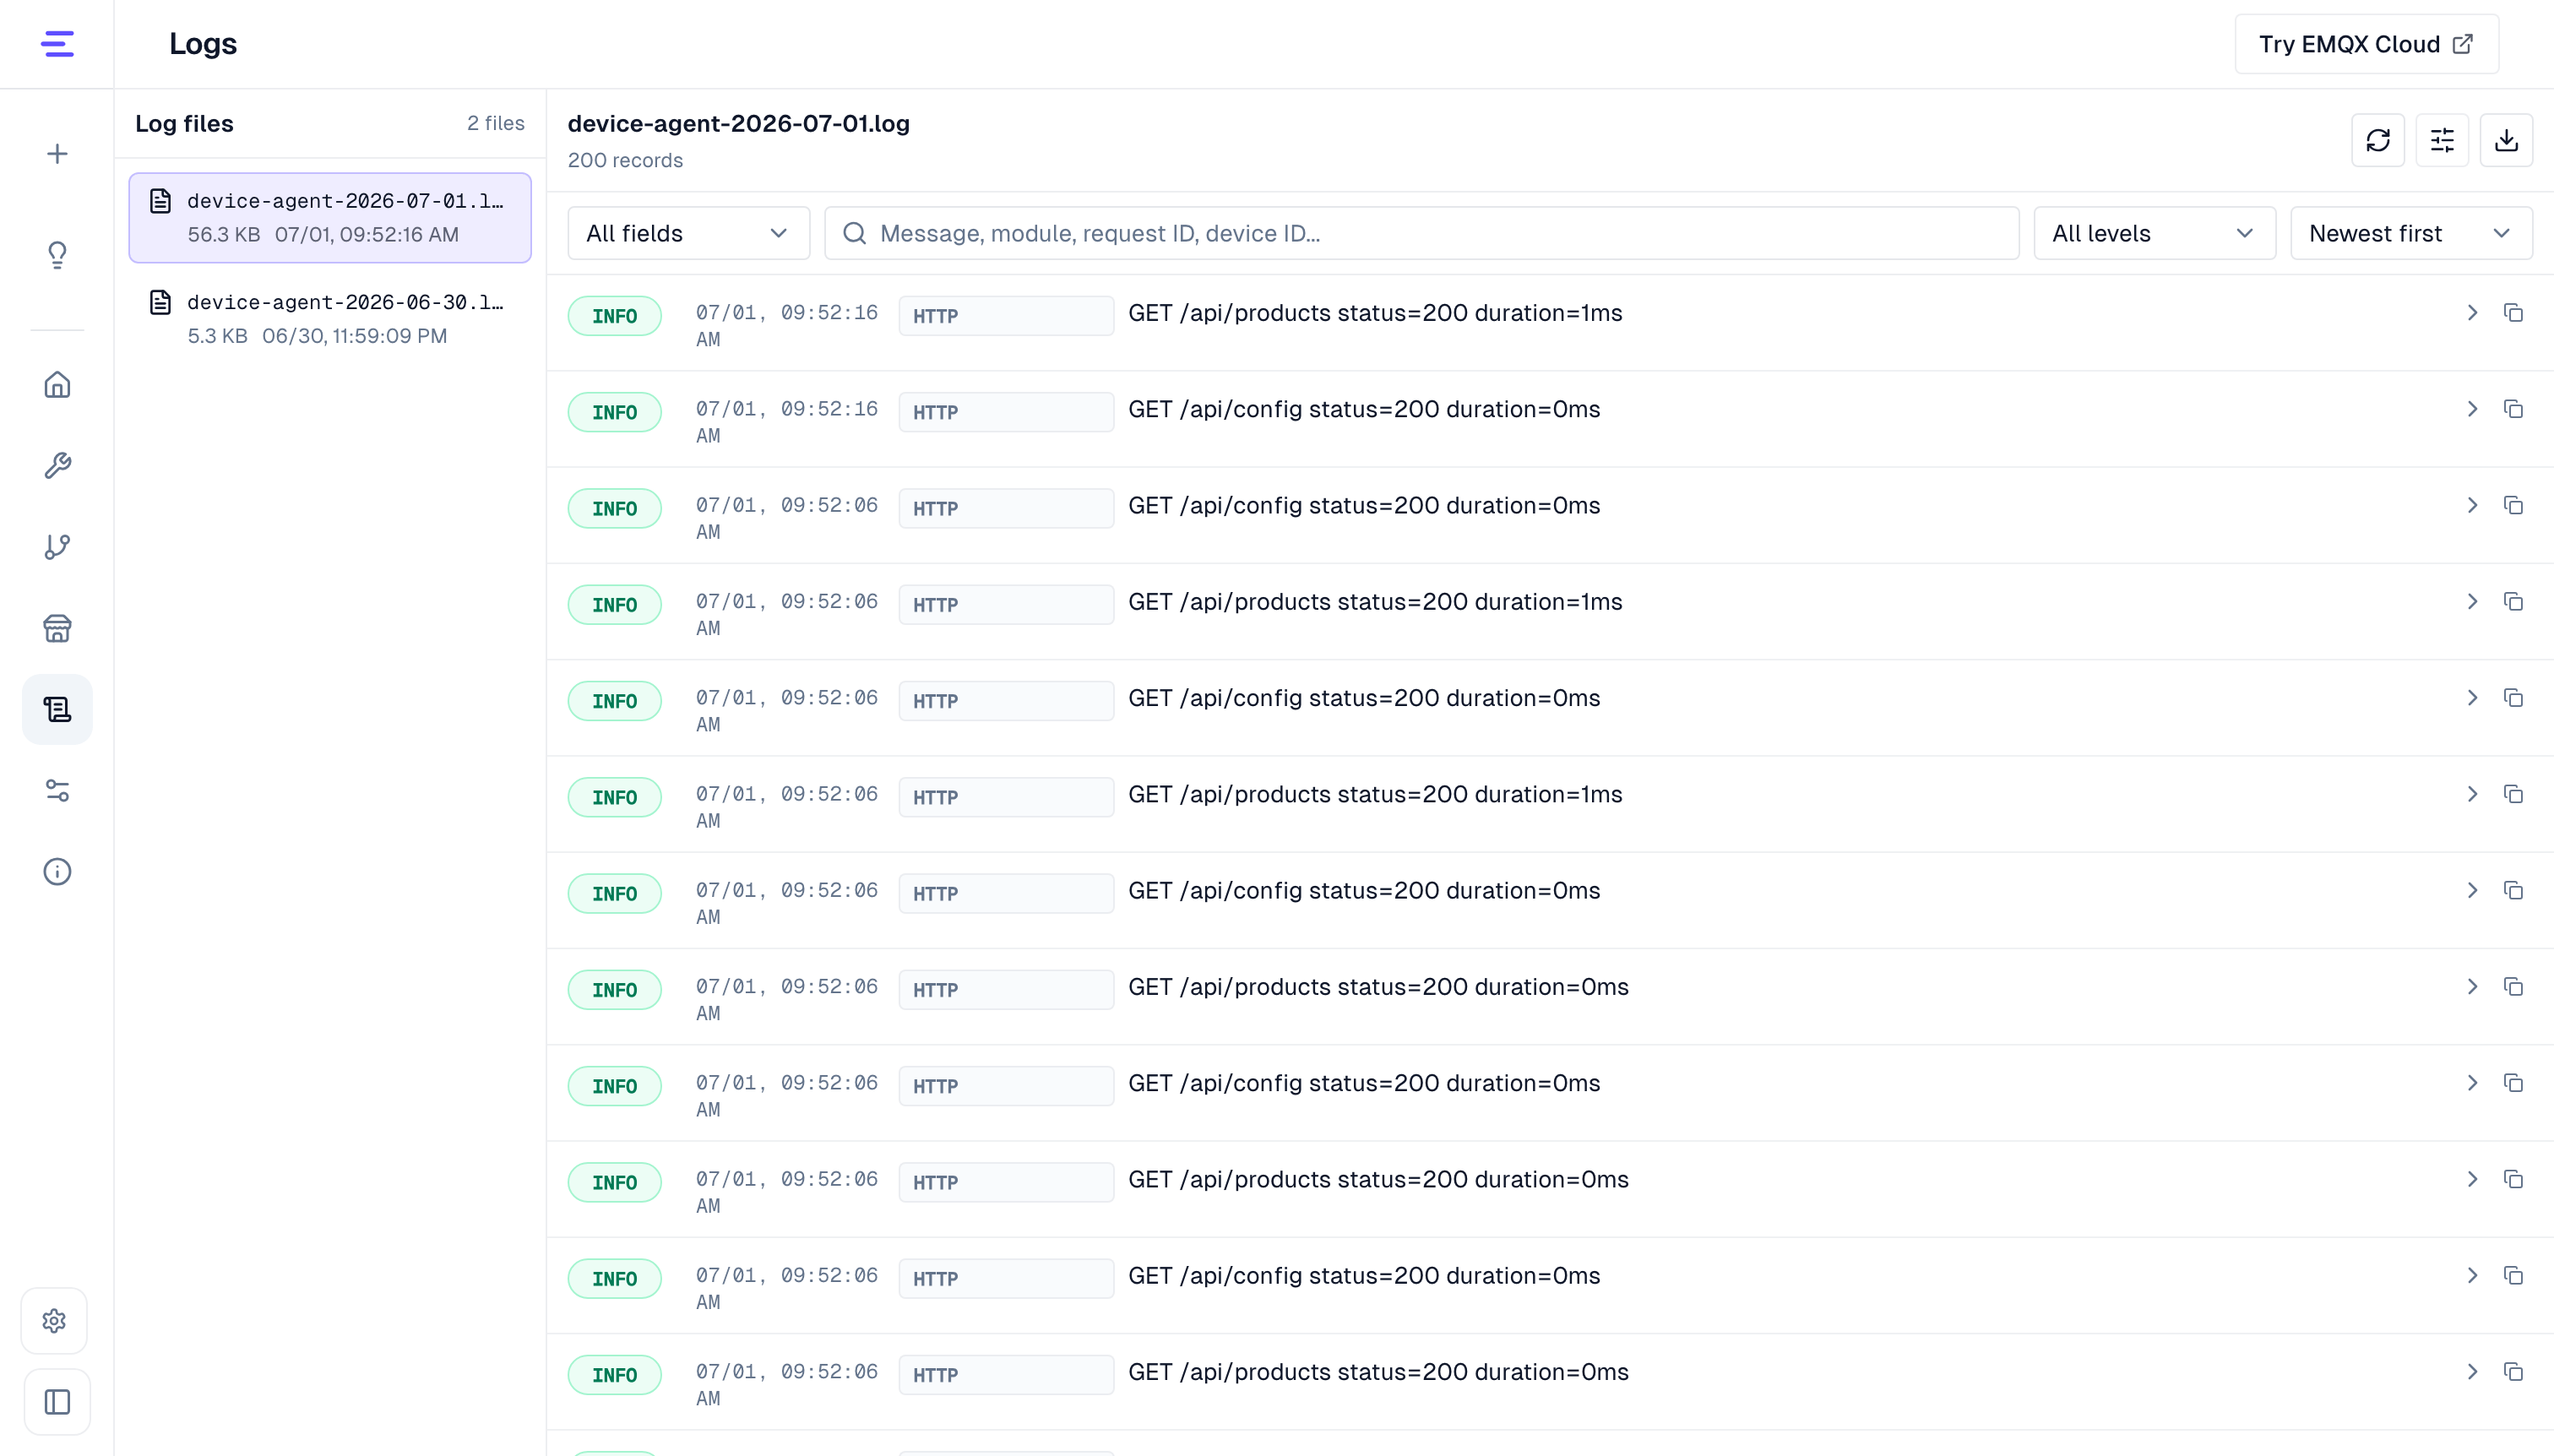
In the console sidebar, click Logs, or open /workspace/logs. The page has two main areas:
| Area | Purpose |
|---|---|
| Log files | Lists available log files, usually named like device-agent-2026-05-11.log. |
| Log records | Shows records from the selected file. The page loads the latest 200 records by default. |
If the page shows that file logging is disabled, open Logging configuration in the top-right corner, enable file logging, and save. New records start writing to files after file logging is enabled; earlier history is not backfilled.
Local Log Files
File logs are written to the logs subdirectory under the runtime home by default:
| Runtime | Default directory |
|---|---|
| Source checkout | <repo>/.device_agent/logs |
| Installed production binary | ~/.device_agent/logs |
Agent Gateway prints Runtime Home during startup. LOG_DIR=logs is resolved relative to that directory; if LOG_DIR is an absolute path, logs are written directly there. The directory name is .device_agent.
Same-day logs are split by size:
device-agent-2026-05-11.log
device-agent-2026-05-11.001.log
device-agent-2026-05-11.002.log
device-agent-YYYY-MM-DD.log is the first file for the day. After it exceeds LOG_MAX_SIZE_MB, new records continue in .001.log, .002.log, and later segments. The Logs page only lists files that match this naming pattern.
Log Record Format
Log files use JSON Lines. Each line is one complete JSON record.
{
  "time": "2026-05-11T05:20:12.123Z",
  "level": "info",
  "module": "MQTT",
  "msg": "device connected",
  "requestId": "req-...",
  "productId": "product-001",
  "deviceId": "device-001",
  "topic": "device-agent/product-001/device/device-001/out",
  "args": [{ "durationMs": 18 }]
}
Common fields:
| Field | Description |
|---|---|
time | ISO timestamp, always written in UTC. |
level | debug, info, warn, or error. |
module | Backend module that emitted the record, such as Gateway, HTTP, MQTT, Agent, Tools, Skills, Voice, NTP, or A2A-Channel. |
msg | Log message. |
requestId / sessionId / traceId | Connect one request, conversation, or tool call. |
namespace / productId / deviceId / topic | Locate a tenant, device, or MQTT topic. |
method / path / statusCode / durationMs | HTTP or service-call context. |
provider / tool | Model provider, voice provider, or tool execution context. |
args / error | Extra context and exception details, sanitized and truncated. |
Fields whose names imply secrets, such as apiKey, authorization, cookie, password, secret, token, or privateKey, are written as [redacted]. Business data is not removed automatically, so check device IDs, topics, state values, and third-party user IDs before sharing logs.
Local Troubleshooting Commands
In a source checkout, run these from the repository root:
ls -lh .device_agent/logs
tail -n 200 .device_agent/logs/device-agent-2026-05-11.log
jq 'select(.level == "error")' .device_agent/logs/device-agent-2026-05-11.log
jq 'select(.deviceId == "device-001") | {time, level, module, msg, topic}' \
  .device_agent/logs/device-agent-2026-05-11.log
jq 'select(.requestId == "req-...")' .device_agent/logs/device-agent-2026-05-11.log
The Logs page uses these local endpoints:
| Endpoint | Purpose |
|---|---|
GET /api/logs/files | List readable log files. |
GET /api/logs/tail?file=device-agent-2026-05-11.log&lines=200 | Read records from the end of a file. lines is capped at 1000. |
GET /api/logs/tail?file=device-agent-2026-05-11.log&before=<offset> | Read earlier records. Use nextBeforeOffset from the previous response as before. |
GET /api/logs/download?file=device-agent-2026-05-11.log | Download one log file. |
View and Filter Records
After selecting a log file, use these controls to locate a problem:
| Action | Best for |
|---|---|
| Refresh | Check new records after a device comes online, a command is sent, or a conversation finishes. |
| Show earlier records | Load older records when the latest 200 are not enough. |
| Filter by level | Focus on warn or error records. |
| Search message | Search error keywords, platform names, MQTT topics, or model service responses. |
| Filter by module | Inspect a capability area such as MQTT, HTTP, Voice, Tools, or A2A. |
| Search request ID | Trace one HTTP request, conversation, or tool call. |
| Search device ID | Inspect reports, commands, and responses for one device. |
Each record can be expanded to show the full JSON payload. Use the copy button to share one entry, or the download button to export the selected log file.
Log Levels
| Level | Description |
|---|---|
debug | Most detailed. Use temporarily for difficult issues. It can generate many records. |
info | Recommended default. Records startup, connections, requests, and main runtime status. |
warn | Records issues that may affect behavior but do not always fail the workflow. |
error | Records failures and exceptions only. |
For daily use, keep info. If a problem is hard to reproduce, switch to debug temporarily, reproduce the issue, then switch back to info.
Configure Logging
On the Logs page, click Logging configuration to adjust:
| Setting | Purpose |
|---|---|
| Level | Controls how much information is recorded. |
| Console logging | Writes logs to the terminal where the service is running. |
| File logging | Writes logs to files that can be viewed and downloaded from the Logs page. |
| Log directory | Where log files are stored. Relative paths are placed under the Device Agent data directory. |
| Max file size | Splits a log file after it reaches the limit. |
| Retention days | Removes old log files after the retention window. |
| Max total size | Removes older files first when all logs exceed the total size limit. |
| File date timezone | Uses either system time or UTC when generating log file names. |
Saved logging settings are written to local configuration. Matching .env values still override saved settings when the service starts.
Common .env settings:
LOG_LEVEL=info
LOG_CONSOLE_ENABLED=true
LOG_FILE_ENABLED=true
LOG_DIR=logs
LOG_MAX_SIZE_MB=50
LOG_RETENTION_DAYS=14
LOG_MAX_TOTAL_SIZE_MB=1024
LOG_TIMEZONE=system
See Configuration for other configuration sources.
Common Troubleshooting Paths
| Issue | What to check |
|---|---|
| A device does not appear in the list | Search by device ID and confirm MQTT connection, online status, or telemetry reports. |
| Chat control does not take effect | Search by device ID or request ID to see whether a command was sent and whether the device responded. |
| An IM bot does not reply | Search by module or platform name to inspect credentials, allow lists, message receiving, and reply delivery. |
| Voice recognition or playback fails | Filter by voice-related modules and inspect voice service, session, and recognition records. |
| A tool or skill does not run | Filter by tool-related modules and inspect tool loading, permissions, and execution results. |
| A model service returns an error | Search by error or model provider name to inspect request failure, authentication failure, or timeout information. |
Before downloading or sharing logs, check whether they include device IDs, topics, state values, third-party user IDs, or other sensitive business data. Common secret fields are redacted, but business data can still appear in log messages.