Prometheus 监控
EMQX Cloud 提供了 Prometheus API ,您可以轻松调用 API 来监控 EMQX Cloud 的关键指标。 在本文中我们将介绍如何配置 Prometheus 服务,从 EMQX Cloud API 读取关键指标,以及如何使用 Grafana 模版查看指标。
注意
该功能仅适用于专有版部署。
API 配置
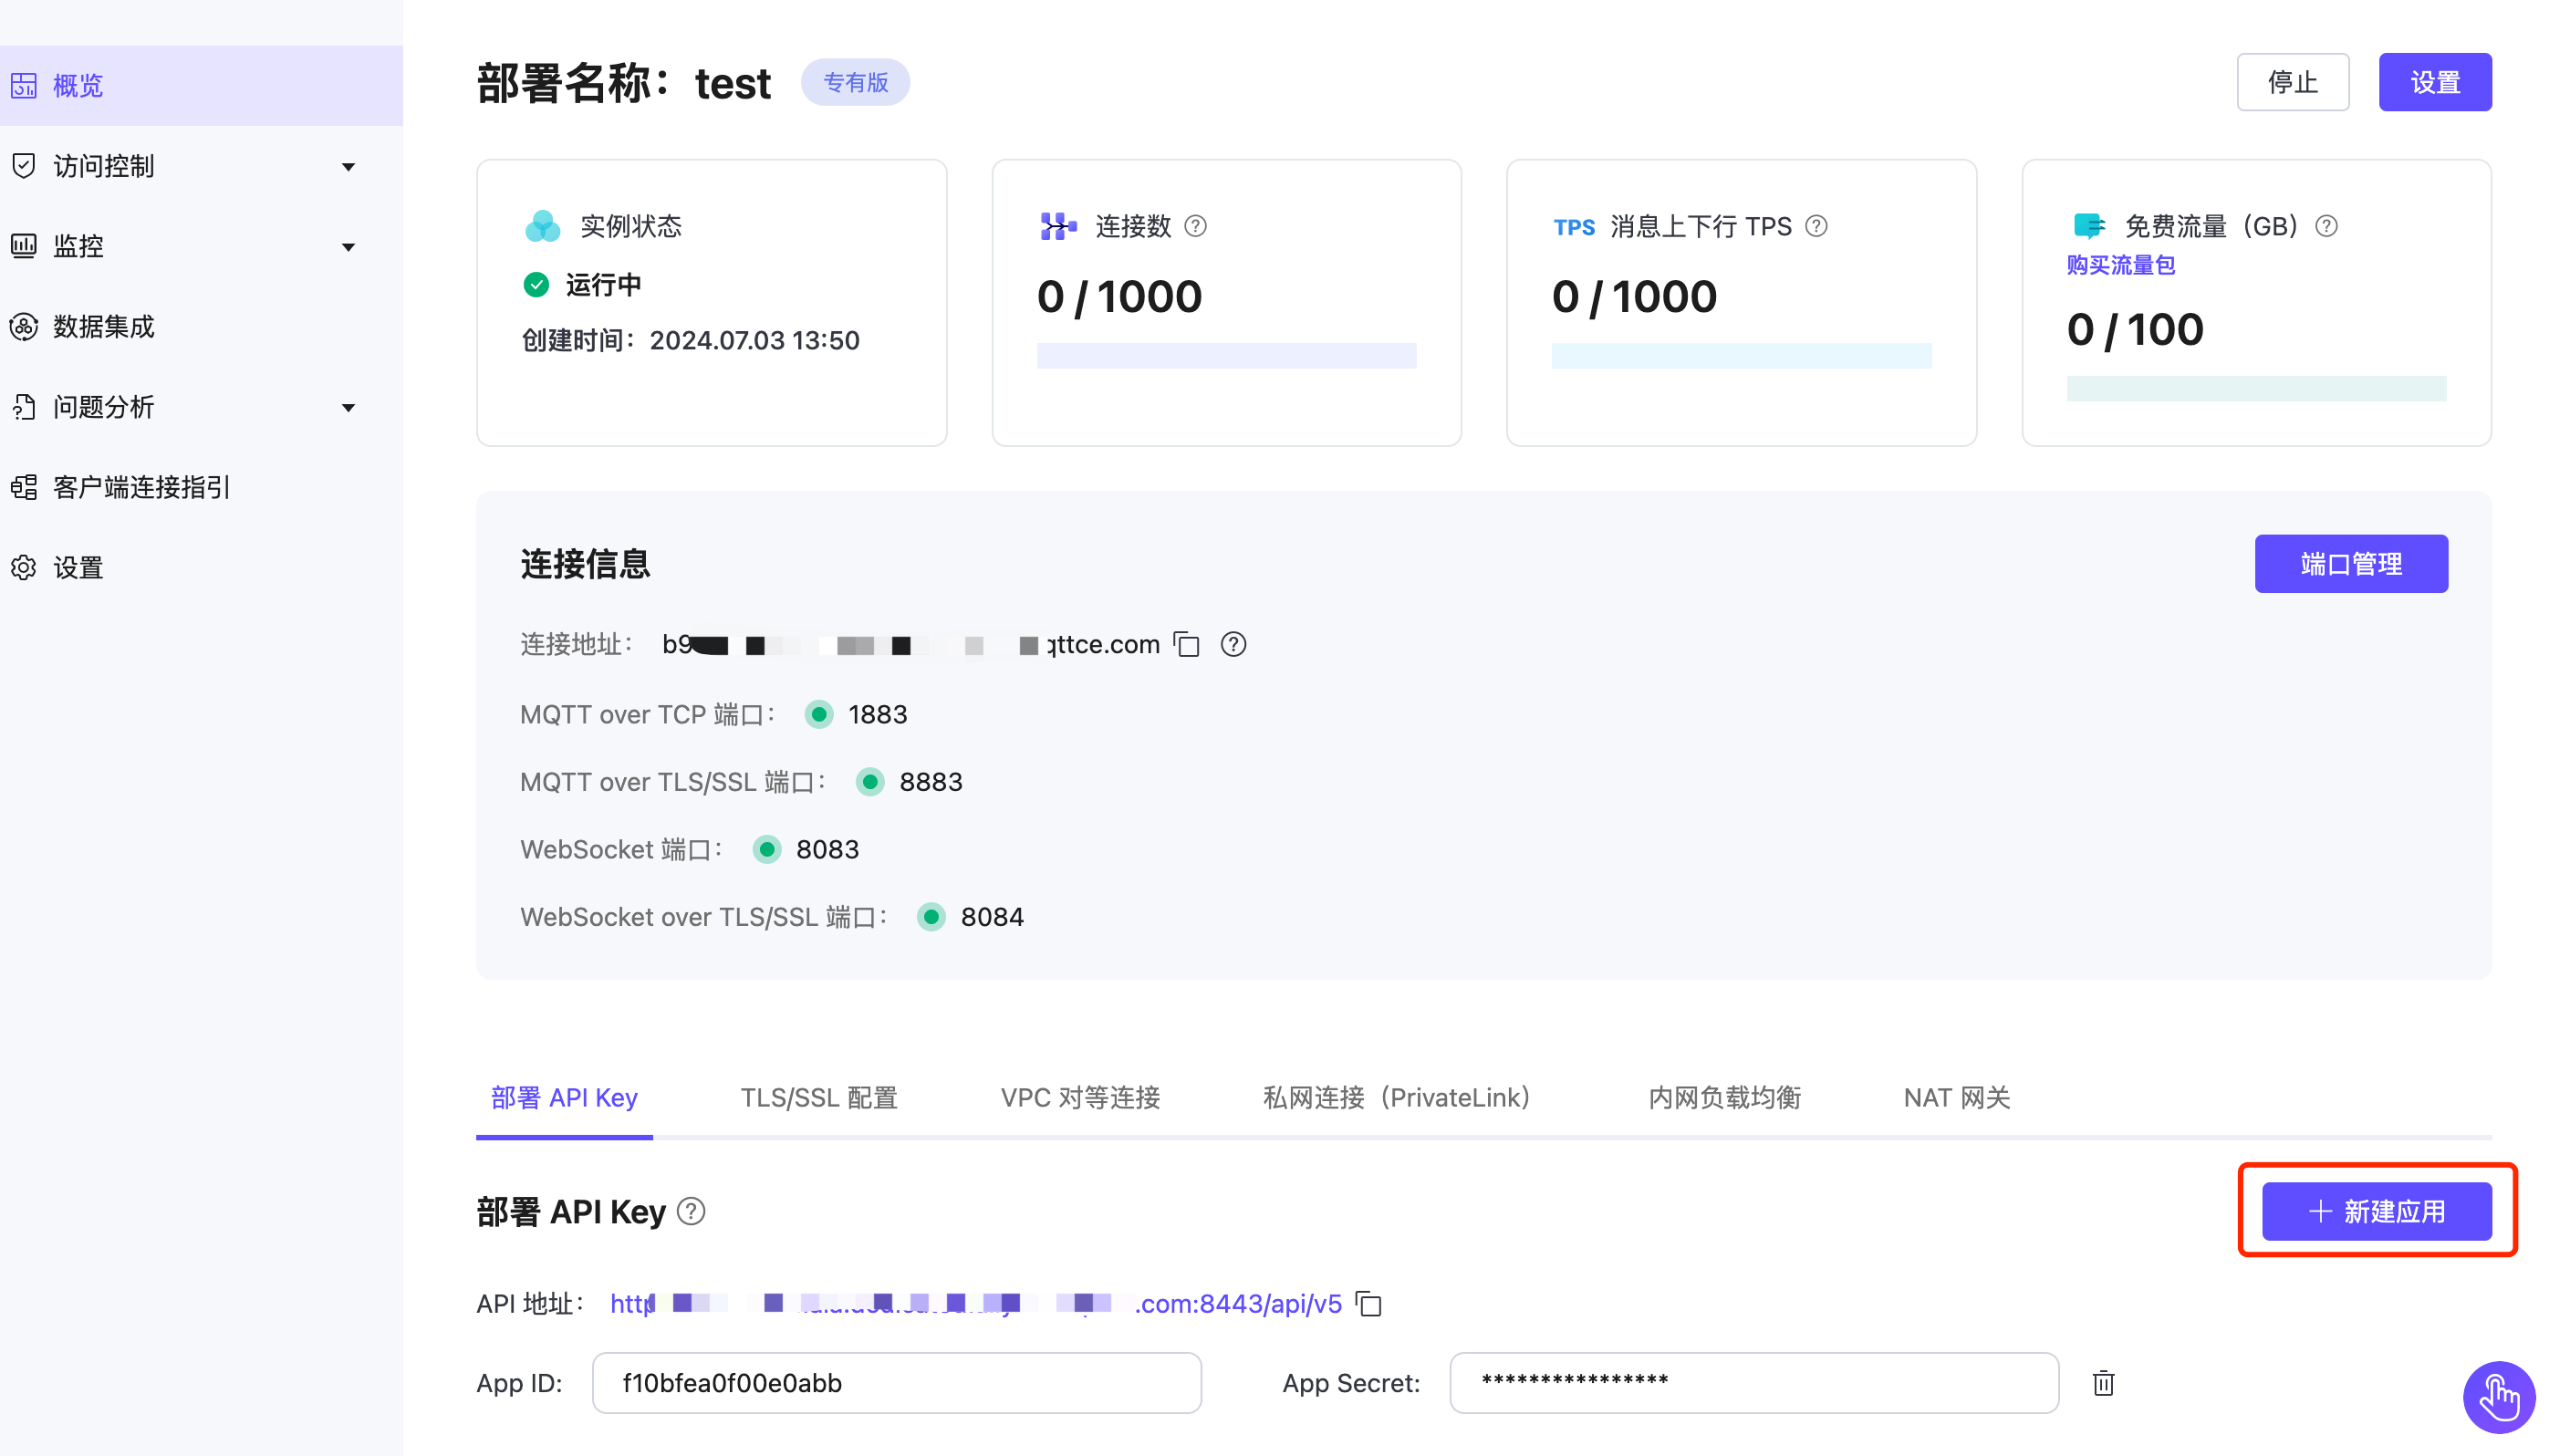
在 EMQX Cloud 部署控制台的概览页面找到部署 API Key,获取到 API 地址,点击新建应用,获取 APP ID 和 APP Secret。
集群指标 URI
GET /deployment_metrics
返回供 Prometheus 采集的集群指标。
查询参数:
无
请求消息
无
请求示例
curl -u app_id:app_secret -X GET {api}/deployment_metrics响应
| 指标名称 | 描述 | 类型 |
|---|---|---|
| deployment_emqx_sessions_count | 集群当前会话数 | Gauge |
| deployment_emqx_connections_count | 集群当前连接数 | Gauge |
| deployment_emqx_sent_msg_rate | 每秒发送的消息速率 | Gauge |
| deployment_emqx_received_msg_rate | 每秒接收的消息速率 | Gauge |
| deployment_emqx_metrics_cluster_sessions_count | 集群中的会话数 | Gauge |
| deployment_emqx_metrics_cluster_sessions_max | 集群中的历史最大会话数 | Gauge |
| deployment_emqx_metrics_delayed_count | 延迟消息数 | Gauge |
| deployment_emqx_metrics_delayed_max | 历史最大延迟消息数 | Gauge |
| deployment_emqx_metrics_live_connections_count | 活跃连接数 | Gauge |
| deployment_emqx_metrics_live_connections_max | 历史最大活跃连接数 | Gauge |
| deployment_emqx_disconnected_durable_sessions | 断开连接后仍保留的会话数 | Gauge |
| deployment_emqx_dropped_msg_rate | 丢弃的消息速率 | Gauge |
| deployment_emqx_license_quota | 许可证允许的最大连接数 | Gauge |
| deployment_emqx_node_count | EMQX 集群中的节点数 | Gauge |
| deployment_emqx_persisted_rate | 持久化存储的消息速率 | Gauge |
| deployment_emqx_retained_msg_count | 当前保留的消息数量 | Gauge |
| deployment_emqx_shared_subscriptions | 共享订阅数 | Gauge |
| deployment_emqx_subscriptions | 订阅总数 | Gauge |
| deployment_emqx_subscriptions_durable | 会话持久化的订阅数 | Gauge |
| deployment_emqx_subscriptions_ram | 存储在 RAM 中的非持久化订阅数 | Gauge |
| deployment_emqx_topics | 主题总数 | Gauge |
| deployment_emqx_transformation_failed_rate | 消息转换失败速率 | Gauge |
| deployment_emqx_transformation_succeeded_rate | 成功转换的消息速率 | Gauge |
| deployment_emqx_validation_failed_rate | 消息验证失败速率 | Gauge |
| deployment_emqx_validation_succeeded_rate | 消息验证成功速率 | Gauge |
| deployment_emqx_metrics_topics_count | 当前主题数 | Gauge |
| deployment_emqx_metrics_topics_max | 历史最大主题数 | Gauge |
| deployment_emqx_metrics_subscriptions_max | 历史最大订阅数 | Gauge |
| deployment_emqx_metrics_subscriptions_count | 当前订阅数 | Gauge |
| deployment_emqx_metrics_subscribers_max | 历史最大订阅者数 | Gauge |
| deployment_emqx_metrics_subscribers_count | 当前订阅者数 | Gauge |
| deployment_emqx_metrics_connections_count | 当前连接数 | Gauge |
| deployment_emqx_metrics_connections_max | 历史最大连接数 | Gauge |
| deployment_emqx_metrics_channels_count | 当前通道数 | Gauge |
| deployment_emqx_metrics_channels_max | 历史最大通道数 | Gauge |
| deployment_emqx_metrics_sessions_count | 当前会话数 | Gauge |
| deployment_emqx_metrics_sessions_max | 历史最大会话数 | Gauge |
| deployment_emqx_metrics_suboptions_count | 当前订阅选项数 | Gauge |
| deployment_emqx_metrics_suboptions_max | 历史最大订阅选项数 | Gauge |
| deployment_emqx_metrics_subscriptions_shared_count | 当前共享订阅数 | Gauge |
| deployment_emqx_metrics_subscriptions_shared_max | 历史最大共享订阅数 | Gauge |
| deployment_emqx_metrics_retained_count | 当前保留的消息数 | Gauge |
| deployment_emqx_metrics_retained_max | 历史最大保留消息数 | Gauge |
| deployment_emqx_cluster_status | EMQX 集群状态 | Gauge |
| deployment_emqx_metrics_durable_subscriptions_max | 当前集群的最大持久订阅数 | Counter |
| deployment_emqx_metrics_durable_subscriptions_count | 当前集群的持久订阅数 | Counter |
| deployment_emqx_metrics_client_disconnected_reason | 按原因统计的监听器关闭次数 | Counter |
| deployment_emqx_metrics_bytes_received | 接收的字节数 | Counter |
| deployment_emqx_metrics_bytes_sent | 发送的字节数 | Counter |
| deployment_emqx_metrics_packets_received | 接收的数据包数 | Counter |
| deployment_emqx_metrics_packets_sent | 发送的数据包数 | Counter |
| deployment_emqx_metrics_packets_connack_auth_error | 发送的带有身份验证错误的 CONNACK 消息数 | Counter |
| deployment_emqx_metrics_packets_connack_error | 发送的带错误的 CONNACK 数据包数 | Counter |
| deployment_emqx_metrics_packets_connack_sent | 发送的 CONNACK 数据包数 | Counter |
| deployment_emqx_metrics_packets_publish_received | 接收的 PUBLISH 数据包数 | Counter |
| deployment_emqx_metrics_packets_publish_sent | 发送的 PUBLISH 数据包数 | Counter |
| deployment_emqx_metrics_packets_publish_dropped | 丢弃的 PUBLISH 数据包数 | Counter |
| deployment_emqx_metrics_packets_puback_received | 接收的 PUBACK 数据包数 | Counter |
| deployment_emqx_metrics_packets_puback_sent | 发送的 PUBACK 数据包数 | Counter |
| deployment_emqx_metrics_packets_subscribe_received | 接收的 SUBSCRIBE 数据包数 | Counter |
| deployment_emqx_metrics_packets_unsubscribe_received | 接收的 UNSUBSCRIBE 数据包数 | Counter |
| deployment_emqx_metrics_packets_pingreq_received | 接收的 PINGREQ 数据包数 | Counter |
| deployment_emqx_metrics_packets_disconnect_received | 接收的 DISCONNECT 数据包数 | Counter |
| deployment_emqx_metrics_delivery_dropped_too_large | 因大小超限丢弃的投递数 | Counter |
| deployment_emqx_metrics_messages_delayed | 延迟的消息数 | Counter |
| deployment_emqx_metrics_messages_dropped | 丢弃的消息数 | Counter |
| deployment_emqx_metrics_messages_publish | 发布的消息数 | Counter |
| deployment_emqx_metrics_messages_received | 接收的消息总数 | Counter |
| deployment_emqx_metrics_messages_sent | 发送的消息总数 | Counter |
| deployment_emqx_metrics_messages_retained | 保留的消息数 | Counter |
| deployment_emqx_metrics_client_connect | 客户端连接数 | Counter |
| deployment_emqx_metrics_client_authenticate | 客户端身份验证次数 | Counter |
| deployment_emqx_metrics_client_connected | 当前连接的客户端数 | Counter |
| deployment_emqx_metrics_client_disconnected | 客户端断开连接次数 | Counter |
| deployment_emqx_metrics_session_created | 创建的会话数 | Counter |
| deployment_emqx_metrics_session_resumed | 恢复的会话数 | Counter |
| deployment_emqx_metrics_session_terminated | 终止的会话数 | Counter |
| deployment_emqx_metrics_traffic_total_egress_bytes | 总出站流量字节数 | Counter |
| deployment_emqx_metrics_traffic_total_ingress_bytes | 总入站流量字节数 | Counter |
数据集成指标 URI
GET /deployment_metrics/data_integration
返回供 Prometheus 采集的数据集成指标。
查询参数:
无
请求消息
无
请求示例
curl -u app_id:app_secret -X GET {api}/deployment_metrics/data_integration响应
- 每个资源的状态
- 每个规则的状态
- 每个规则的不同匹配状态计数(“匹配“、”通过”、“失败”、“异常”、“无结果”)
- 每个规则下所有动作的处理状态计数(“成功”、“失败”、“已执行”)
| 指标名称 | 描述 | 类型 | 变量标签 |
|---|---|---|---|
| deployment_emqx_resource_status | 指定资源的当前状态 | Gauge | resource_id |
| deployment_emqx_rule_status | 指定规则的当前状态 | Gauge | rule_id |
| deployment_emqx_rule_matched_count | 指定规则的匹配总次数 | Gauge | rule_id, match_status |
| deployment_emqx_rule_action_execution_count | 指定规则的动作执行次数 | Gauge | rule_id, execution_status |
| deployment_emqx_action_dropped_count | 指定动作丢弃的事件数量 | Counter | drop_reason |
| deployment_emqx_action_enable | 启用动作的 EMQX 节点数量 | Gauge | status |
| deployment_emqx_action_events_count | 指定动作的事件数量 | Counter | event, action_id |
| deployment_emqx_action_queued_count | 指定动作的排队事件数量 | Gauge | action_id, queue_status |
| deployment_emqx_action_retried_count | 指定动作的重试事件数量 | Counter | action_id, retry_status |
| deployment_emqx_action_status | 指定动作的当前状态 | Gauge | action_id |
认证和授权指标 URI
GET /deployment_metrics/auth
返回供 Prometheus 采集的认证和授权指标。
查询参数:
无
请求消息
无
请求示例
curl -u app_id:app_secret -X GET {api}/deployment_metrics/auth响应
| 指标名称 | 描述 | 类型 | 变量标签 |
|---|---|---|---|
| deployment_emqx_authn_enable | 指定的认证(auth)方法是否启用 | Gauge | id |
| deployment_emqx_authn_match_count | 每种认证方法的统计数据 | Gauge | id, status |
| deployment_emqx_authn_status | 每种认证方法的可用性状态 | Gauge | id |
| deployment_emqx_authz_enable | 指定的授权(authz)方法是否启用 | Gauge | id |
| deployment_emqx_authz_match_count | 每种授权方法的统计数据 | Gauge | id, status |
| deployment_emqx_authz_status | 每种授权方法的可用性状态 | Gauge | id |
数据智能中心指标 URI
GET /deployment_metrics/data_hub
返回供 Prometheus 采集的数据智能中心指标。
查询参数:
无
请求消息
无
请求示例
curl -u app_id:app_secret -X GET {api}/deployment_metrics/data_hub响应
| 指标名称 | 描述 | 类型 | 变量标签 |
|---|---|---|---|
| emqx_message_transformation_enable | 消息转换启用状态 | Gauge | validation_name |
| emqx_message_transformation_stats | 消息转换统计数据 | Counter | stats, validation_name |
| emqx_schema_validation_enable | Schema 验证启用状态 | Gauge | validation_name |
| emqx_schema_validation_stats | Schema 验证统计数据 | Counter | stats, validation_name |
Prometheus 配置
安装 Prometheus:
bashwget -c https://github.com/prometheus/prometheus/releases/download/v2.35.0-rc0/prometheus-2.35.0-rc0.linux-amd64.tar.gz tar xvfz prometheus-*.tar.gz修改配置文件。
找到您的 Prometheus 服务指定的监控目录,按如下示例修改配置文件 prometheus.yml 的
scrape_configssection:bashscrape_configs: - job_name: 'emqx_cloud_deployment_metrics' scheme: 'https' static_configs: - targets: [ 'xxxx:8443' ] metrics_path: "/api/v5/deployment_metrics" params: type: [ "prometheus" ] basic_auth: username: 'APP ID' password: 'APP Secret' - job_name: 'emqx_cloud_deployment_data_integration_metrics' scheme: 'https' static_configs: - targets: [ 'xxxx:8443' ] metrics_path: "/api/v5/deployment_metrics/data_integration" params: type: [ "prometheus" ] basic_auth: username: 'APP ID' password: 'APP Secret'启动并检查服务状态。
启动 Prometheus:
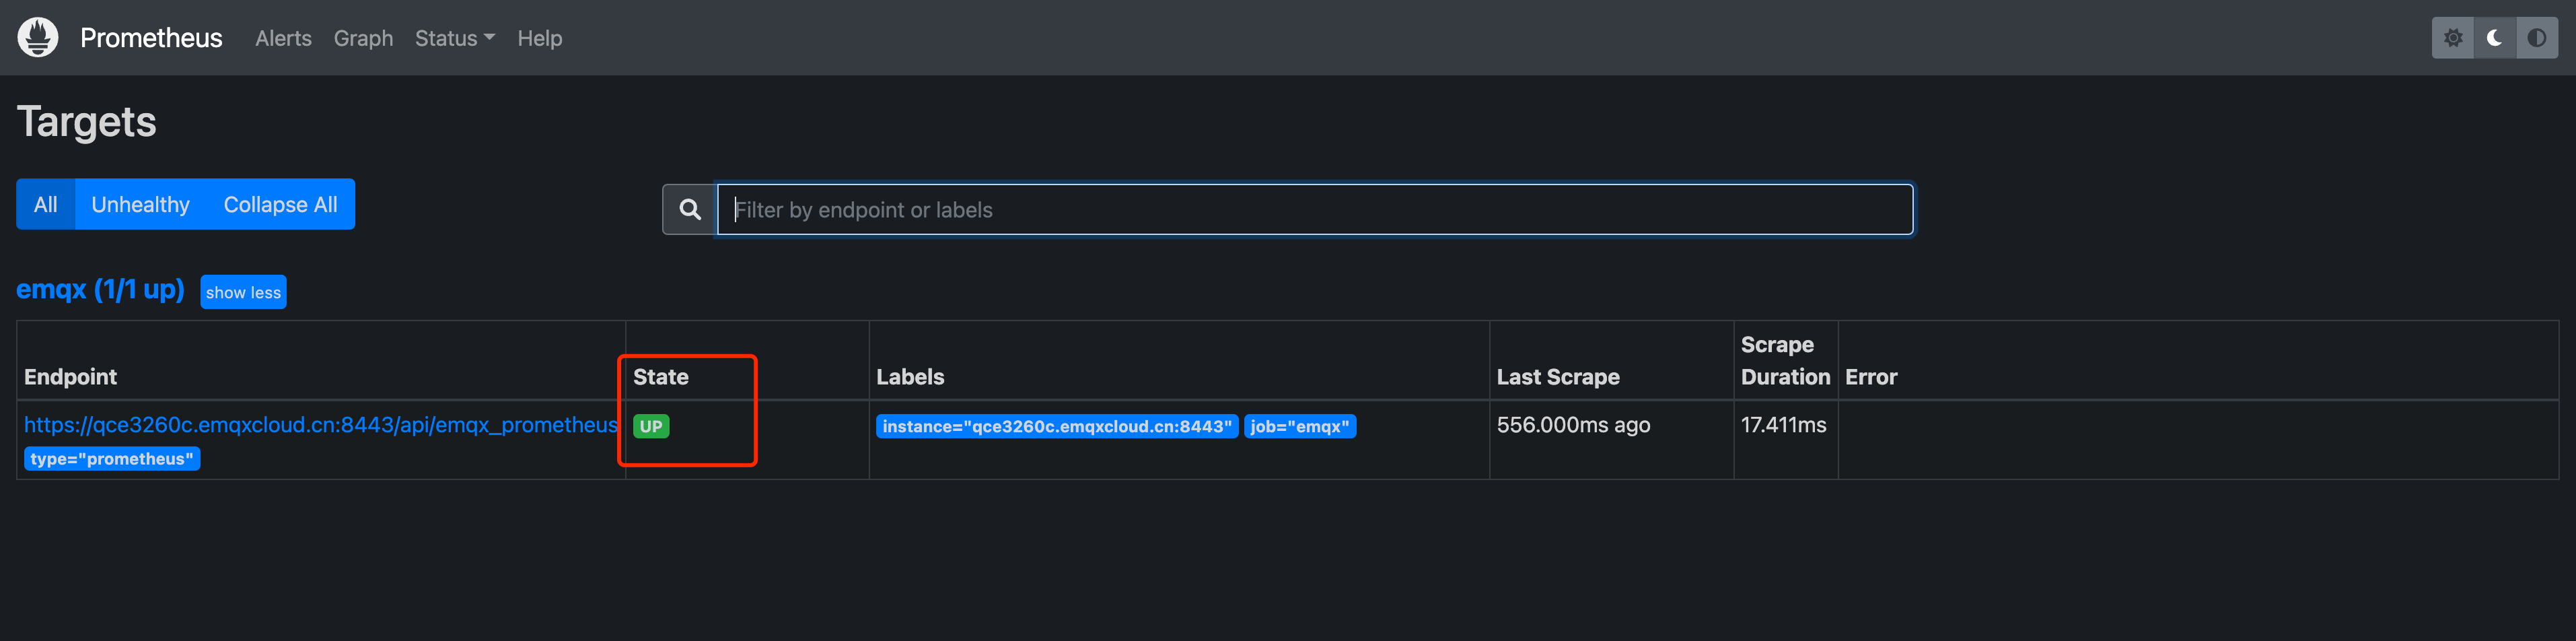
bash./prometheus --config.file=prometheus.yml通过本地 IP + 对应端⼝,如:x.x.x.x:9090 访问您的 Prometheus 服务,检查 Status - Targets 以确认新的 scrape_config 文件已被读取。如果状态显示异常,您可能需要检查配置文件,重新启动 Prometheus 服务。
Grafana 配置
安装并启动 Grafana:
bashwget https://dl.grafana.com/enterprise/release/grafana-enterprise-8.4.6.linux-amd64.tar.gz tar -zxvf grafana-enterprise-8.4.6.linux-amd64.tar.gz ./bin/grafana-server配置 Grafana。
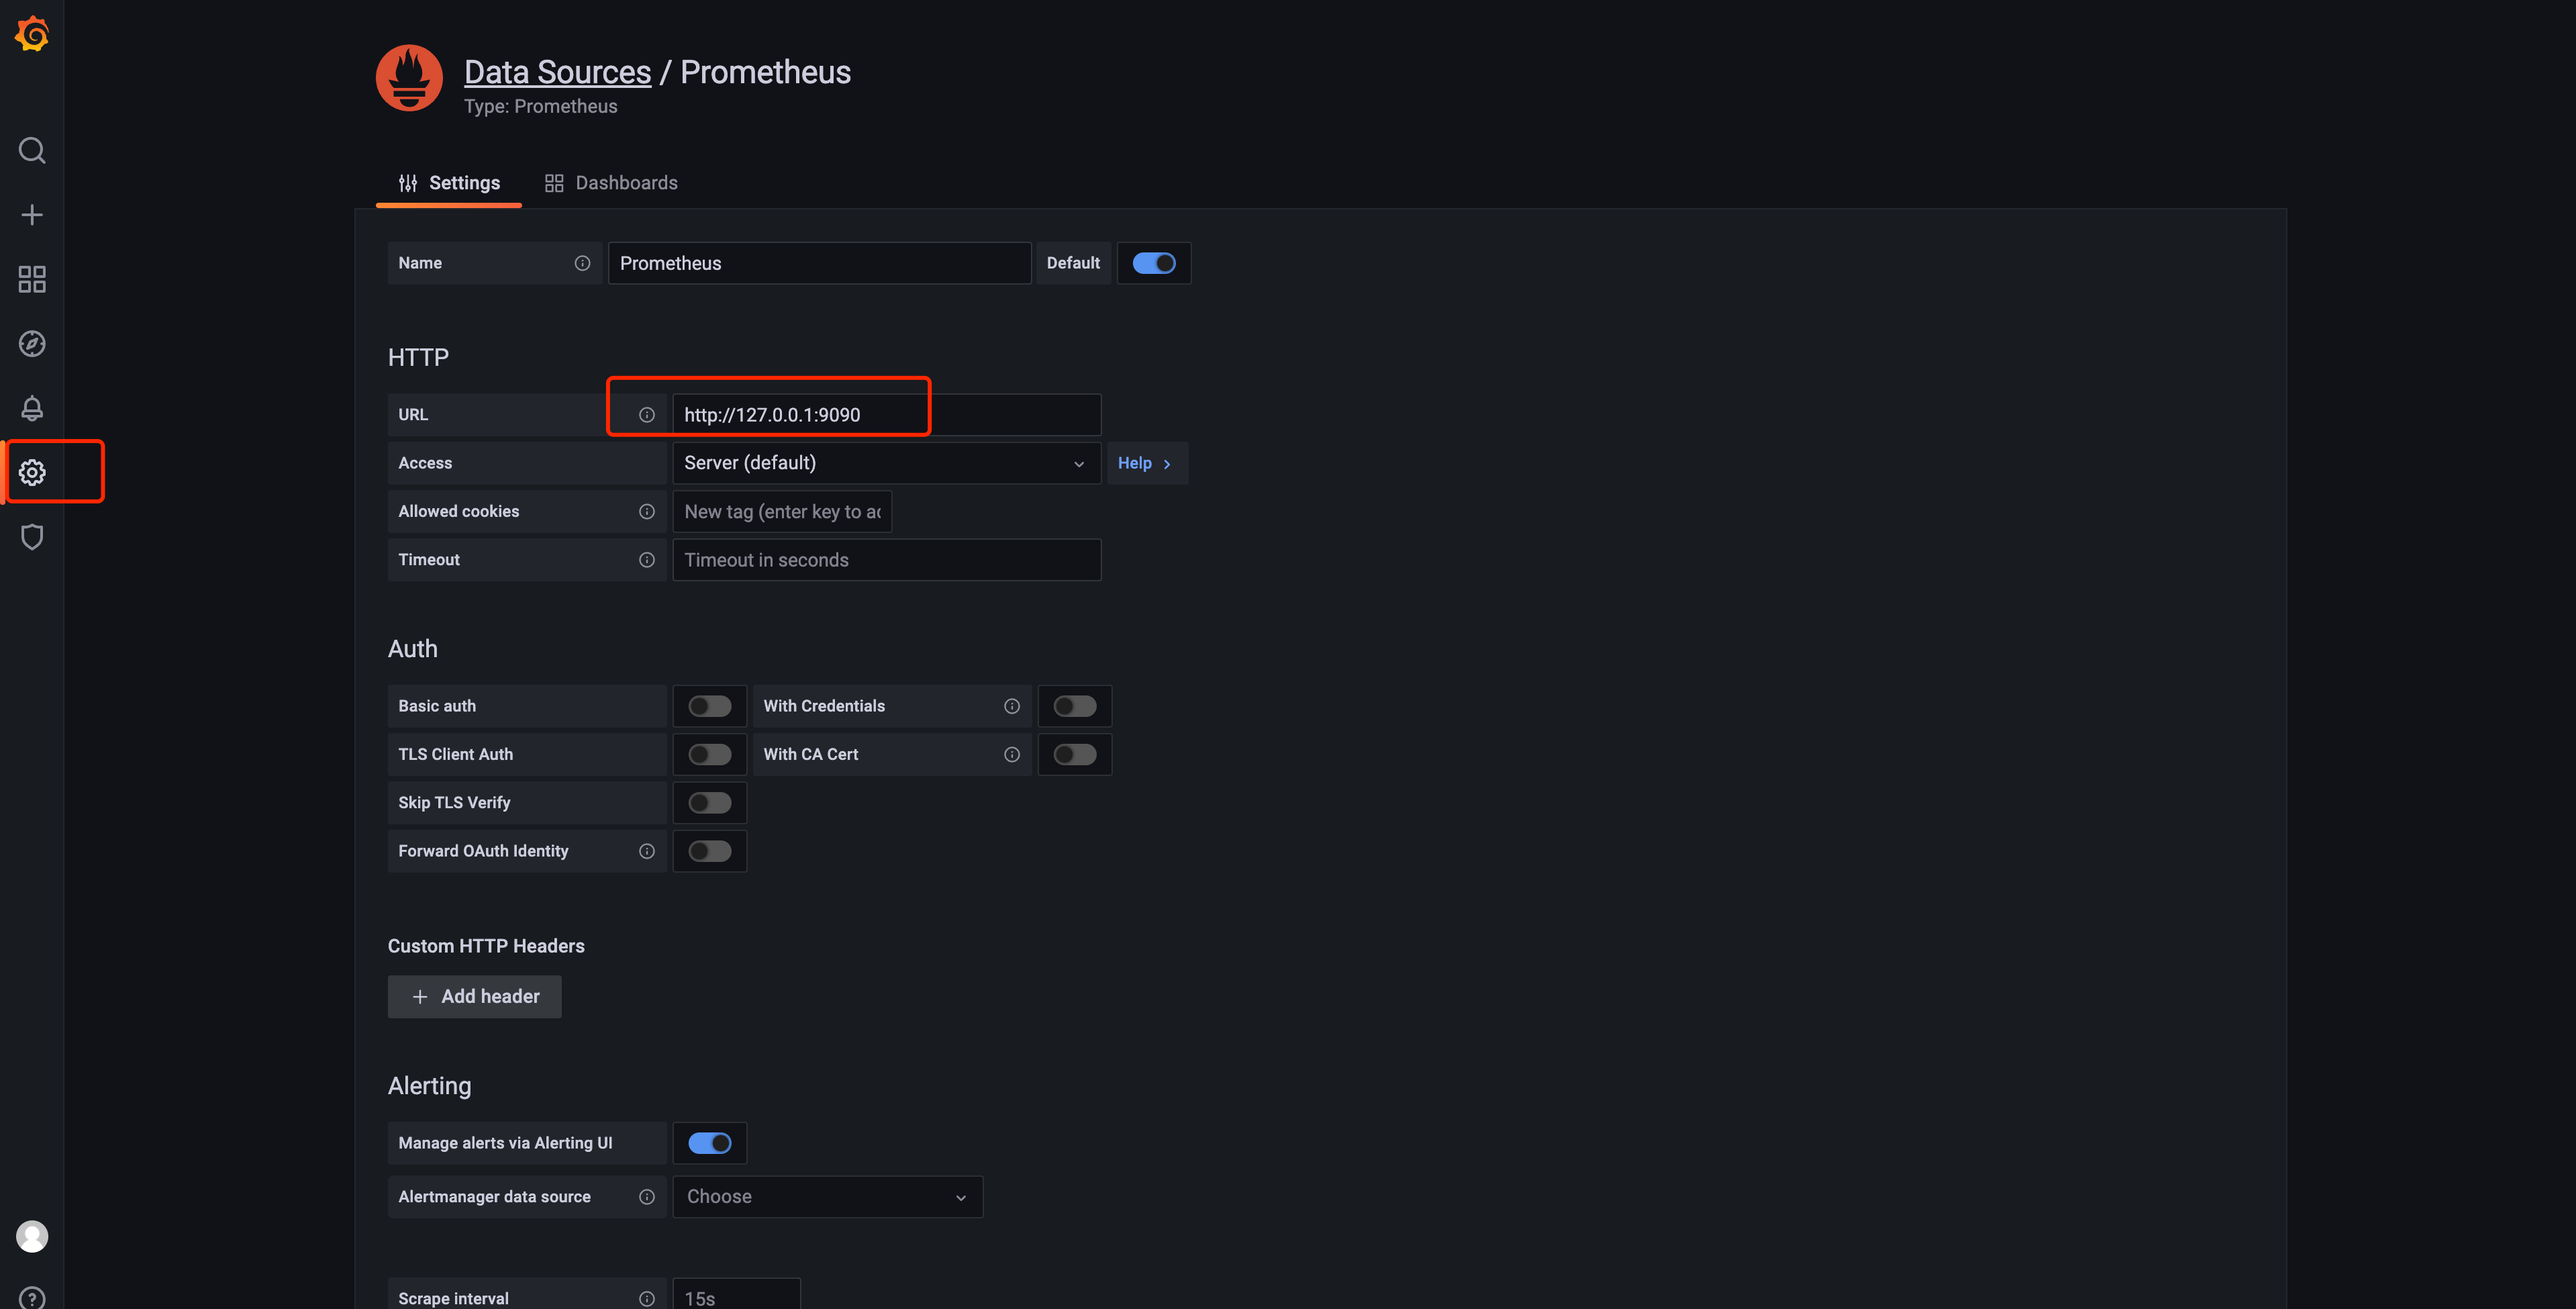
通过本地 IP + 对应端⼝,如:x.x.x.x:3000, 访问 Grafana 的 Dashbroad。初始 ID 和密码都是 admin,初次登录请修改密码,登录进⼊后需添加 Data sources - Prometheus。
导⼊ Grafana 数据模板。
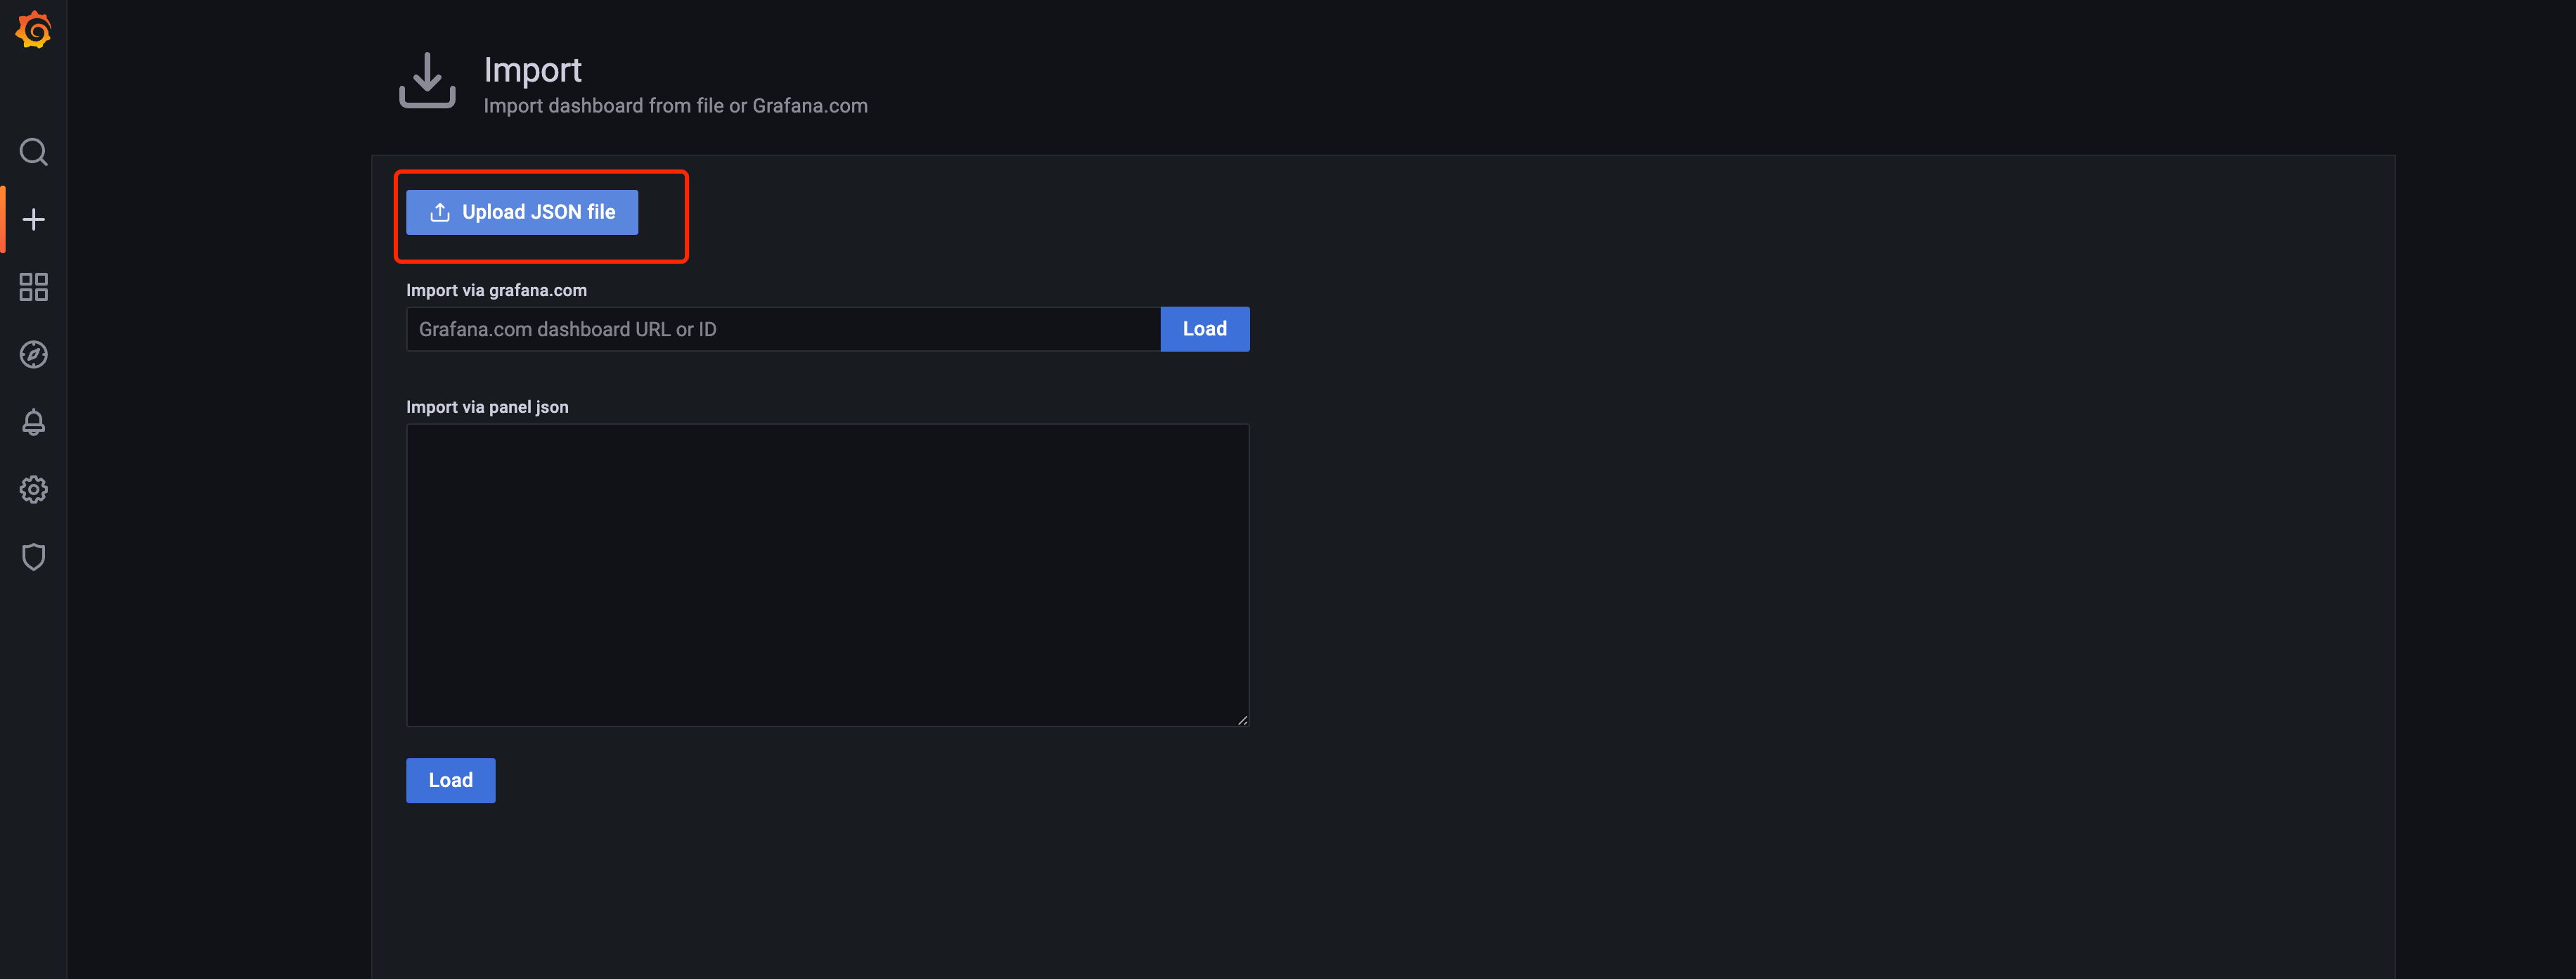
EMQX Cloud 提供了 Grafana 的 Dashboard 的模板文件。这些模板包含了所有 EMQX Cloud 监控数据的展示。用户可直接导入到 Grafana 中,生成显示 EMQX 监控状态的图表。点击这里获取模板文件。
可通过 "Upload JSON file" 的方式上传本地的 grafana_template.json ⽂件,或者通过 "Import via panel json" 手动编写。
指标详解
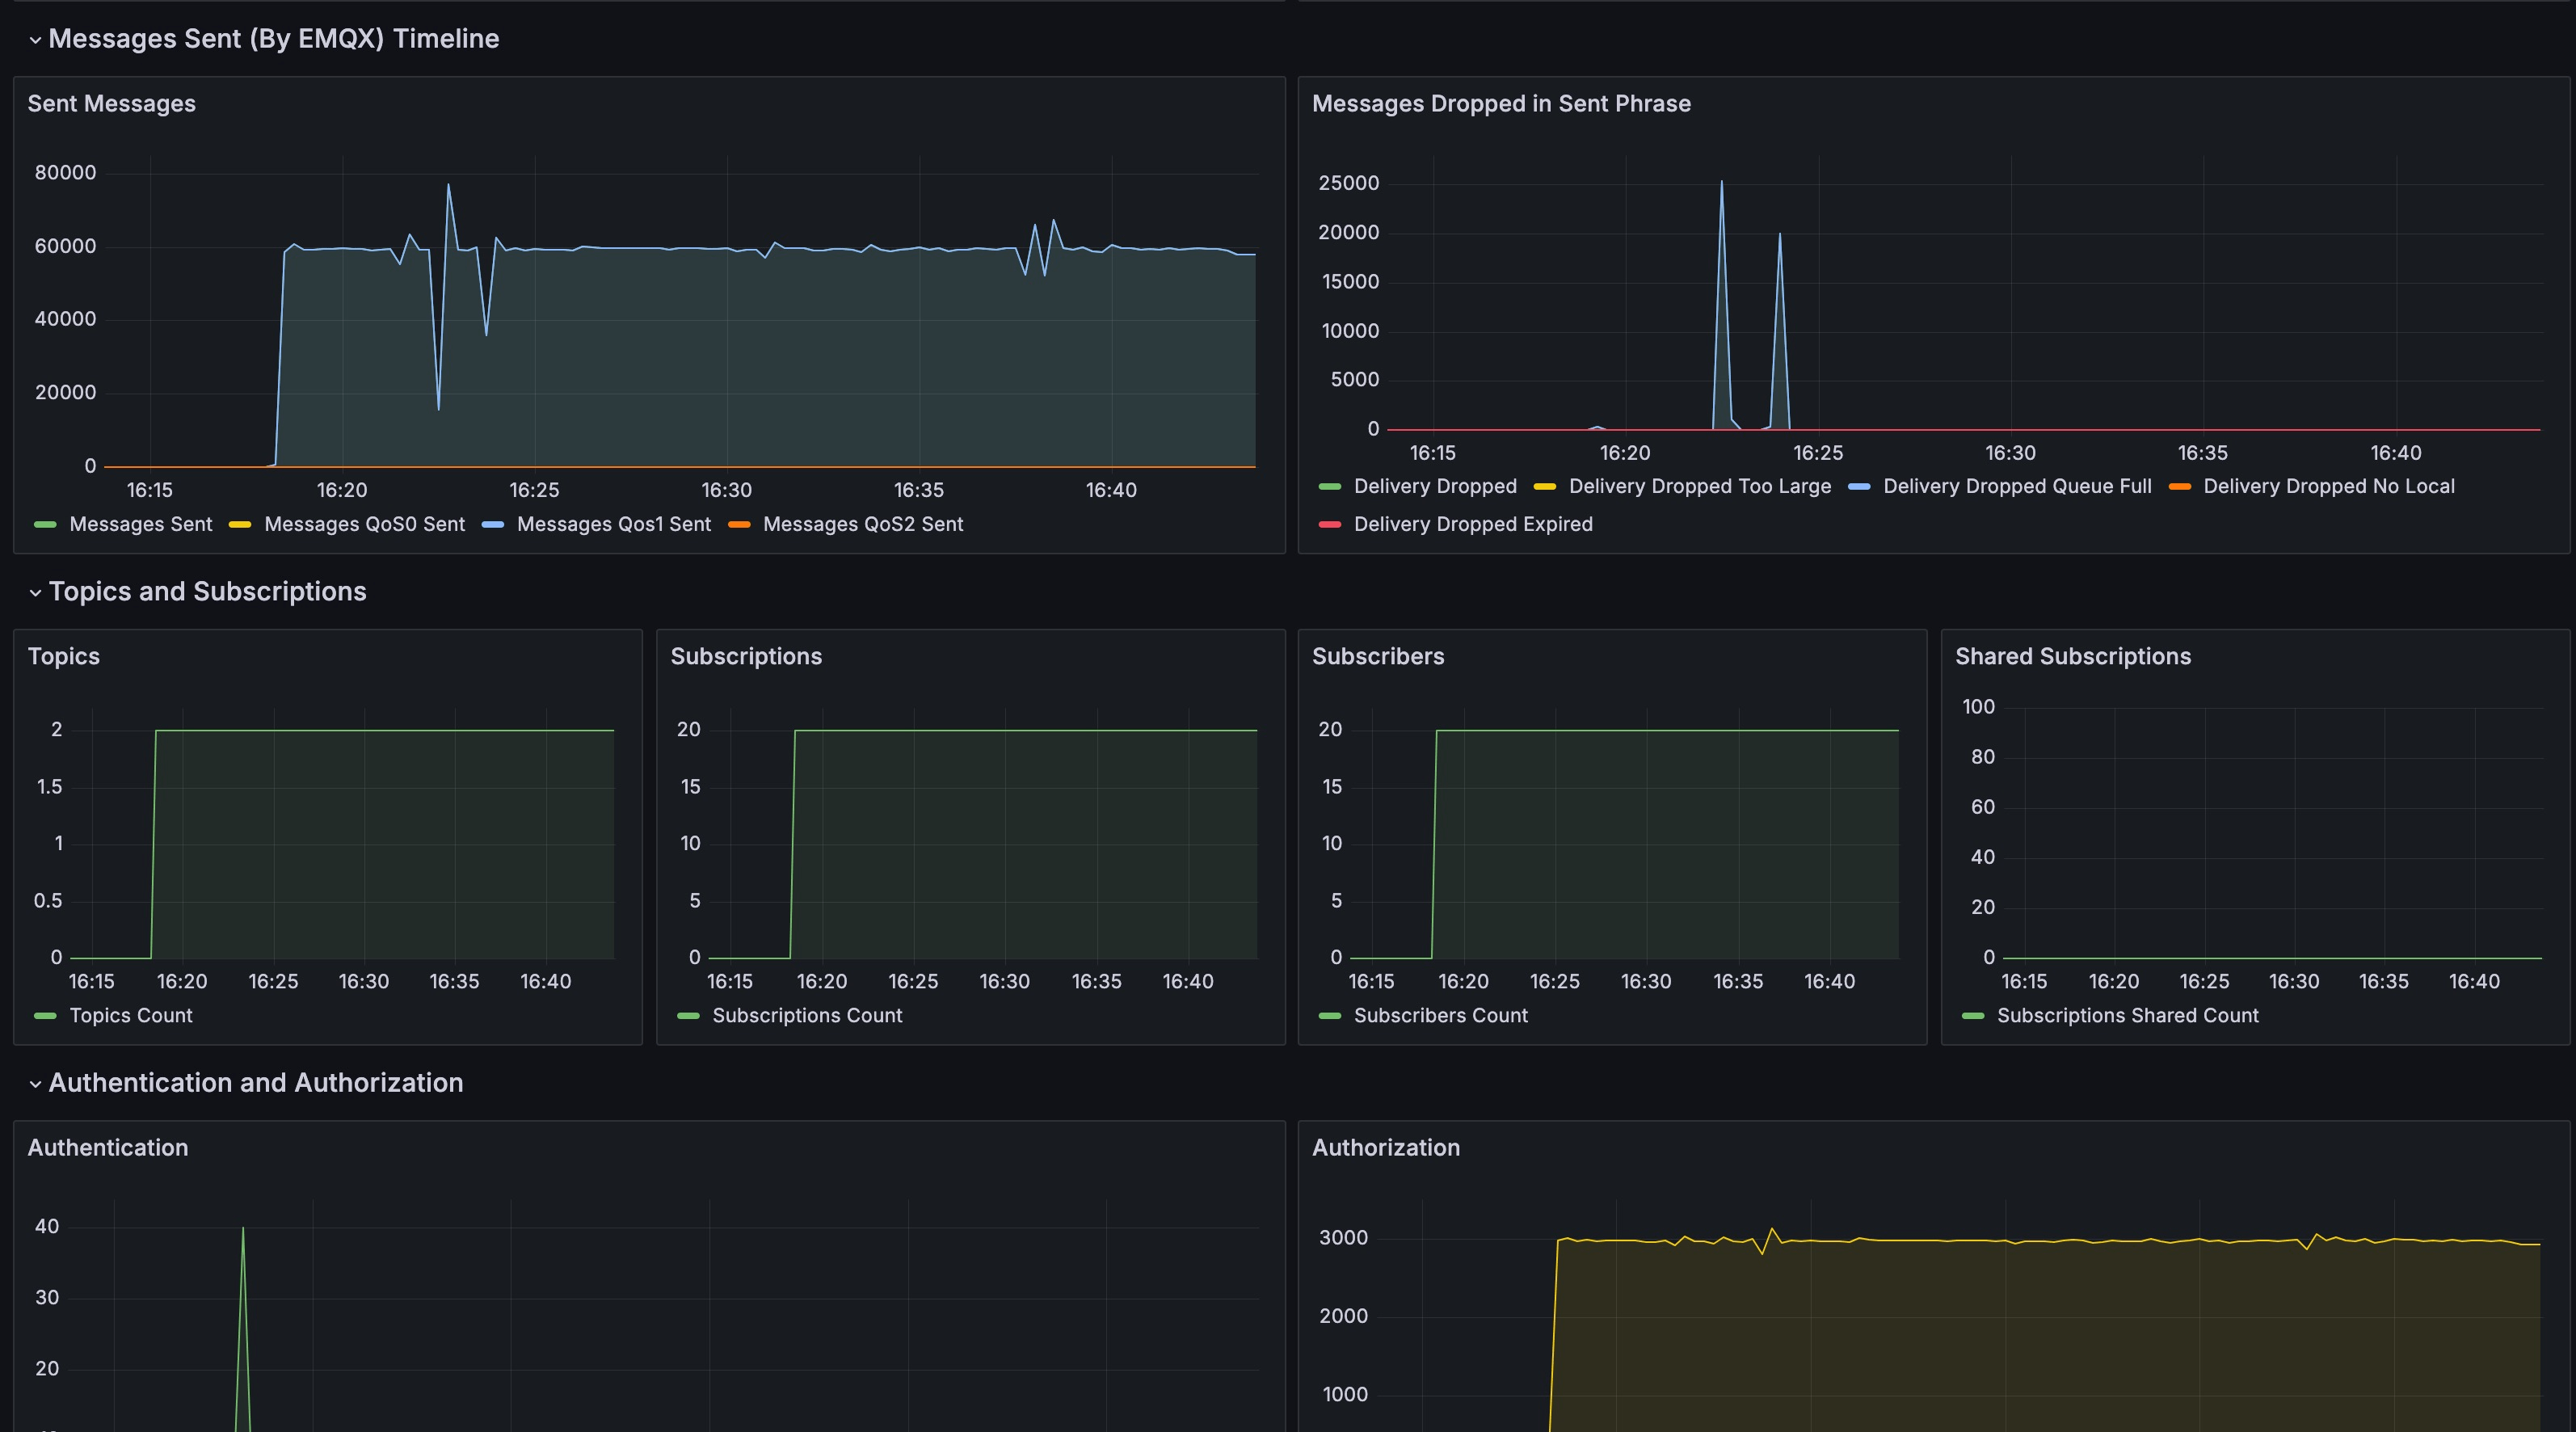
完成整套系统搭建并运行一段时间后,EMQX Cloud Prometheus 收集到的数据将展示在 Grafana 上,包括客户端数、订阅数、主题数、消息数、报文数等业务信息历史统计,可以查看每种指标对应的展示图表,某个时间点的详细信息。
Prometheus 跟踪您的 EMQX Cloud 部署的以下指标数据。
| 指标名 | 指标类型 | 指标说明 |
|---|---|---|
| deployment_emqx_connections_count | gauge | 集群连接数 |
| deployment_emqx_sessions_count | gauge | 总 session 数量 |
| deployment_emqx_messages_rate | gauge | 消息总速率 |
| deployment_emqx_messages_send_rate | gauge | 消息发送速率 |
| deployment_emqx_messages_receive_rate | gauge | 消息接收速率 |
| deployment_emqx_metrics_bytes_received | gauge | 接收消息字节数 |
| deployment_emqx_metrics_bytes_sent | gauge | 发送消息字节数 |
| deployment_emqx_metrics_retained_count | gauge | 保留消息数量 |
| deployment_emqx_metrics_messages_received | counter | 接收消息数量 |
| deployment_emqx_metrics_messages_qos0_received | counter | 接收到的 QoS=0 消息的数量 |
| deployment_emqx_metrics_messages_qos1_received | counter | 接收到的 QoS=1 消息的数量 |
| deployment_emqx_metrics_messages_qos2_received | counter | 接收到的 QoS=2 消息的数量 |
| deployment_emqx_metrics_messages_dropped | counter | 部署在接收阶段丢弃的消息数量 |
| deployment_emqx_metrics_messages_dropped_expired | counter | 因为过期而丢弃的消息数量 |
| deployment_emqx_metrics_messages_dropped_no_subscribers | counter | 因为没有订阅者而丢弃的消息数量 |
| deployment_emqx_metrics_messages_sent | counter | 发送消息数量 |
| deployment_emqx_metrics_messages_qos0_sent | counter | 发送的 QoS=0 消息的数量 |
| deployment_emqx_metrics_messages_qos1_sent | counter | 发送的 QoS=1 消息的数量 |
| deployment_emqx_metrics_messages_qos2_sent | counter | 发送的 QoS=2 消息的数量 |
| deployment_emqx_metrics_delivery_dropped | counter | 部署在投递阶段丢弃的消息数量 |
| deployment_emqx_metrics_delivery_dropped_too_large | counter | 因为过大而被丢弃的消息数量 |
| deployment_emqx_metrics_delivery_dropped_queue_full | counter | 因为队列满了而被丢弃的消息数量 |
| deployment_emqx_metrics_delivery_dropped_no_local | counter | 因为No local 而被丢弃的消息数量 |
| deployment_emqx_metrics_delivery_dropped_expired | counter | 因为过期而被丢弃的消息数量 |
| deployment_emqx_metrics_topics_count | gauge | 主题数量 |
| deployment_emqx_metrics_subscriptions_count | gauge | 订阅数量 |
| deployment_emqx_metrics_subscriptions_shared_count | gauge | 共享订阅数量 |
| deployment_emqx_metrics_subscribers_count | gauge | 订阅者数量 |
| deployment_emqx_metrics_authentication_success | counter | 认证成功数量 |
| deployment_emqx_metrics_authentication_failure | counter | 认证失败数量 |
| deployment_emqx_metrics_client_authorize | counter | 客户端鉴权数量 |
| deployment_emqx_metrics_authorization_allow | counter | 客户端鉴权成功数量 |
| deployment_emqx_metrics_authorization_deny | counter | 客户端鉴权拒接数量 |
| deployment_emqx_metrics_authorization_matched_allow | counter | 客户端鉴权成功匹配数量 |
| deployment_emqx_metrics_authorization_matched_deny | counter | 客户端鉴权拒绝匹配数量 |
| deployment_emqx_metrics_authorization_nomatch | counter | 客户端鉴权不匹配数量 |
| deployment_emqx_metrics_packets_received | counter | 已接收报文数 |
| deployment_emqx_metrics_packets_sent | counter | 已发送报文数 |
| deployment_emqx_metrics_packets_connect_received | counter | 已接收 CONNET 报文数 |
| deployment_emqx_metrics_packets_connack_sent | counter | 已发送 CONNACK 报文数 |
| deployment_emqx_metrics_packets_disconnect_received | counter | 已接收 DISCONNET 报文数 |
| deployment_emqx_metrics_packets_disconnect_sent | counter | 已发送 DISCONNET 报文数 |
| deployment_emqx_metrics_packets_publish_received | counter | 已接收 PUB 报文数 |
| deployment_emqx_metrics_packets_publish_sent | counter | 已发送 PUB 报文数 |
| deployment_emqx_metrics_packets_subscribe_received | counter | 已接收 SUB 报文数 |
| deployment_emqx_metrics_packets_unsubscribe_received | counter | 已接收 UNSUB 报文数 |
| deployment_emqx_metrics_packets_pingreq_received | counter | 已接收 PING 报文数 |
| deployment_emqx_metrics_packets_pingresp_sent | counter | 已发送 PING 报文数 |
| deployment_emqx_metrics_packets_auth_received | counter | 已接收 AUTH 报文数 |
| deployment_emqx_metrics_packets_auth_sent | counter | 已发送 AUTH 报文数 |
| deployment_emqx_rule_status | gauge | 规则状态 |
| deployment_emqx_rule_matched_rate | gauge | 匹配规则速率 |
| deployment_emqx_rule_matched_count | gauge | 匹配规则数量 |
| deployment_emqx_rule_action_execution_count | gauge | 执行规则数量 |