Monitoring
Monitoring shows platform tasks, AI usage, cluster status, connections, and latency. A deployment administrator must configure metric collection and Prometheus access before use; see Platform monitoring environment variables for connection settings.
Open Monitoring
Open Monitoring from the workspace sidebar. It defaults to Overview for the last 24 hours. The tabs appear in the following order; narrow screens use a dropdown menu.
| Tab | Contents and purpose |
|---|---|
| Overview | Cards and trends for task outcomes, current load, and model calls. |
| AI usage | Platform or device model and speech usage, estimated costs, and cumulative records. |
| Cluster | Nodes and instances, service health and readiness, and CPU and memory use. |
| Connections | Current devices and connections, and sessions with queued or running tasks. |
| Latency | Platform queues and stage durations, plus platform or device voice statistics and individual turns. |
The controls at the top right are:
- Time range: Platform metrics support the last hour, 24 hours, 7 days, and 30 days; Latency supports up to 7 days. Device AI usage also supports custom ranges.
- Select a device: Available only in AI usage and Latency. Select Platform usage to return to the platform view.
- Auto refresh and refresh button: Defaults to 30 seconds, with 15-second, 60-second, and off options. Refresh manually or hover over the button to see the update time. Longer periods may update less frequently than the selected interval.
- About these metrics: Click the question mark for the current tab's calculation rules.
Check Platform Overview
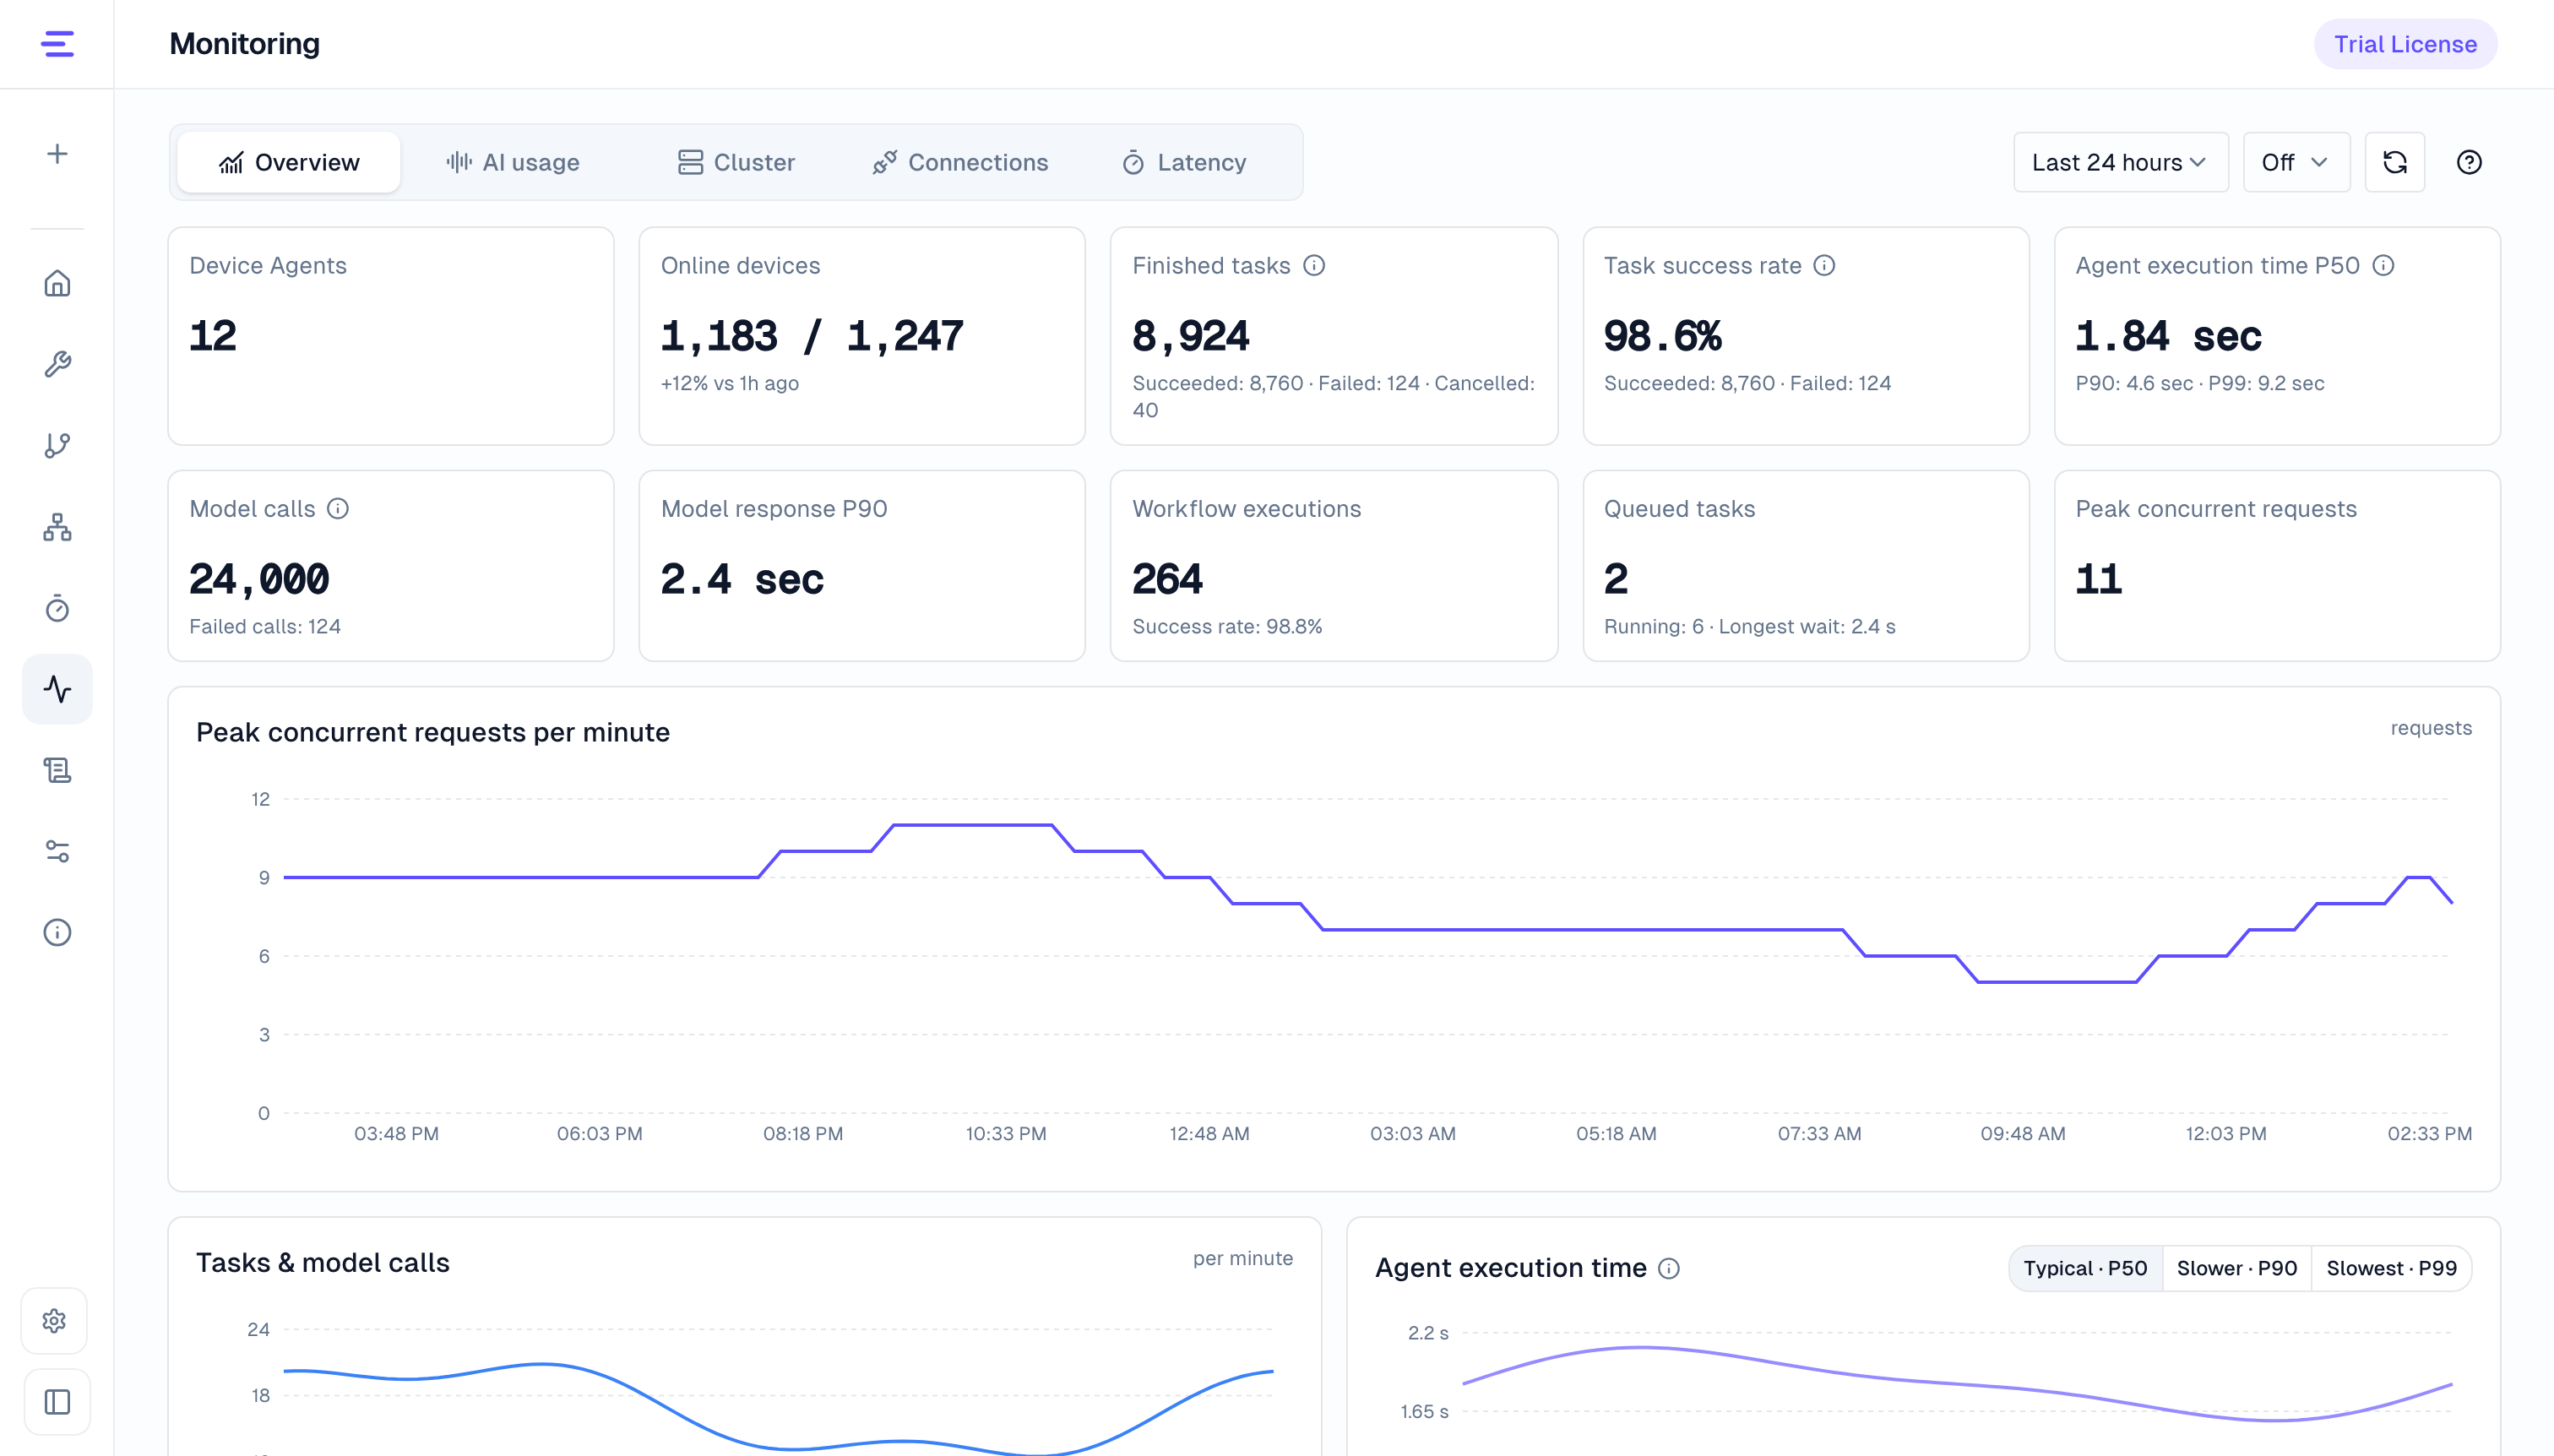
The cards distinguish current runtime state from statistics for the selected period:
| Metric | Meaning |
|---|---|
| Device Agents, Online devices | Current agent count and online devices / total devices. |
| Finished tasks | Successful, failed, and cancelled tasks in the selected period; excludes queued and running tasks. |
| Task success rate | Successful tasks ÷ (successful + failed), excluding cancellations. |
| Agent execution time P50 | Median execution duration for the selected period, with P90 and P99. Includes models and tools; excludes pre-execution queues and device transmission. |
| Model calls | Calls and failures in the selected period; one task can call a model several times. |
| Model response P90 | P90 duration of individual model calls over the last 5 minutes, independent of the selected time range. |
| Workflow executions | Executions started in the selected period, excluding skipped runs, with the success rate of finished executions. |
| Queued tasks | Current queue size, with running task count and oldest waiting time. |
| Peak concurrent requests | The highest number of simultaneously executing requests in the selected period, excluding pre-execution queues. |
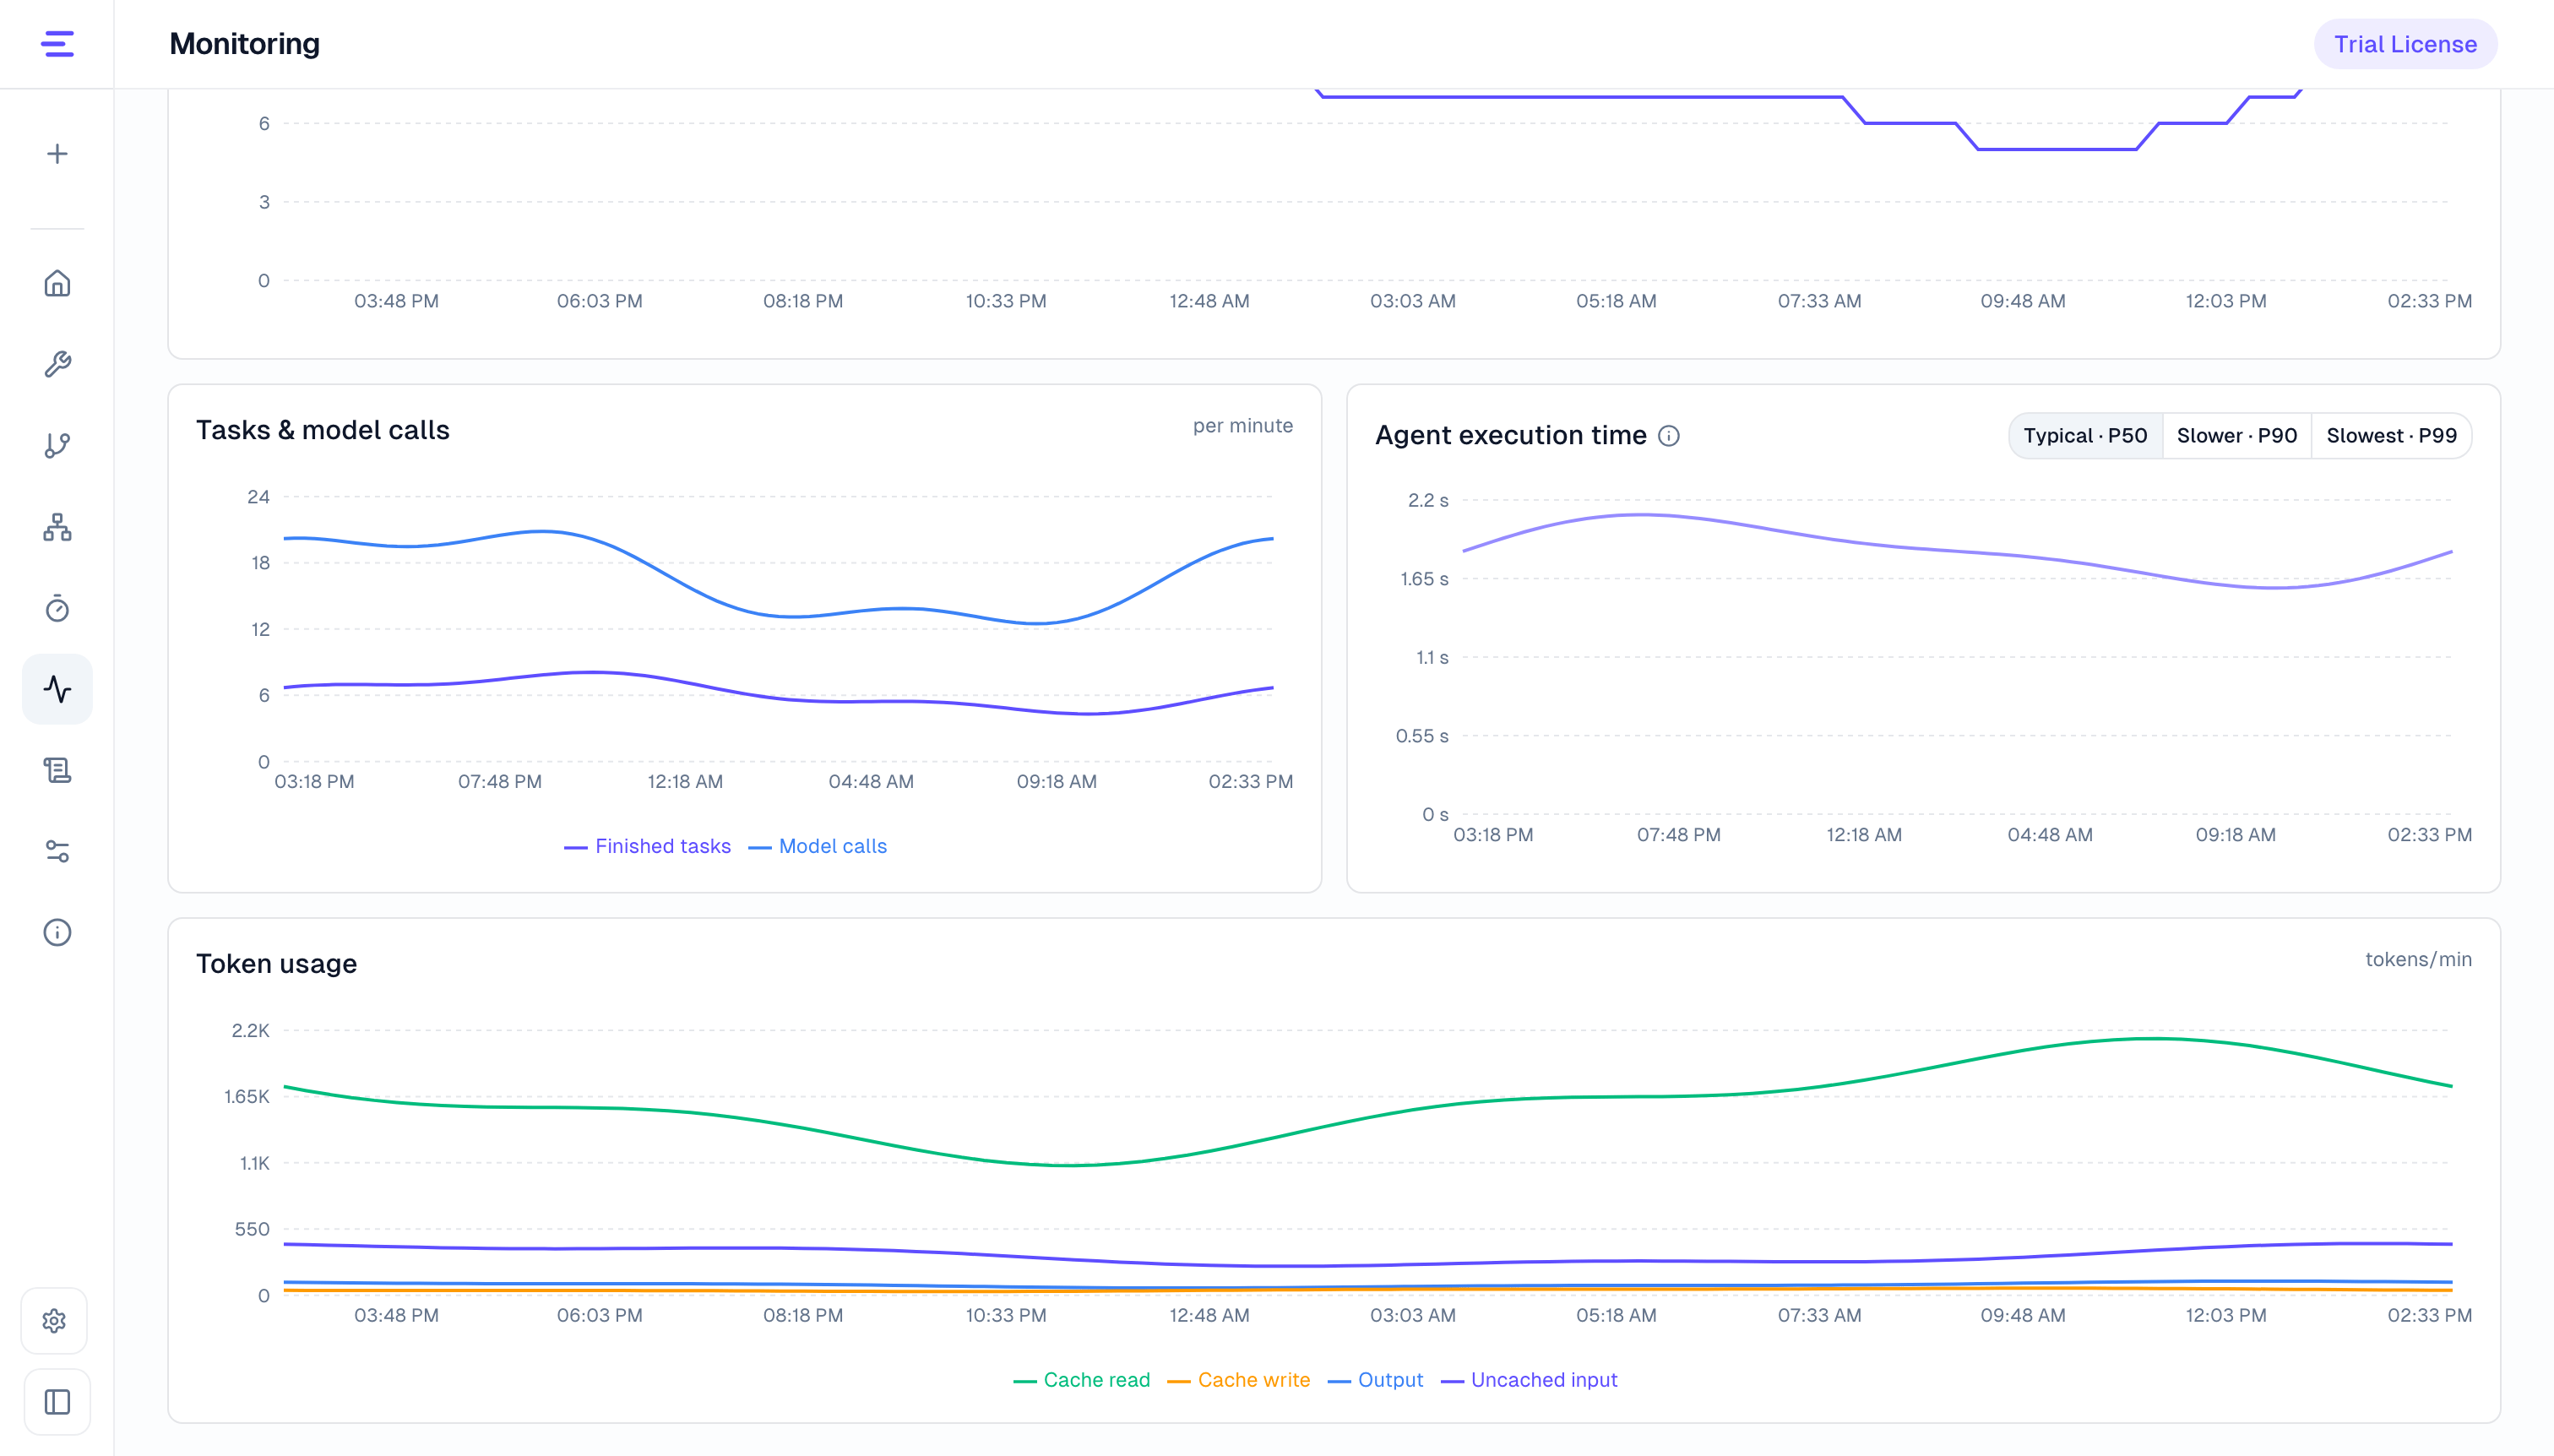
Charts below show concurrency, tasks and model calls, execution duration, and tokens. The duration chart switches between Typical · P50, Slower · P90, and Slowest · P99: approximately 50%, 90%, and 99% of samples finish within those durations. Chart points represent interval statistics.
Check AI Usage
In AI usage, view Platform usage or select a device by ID or name. Cost and cumulative cards appear first, followed by model and speech usage and breakdowns by provider and model. Selecting a device adds combined filters for call type, model, provider, source, and outcome, with custom ranges up to 31 days. Custom ranges require manual refresh.
LLM tokens include uncached input, output, cache reads, and cache writes. Input cache hit rate is cache reads divided by all input tokens. Speech recognition (min) measures audio duration; Speech synthesis (chars) measures synthesized text and also shows audio duration. Breakdown tables show call counts and failure rates by provider and model. Period usage is grouped by call completion time. Calls with incomplete usage contribute only the known portion and show a notice.
Device usage and individual voice records accumulate after collection is enabled; uncollected history cannot be recovered.
With Device AI Credits enabled, device usage shows the used amount and remaining credits. Balances and monitoring estimates use separate calculations; see Device balance for the actual balance.
Check Costs and Cumulative Usage
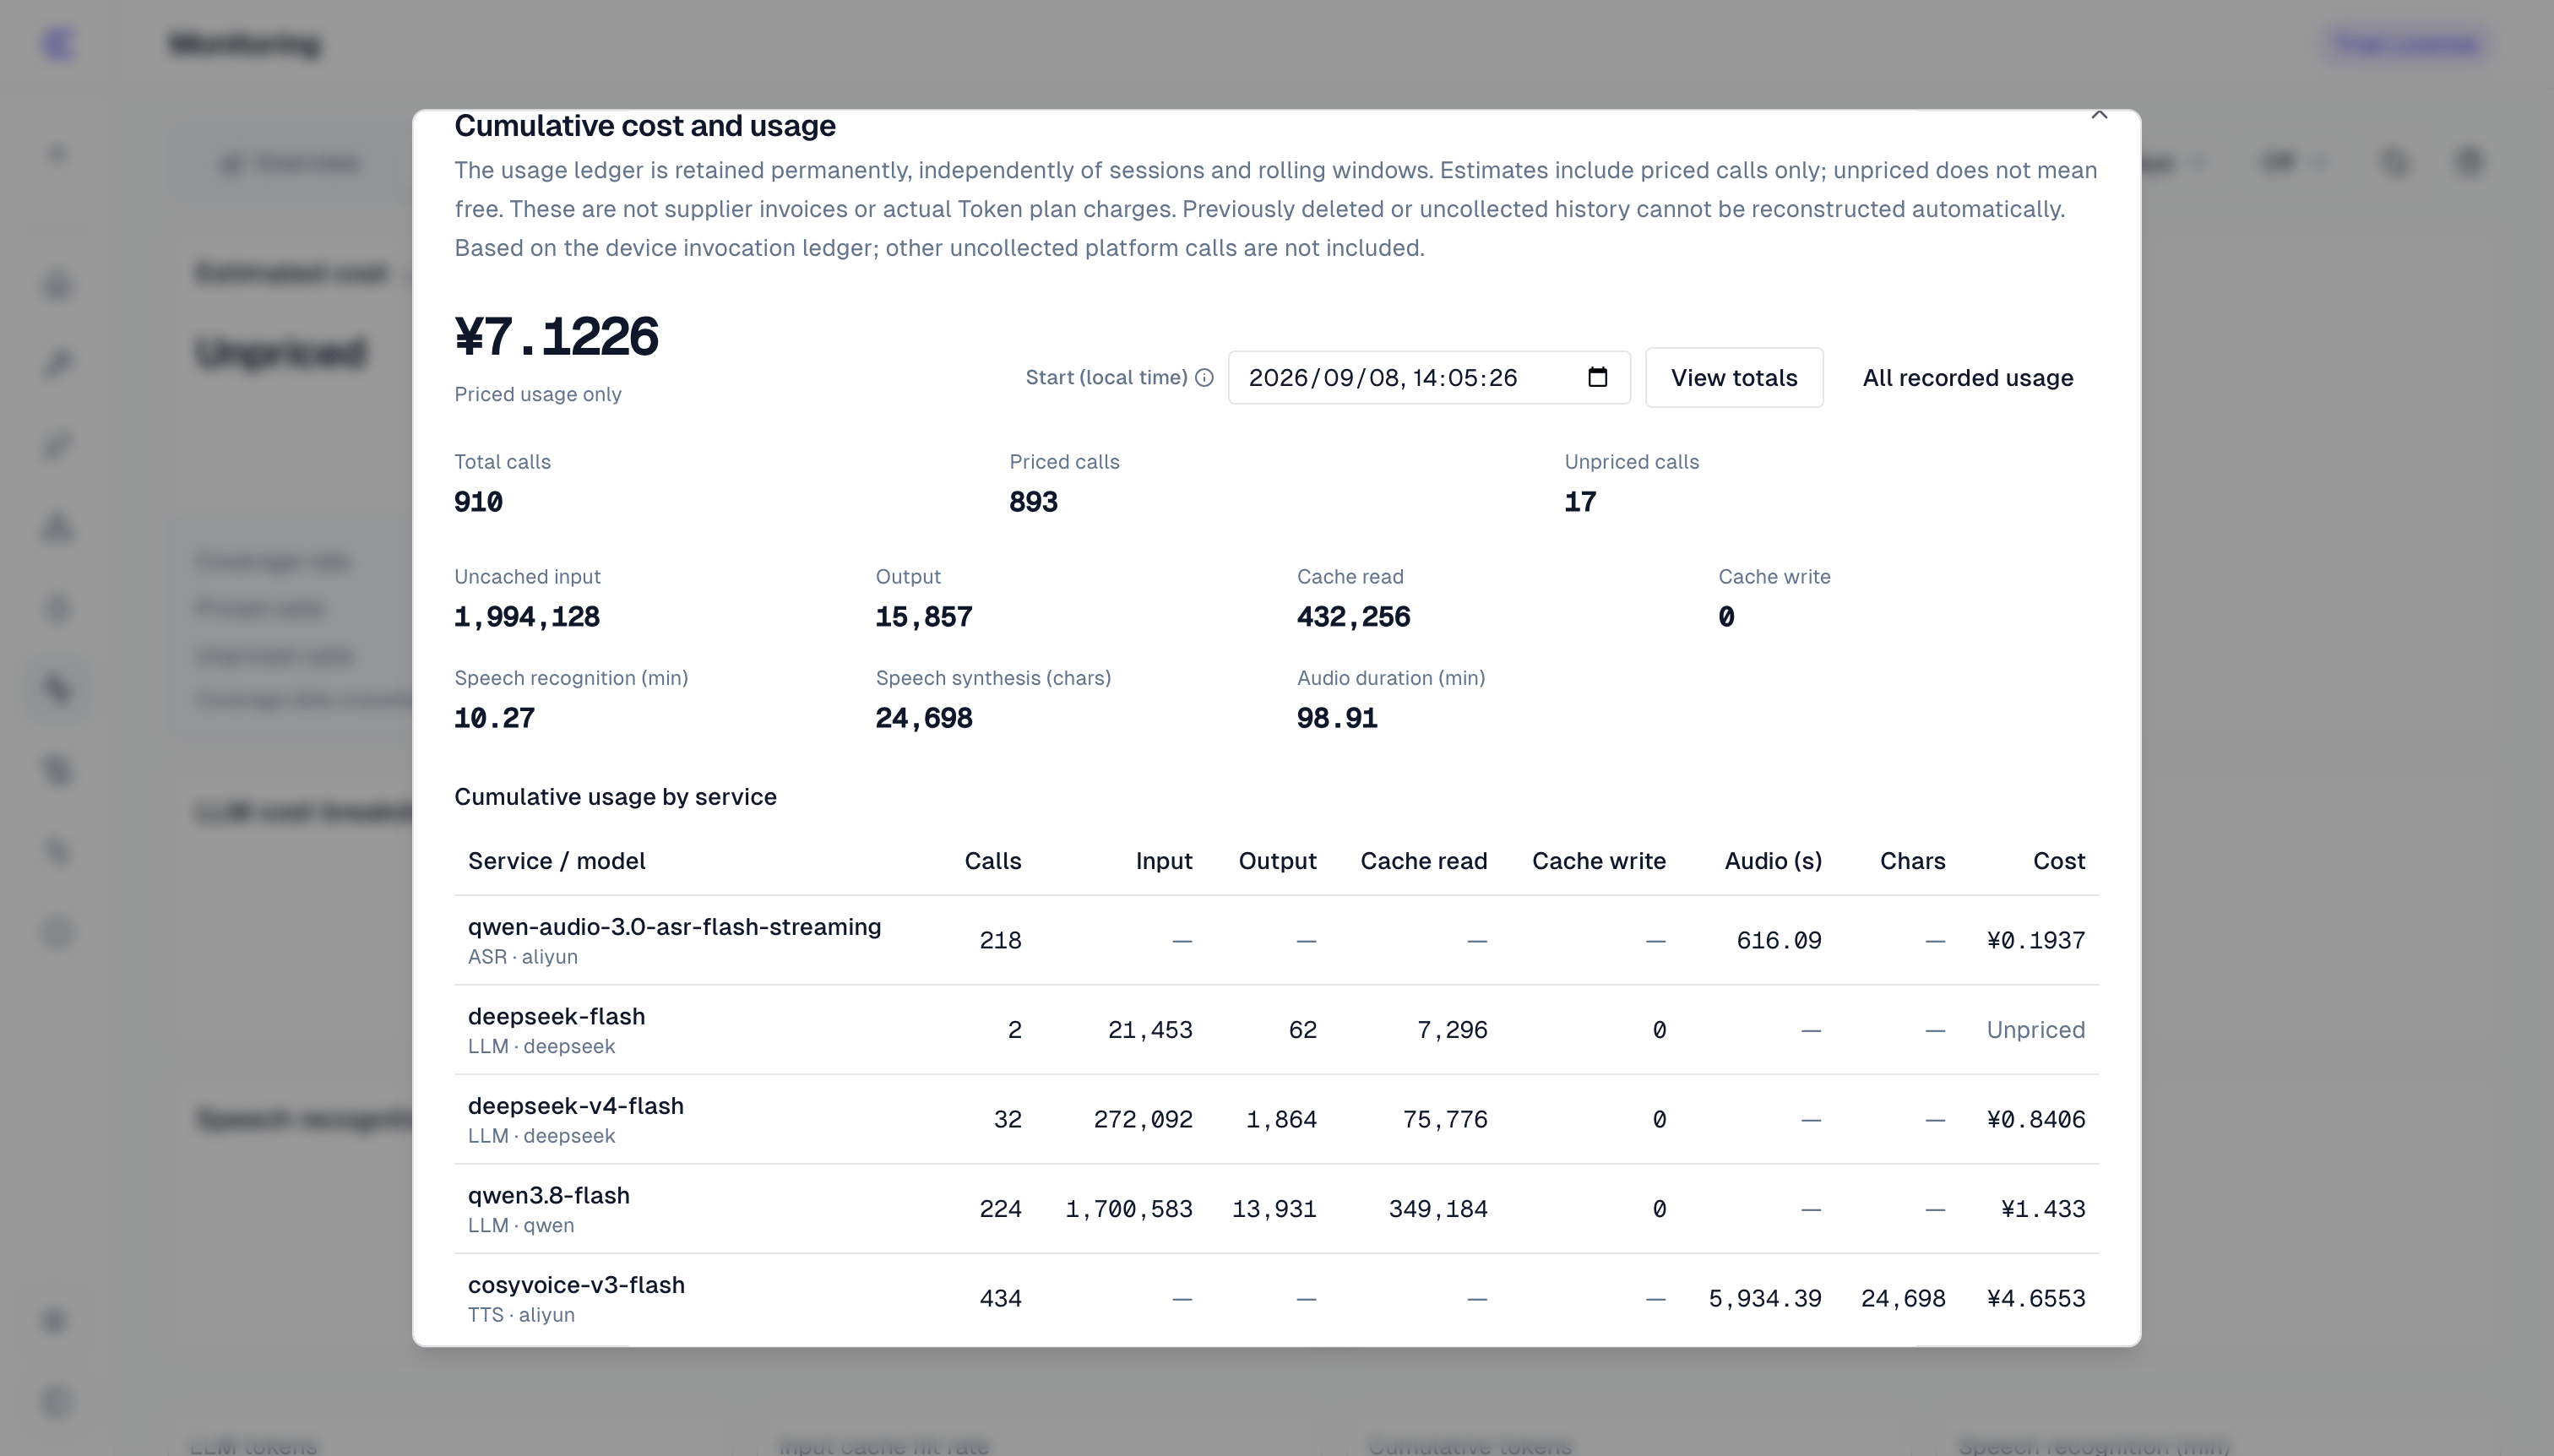
Estimated cost uses recorded usage and the price at call time, excluding discounts and trial credits. Actual charges follow the provider's bill. Cost coverage shows priced and unpriced calls; Coverage rate is priced calls divided by all calls. Unpriced means a price is unavailable, not that the call was free. Currencies appear separately.
Cumulative cost and Cumulative tokens summarize recorded device calls for the platform or one device. Their range is independent of the page's time window and call filters, excluding uncollected history and platform calls outside device records.
Click View details, enter Start (local time), and click View totals to count subsequent usage by call start time. Leave the start blank or select All recorded usage to count from the first record. The page link saves the start time; clearing conversations does not reset cumulative totals.
Check Cluster Status
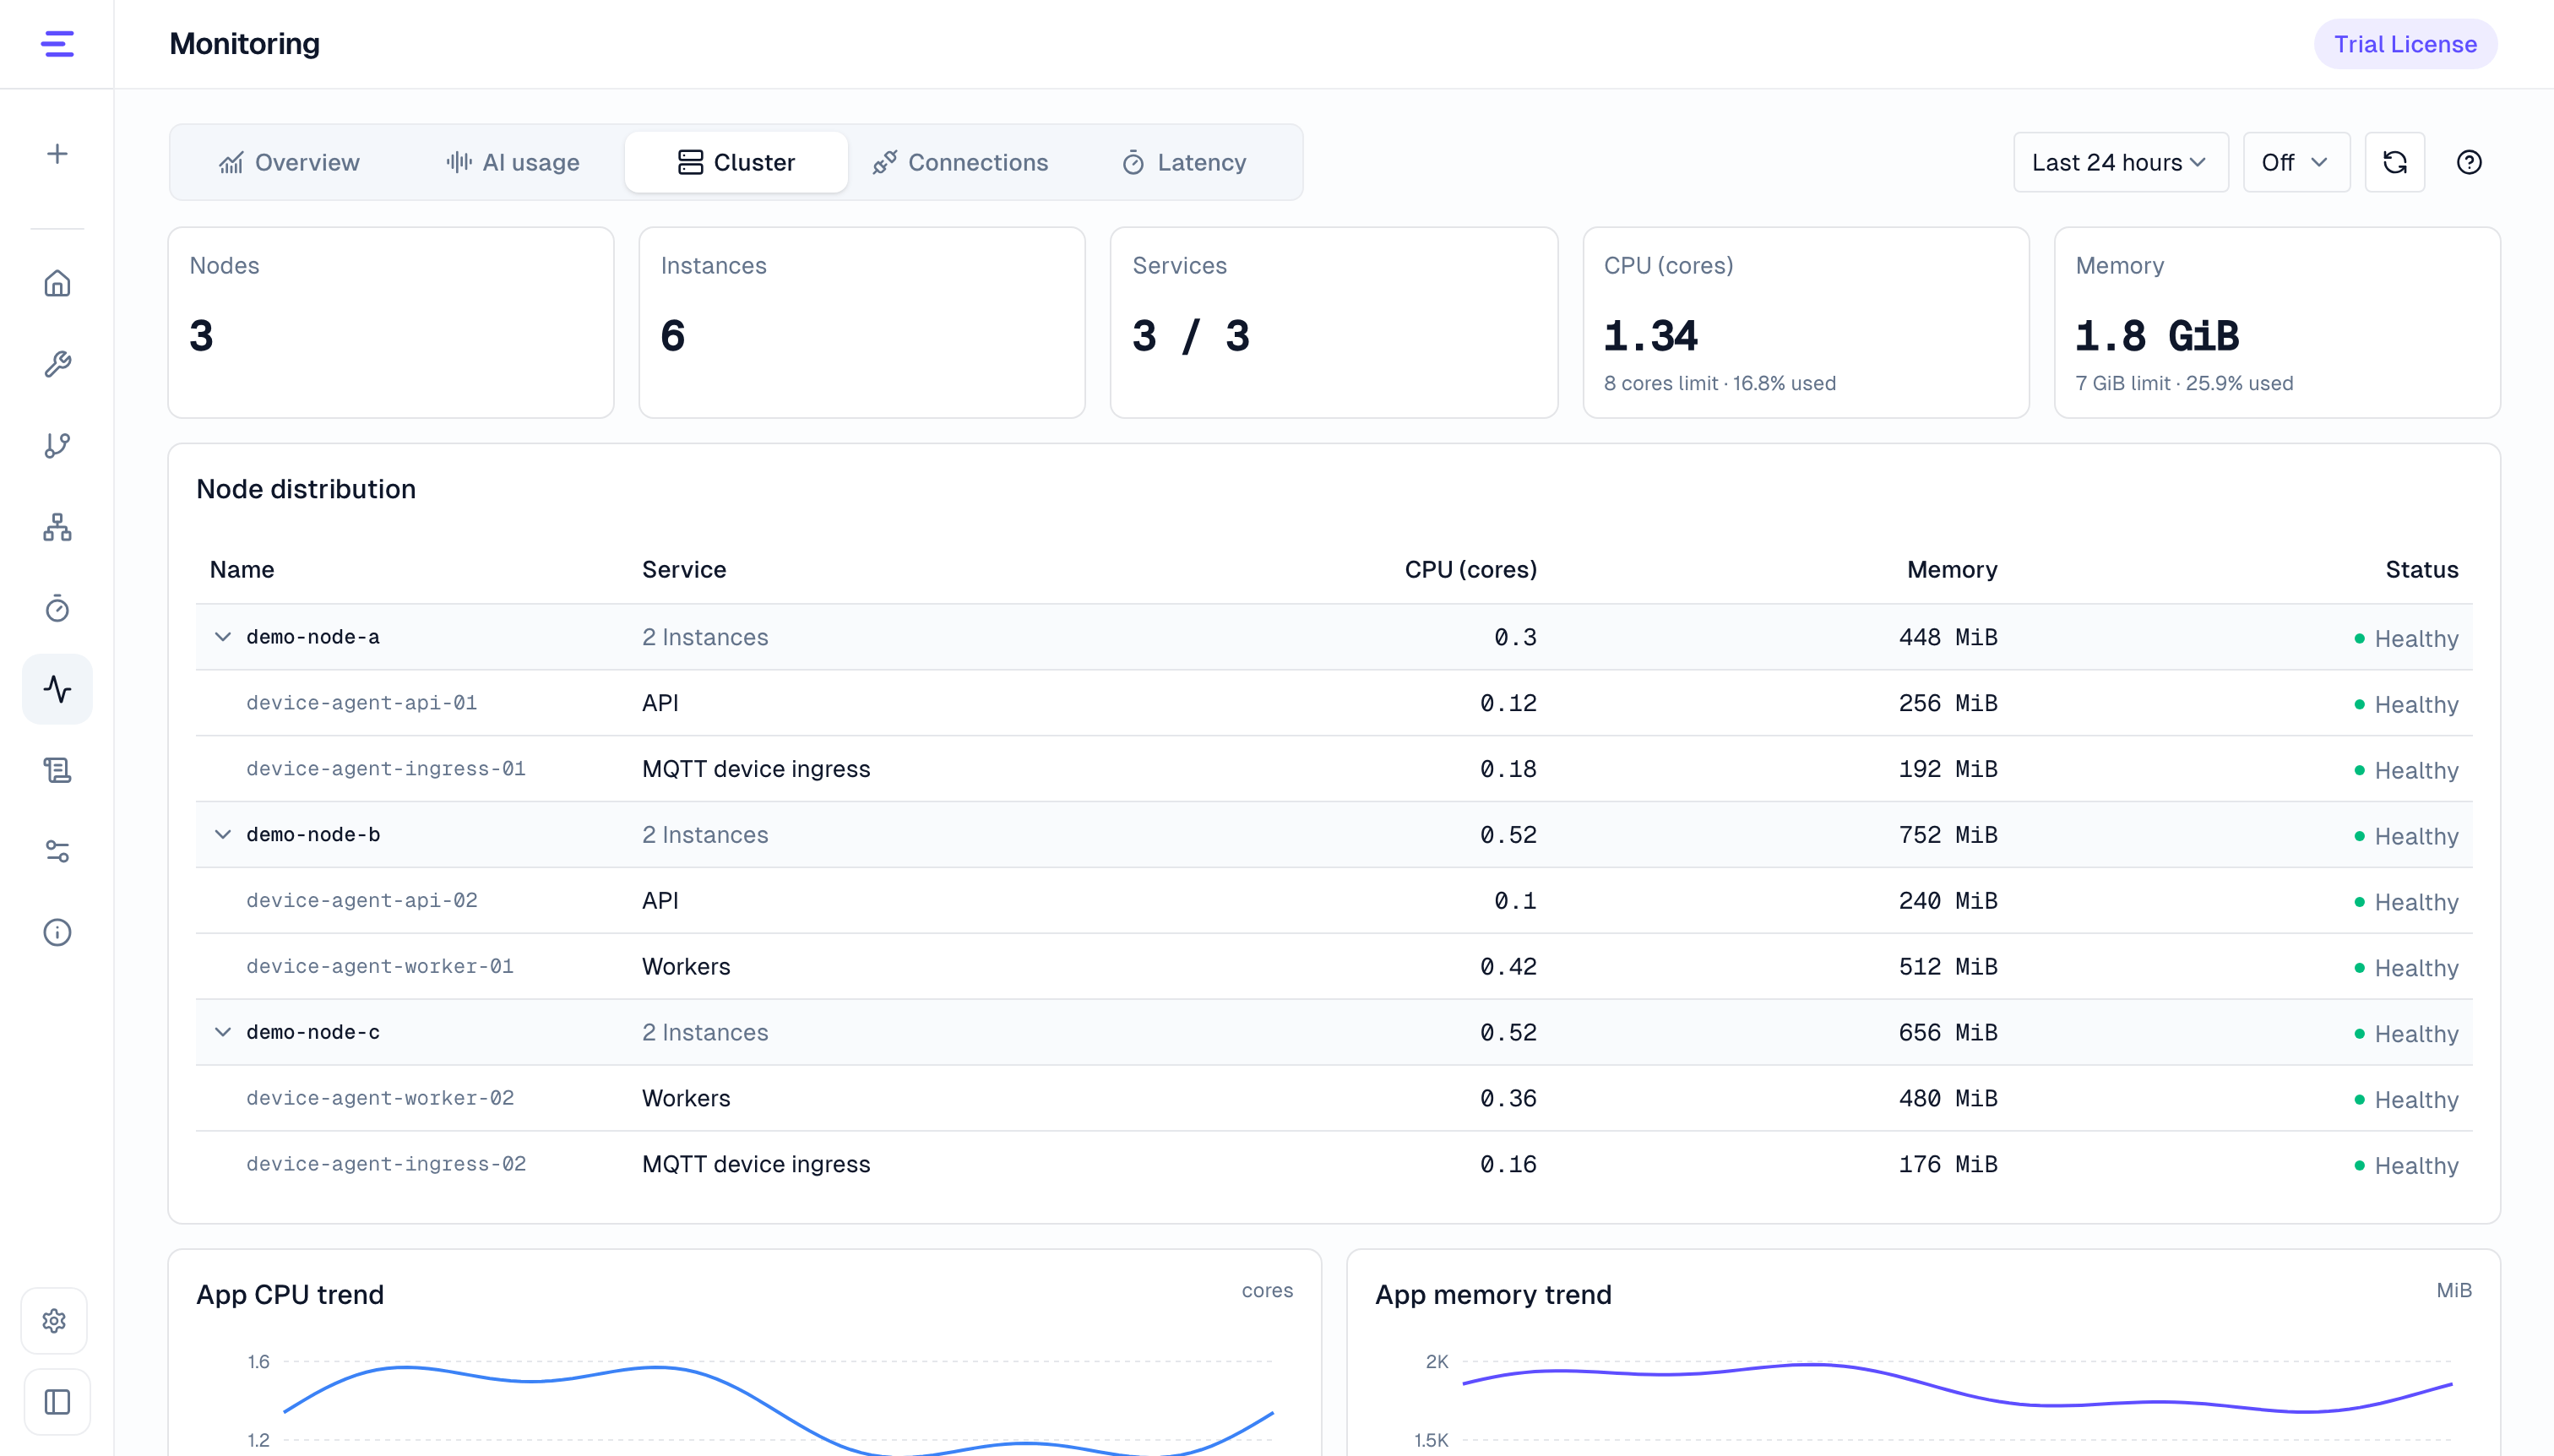
Cluster shows node, instance, and healthy service counts at the top. Services shows healthy service types / total types; all instances of a type must be healthy for that type to count. Expand Node distribution to check individual instances.
| Status | Meaning and action |
|---|---|
| Healthy | Collection succeeded and the instance is ready. |
| Not ready | The instance cannot handle work yet; check startup and dependencies if this persists. |
| Collection failed | Instance status is unknown; check the instance, collection configuration, and network. |
CPU is measured in cores. CPU and memory cover only the platform application, with node rows aggregating their instances. Usage percentages appear when resource limits are available. Use deployment monitoring for server and database load.
Check Connections and Sessions
The four Connections cards show:
| Metric | Meaning |
|---|---|
| Online devices | Devices currently online. |
| Response connections | Currently open streams delivering conversation results. |
| Voice connections | Current voice connections. |
| Active sessions | Sessions with queued or running tasks. |
Counts can overlap and should not be added together. Charts below show online device and connection trends. The active session list shows up to the earliest 50 sessions; the card shows the total. Use queued and running counts and the oldest task time to identify backlogs. Last activity is the task update time. Sessions leave the list when all their tasks finish; see Logs for history.
Investigate Latency
The upper part of Latency shows platform statistics: Queued tasks shows the current queue size and oldest waiting time; Outdated queues counts sessions whose first queued task uses an older configuration; Model call failure rate is failed calls divided by all model calls in the selected period. For persistent queues, check License, cluster status, and logs.
Duration by stage lists P50, P90, P99, and sample counts for agent execution, model response, first model response, ASR, and TTS. See Overview for percentile definitions. The duration charts below also switch between P50, P90, and P99. ASR duration includes speaking time; click View logs for errors and execution records.
Voice statistics appear below. Voice turns counts interactions in the selected period. First answer audio and Audio sending complete measure from final speech recognition to the server sending the first answer audio and finishing all answer audio, respectively, excluding device playback delay. Duration cards show P50, with P90 and sample counts; Answer completion rate excludes cancelled turns. First filler audio in the trend chart helps establish whether feedback was sent first.
The platform view shows Slow devices · Top 10. Click a device or select one at the top to switch voice statistics to that device and show Individual turns; the platform metrics above remain unchanged. Click a question to open details: Full answer shows the question, answer, queue, first answer text, model duration, tokens, and tool calls; Conversation shows the surrounding conversation.
Browse with Older turns and Back to latest. Per-turn metrics are kept for 7 days; questions, answers, and tool details may be unavailable after the original conversation is cleared.
Common Questions
| Symptom | What to do |
|---|---|
A card shows — or a chart is empty | Check for records in the selected period. Ask an administrator to check collection if this persists. Other available metrics remain usable. |
| Data is stale | Refresh and check the update time; a failed refresh may leave the previous result visible. |
| Voice statistics are empty or Not collected | Check the device, voice activity within the last 7 days, and collection status. |
| Cumulative values differ from period usage | Check device scope, start time, and calculation rules. |