Diagnose
The Diagnose module provides some debugging tools to help users debug and locate errors and issues in usage.
- WebSocket Client: Use the WebSocket client on the page for quick connection and publish-subscribe debugging.
- Topic Monitoring: Monitor and view message incoming, outgoing, and dropped data based on topics.
- Slow Subscriptions: Enable slow subscription statistics to view subscriptions on the page that consume more than a set threshold of time for the entire flow of message transmission based on client ID.
- Log Trace: Real-time filtering of logs for a specific client, Topic, or IP, which can be viewed or downloaded on the page.
WebSocket Client
Click on WebSocket Client under the Diagnose menu on the left to go to the WebSocket Client page. The WebSocket Client page provides a simple but effective MQTT testing tool that includes connect, subscribe, and publish functionality for quick debugging of the client's connect, publish, and subscribe functionality, as well as the ability to view your own sent and received message data. Multiple WebSocket connections can be added by clicking the + button at the top of the page; the connection status and sent and received data for all connections will be cleared when the page is refreshed.

Topic Metrics
Click on Topic Monitoring under the Diagnose menu on the left to go to the Topic Metrics page. In Topic Monitoring, you can click the Create button in the top right corner of the page, enter the topic you want to monitor and click Add to create a new topic metric statistic. Once created successfully, you can view the number and rate of message incoming, outgoing and dropped for that topic by topic, as well as view the data for each QoS for the above metrics in the details. Click on the Reset button to reset the existing statistics for a topic. The monitoring list can be displayed by clicking on a statistical indicator in the header of the table to sort it in order or in reverse order, as required.
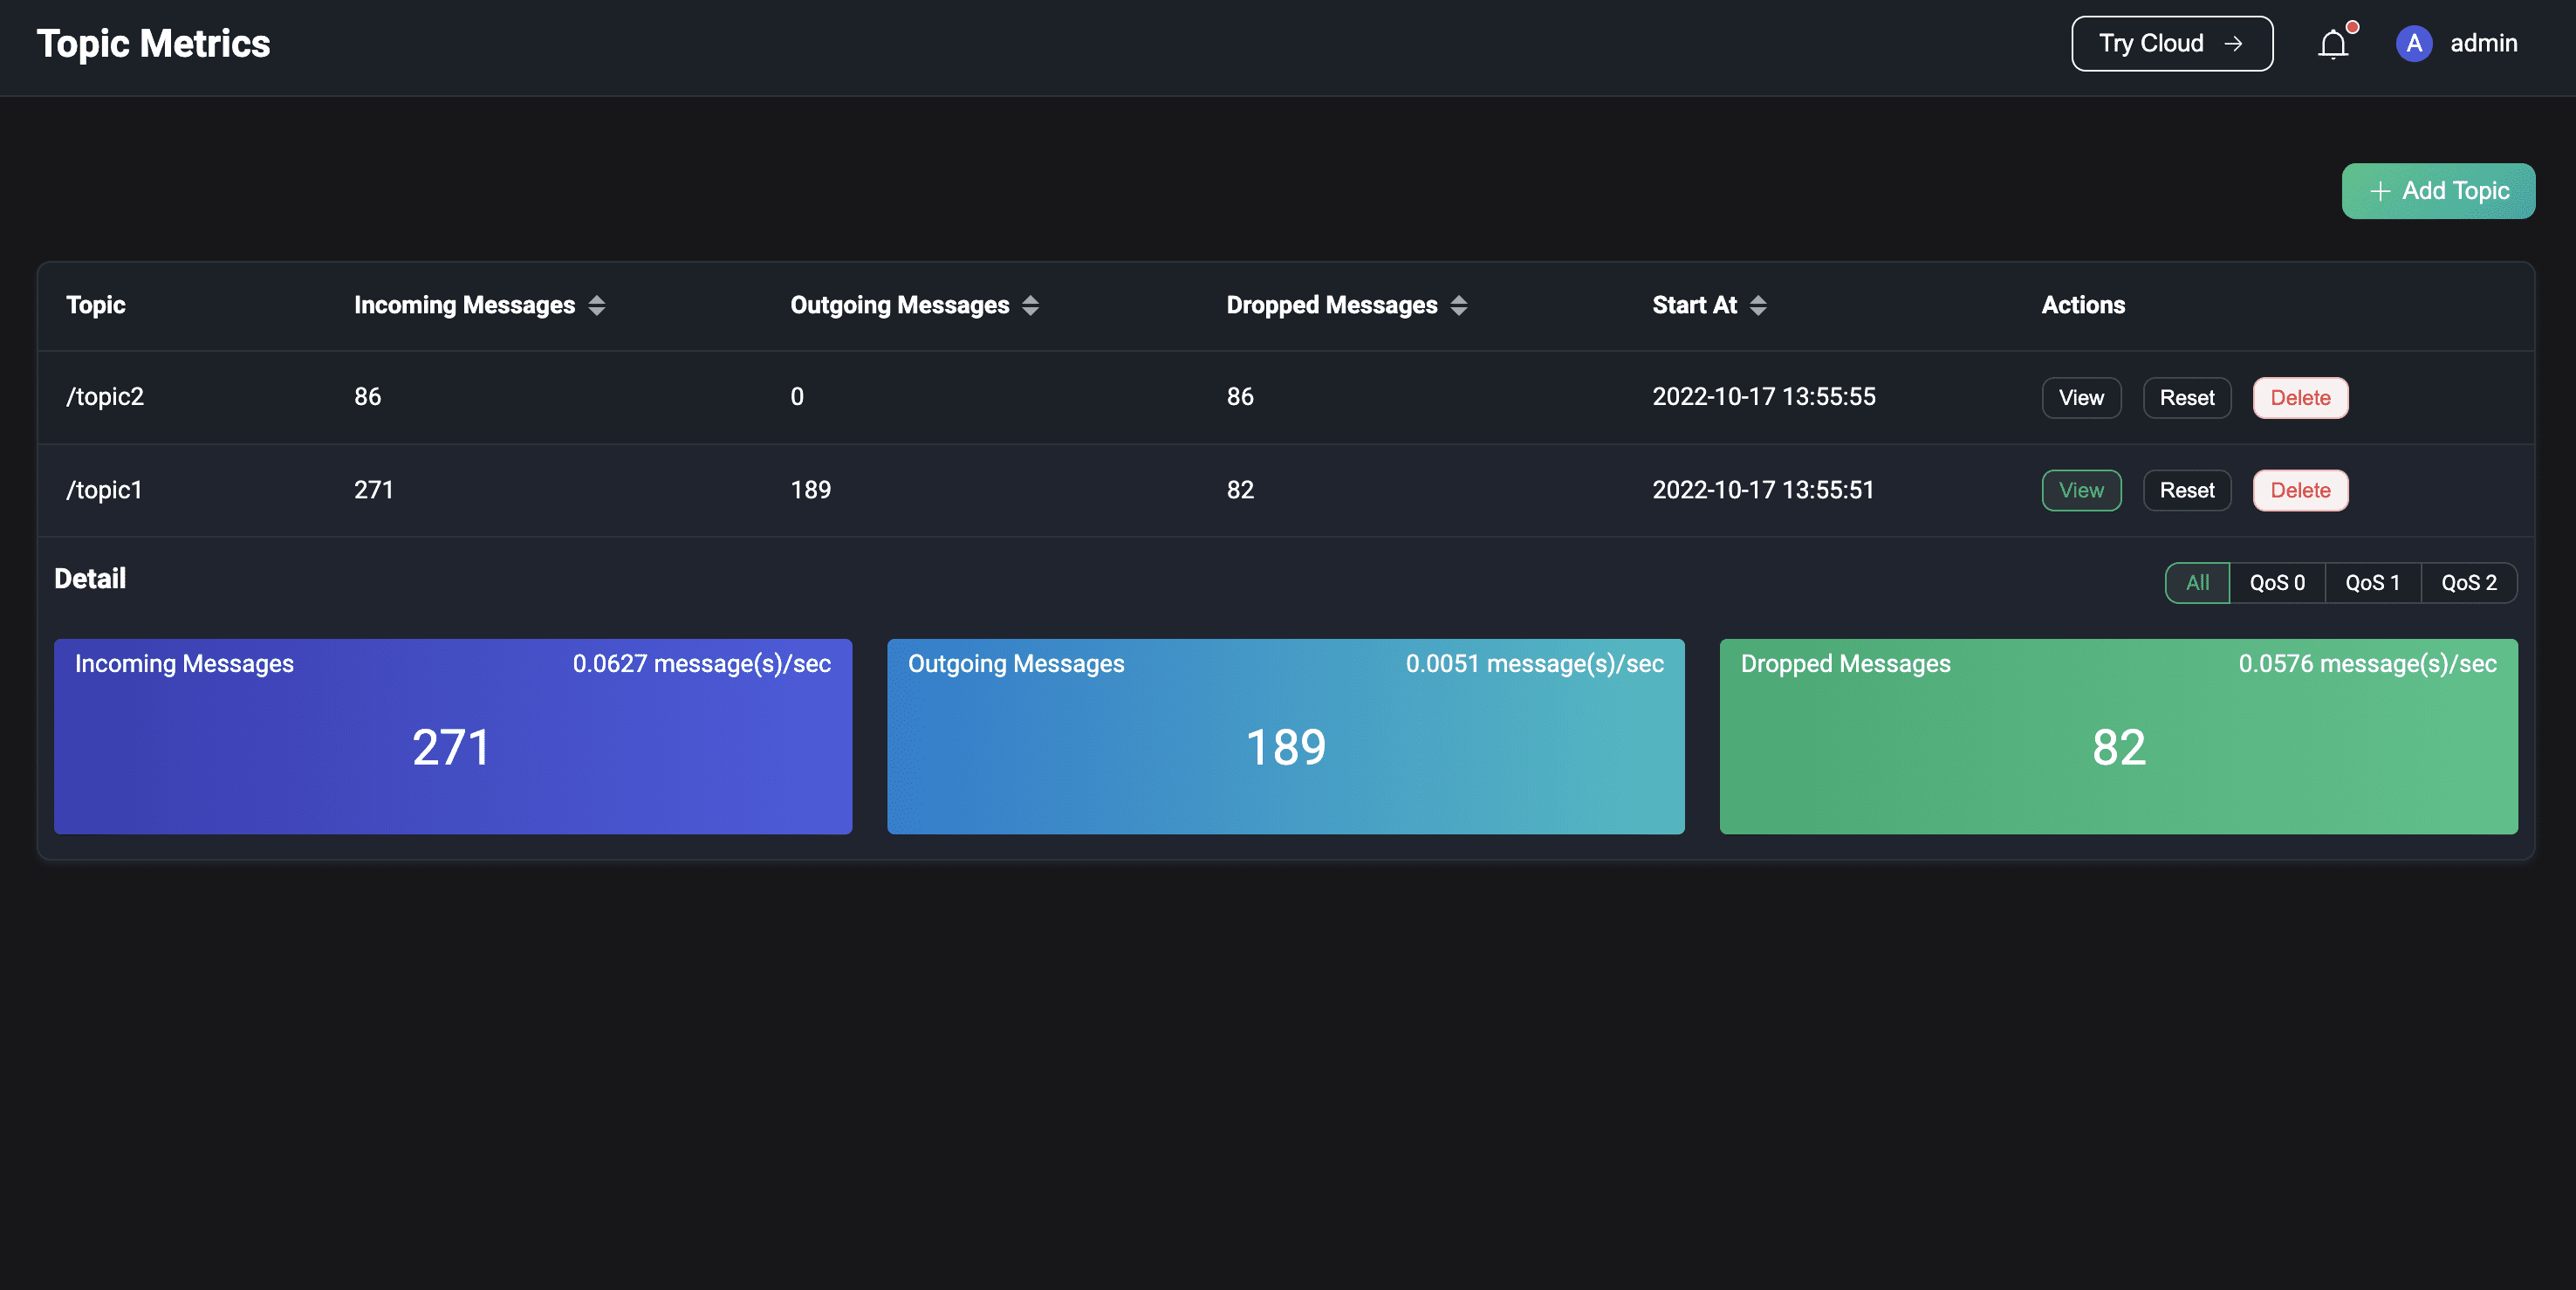
For overall performance reasons, only topic names are currently supported for topic statistics, i.e. topic filters with + or # wildcards, e.g. a/+ etc. are not supported.
Slow Subscriptions
Click on Slow Subscriptions under the Diagnose menu on the left to go to the Slow Subscriptions page. To use slow subscription statistics, you need to enable this feature after setting up the base settings for slow subscriptions. A description of the individual configuration items can be found in slow subscriptions. When enabled, messages whose time consumption for the full flow of message delivery exceeds the configured time delay threshold will participate in the statistics. By default, the statistics list shows the subscriber and subject information in descending order of latency. Clicking on the Client ID will redirect you to the subscriber's connection details page, where you can view the connection information to investigate the cause of the slow subscription.

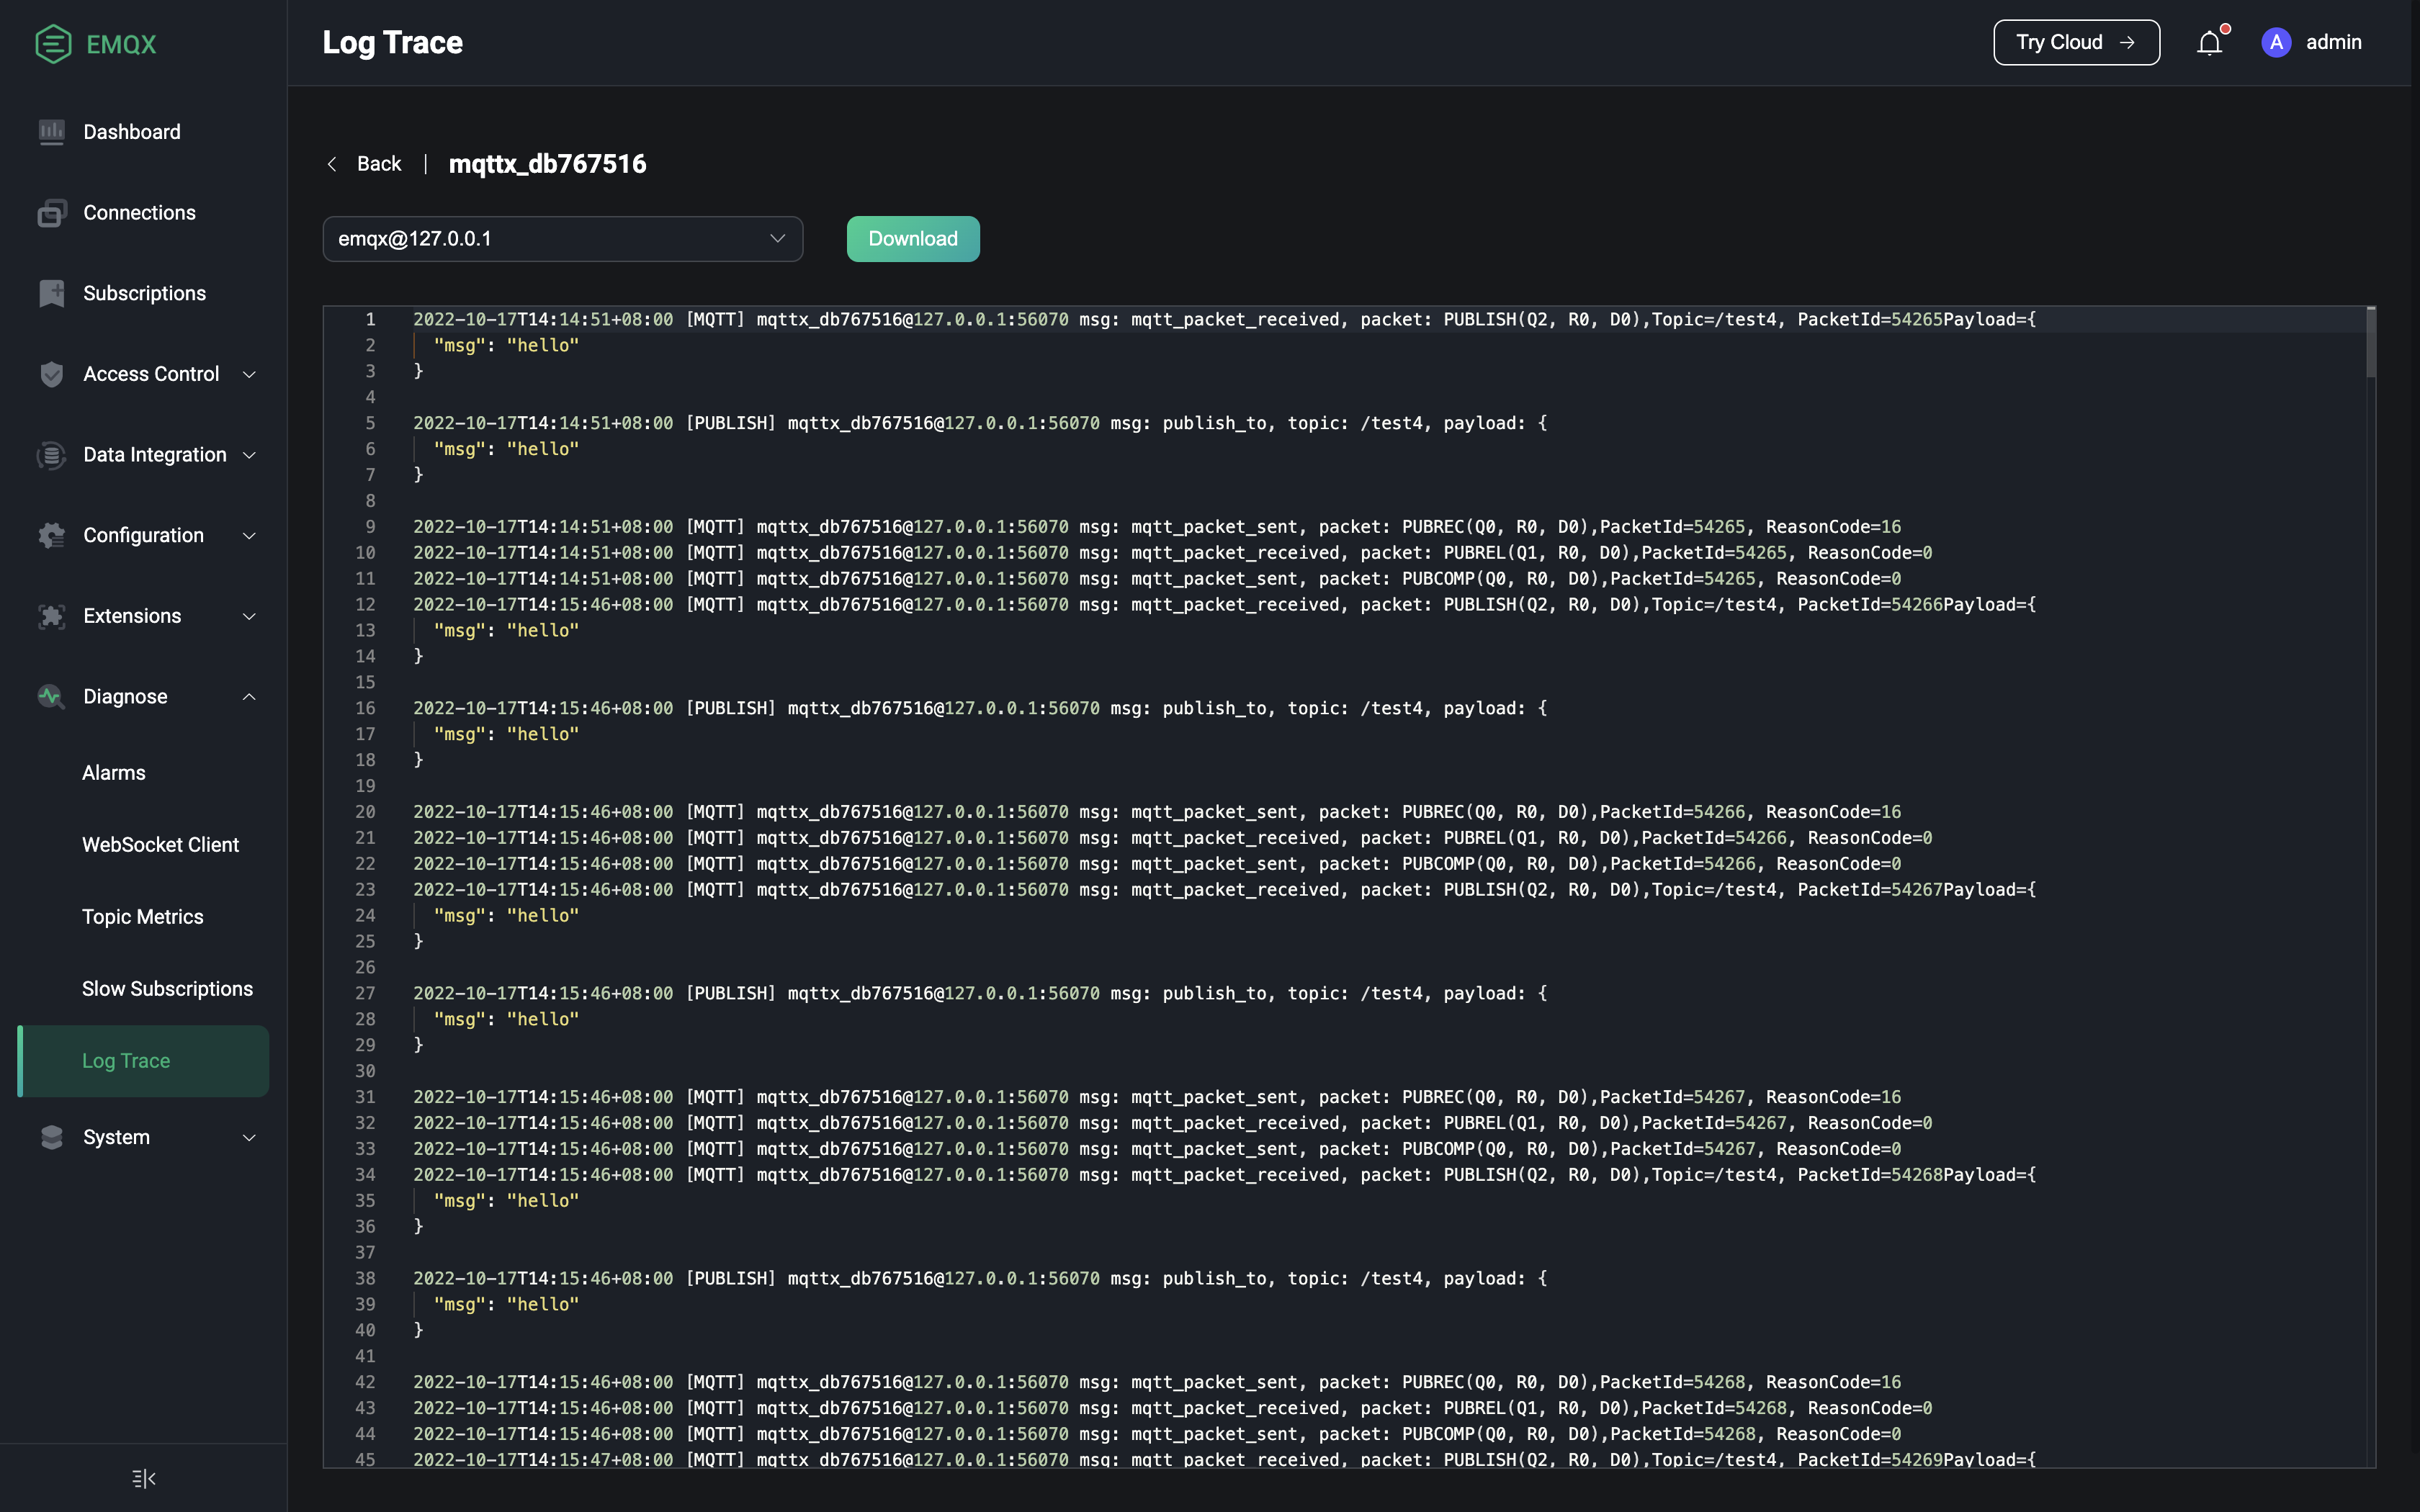
Log Trace
Click on Log Trace under the Diagnose menu on the left to go to the Log Trace page. If you need to filter logs in real time for a specific client, Topic or IP for debugging and troubleshooting purposes, you can use the Log Trace feature. Click on the Create button in the top right corner of the page and select the object you want to trace, where the client ID and IP need to be entered exactly and the Topic supports wildcard matching in addition to exact matching. You can also manually stop a trace in progress in the list; stopped traces can be deleted from the list.

You can see all current traces in the list and view or download the logs of a particular trace. In a clustered environment, clicking the Download button in the list downloads the logs of the node corresponding to the Dashboard; clicking the View button allows you to select a node for viewing and downloading the logs.