OpenTelemetry-Based End-to-End MQTT Tracing
TIP
The end-to-end tracing feature is supported only in EMQX version 5.8.3 and later.
In modern distributed systems, tracking the flow of requests and analyzing performance is essential for ensuring reliability and observability. End-to-end tracing is a concept designed to capture the full path of a request from start to finish, enabling users to gain deep insights into system behavior and performance.
Starting from version 5.8.3, EMQX integrates an OpenTelemetry-based end-to-end tracing feature tailored for the MQTT protocol. This functionality allows users to clearly trace the publishing, routing, and delivery of messages, particularly in multi-node cluster environments. It not only aids in optimizing system performance but also helps in rapid fault localization and enhancing system reliability.
This page provides a detailed guide on how to enable the end-to-end tracing feature in EMQX to achieve a comprehensive visualization of MQTT message flows.
Set Up OpenTelemetry Collector
Refer to Setting Up OpenTelemetry Collector for configuration details.
Enable End-to-End Tracing in EMQX
TIP
Since end-to-end tracing can affect the system performance, only enable it when necessary.
This section guides you on how to enable OpenTelemetry-based end-to-end tracing in EMQX and demonstrates MQTT distributed tracing capabilities in a multi-node setup.
Configure End-to-End Tracing via Dashboard
Click Management -> Monitoring from the Dashboard menu on the left.
Select the Integration tab on the Monitoring page.
Configure the following settings:
- Monitoring platform: Select
OpenTelemetry. - Feature Selection: Select
Traces. - Endpoint: Set the trace data export address, which defaults to
http://localhost:4317.http://localhost:4317. - Enable TLS: Enable TLS encryption for secure communication as needed, typically for security requirements in production environments.
- Trace Mode: Select
End-to-Endto enable end-to-end tracing functionality. - Cluster Identifier: Add a property value to the span attributes to help identify which EMQX cluster the data comes from. The property key will be
cluster.id. Typically, set a simple and easily identifiable name or use the cluster name to differentiate between EMQX clusters. The default isemqxcl. - Traces Export Interval: Set the time interval for exporting trace data, with a default of
5seconds.
- Monitoring platform: Select
Click Trace Advanced Configuration to configure advanced settings if necessary.
- Trace Configuration: Used to set additional trace options, including whether to trace specific events (such as client connections, message transmissions, etc.).
- Client ID White List: Set a whitelist to restrict which clients' connections or messages will be traced. This can help avoid unnecessary tracing and reduce additional system resource consumption.
- Topic White List: Set a topic whitelist, allowing only matching topics to be traced. This works similarly to the client whitelist, helping to control the scope of the tracing.
Click Confirm after you save the configuration and close the window.
Click Save Changes to save the configuration.
Configure End-to-End Tracing via Configuration File
Add the following configuration to the EMQX cluster.hocon file (assuming EMQX is running locally).
For more details on configuration options, refer to the OpenTelemetry subsection of EMQX Dashboard Monitoring Integration.
opentelemetry {
  exporter { endpoint = "http://localhost:4317" }
  traces {
   enable = true
   # End-to-end tracing mode
   trace_mode = e2e
   # End-to-end tracing options
   e2e_tracing_options {
     ## Track client connection/disconnection events
     client_connect_disconnect = true
     ## Track client messaging events
     client_messaging = true
     ## Track client subscription/unsubscription events
     client_subscribe_unsubscribe = true
     ## Maximum whitelist length for client IDs
     clientid_match_rules_max = 30
     ## Maximum whitelist length for topic filters
     topic_match_rules_max = 30
     ## Cluster identifier
     cluster_identifier = emqxcl
     ## Message trace level (QoS)
     msg_trace_level = 2
     ## Sampling rate for events not in the whitelist
     ## Note: Sampling applies only when tracing is enabled
     sample_ratio = "100%"
    }
  }
  max_queue_size = 50000
  scheduled_delay = 1000
 }
}
Demonstrate End-to-End Tracing in EMQX
Start EMQX nodes, for example, start a two-node cluster with node names
emqx@172.19.0.2andemqx@172.19.0.3to demonstrate distributed tracing functionality.Use MQTTX CLI as a client to subscribe to the same topic on different nodes.
Subscribe on the
emqx@172.19.0.2node:bashmqttx sub -t t/1 -h 172.19.0.2 -p 1883Subscribe on the
emqx@172.19.0.3node:bashmqttx sub -t t/1 -h 172.19.0.3 -p 1883
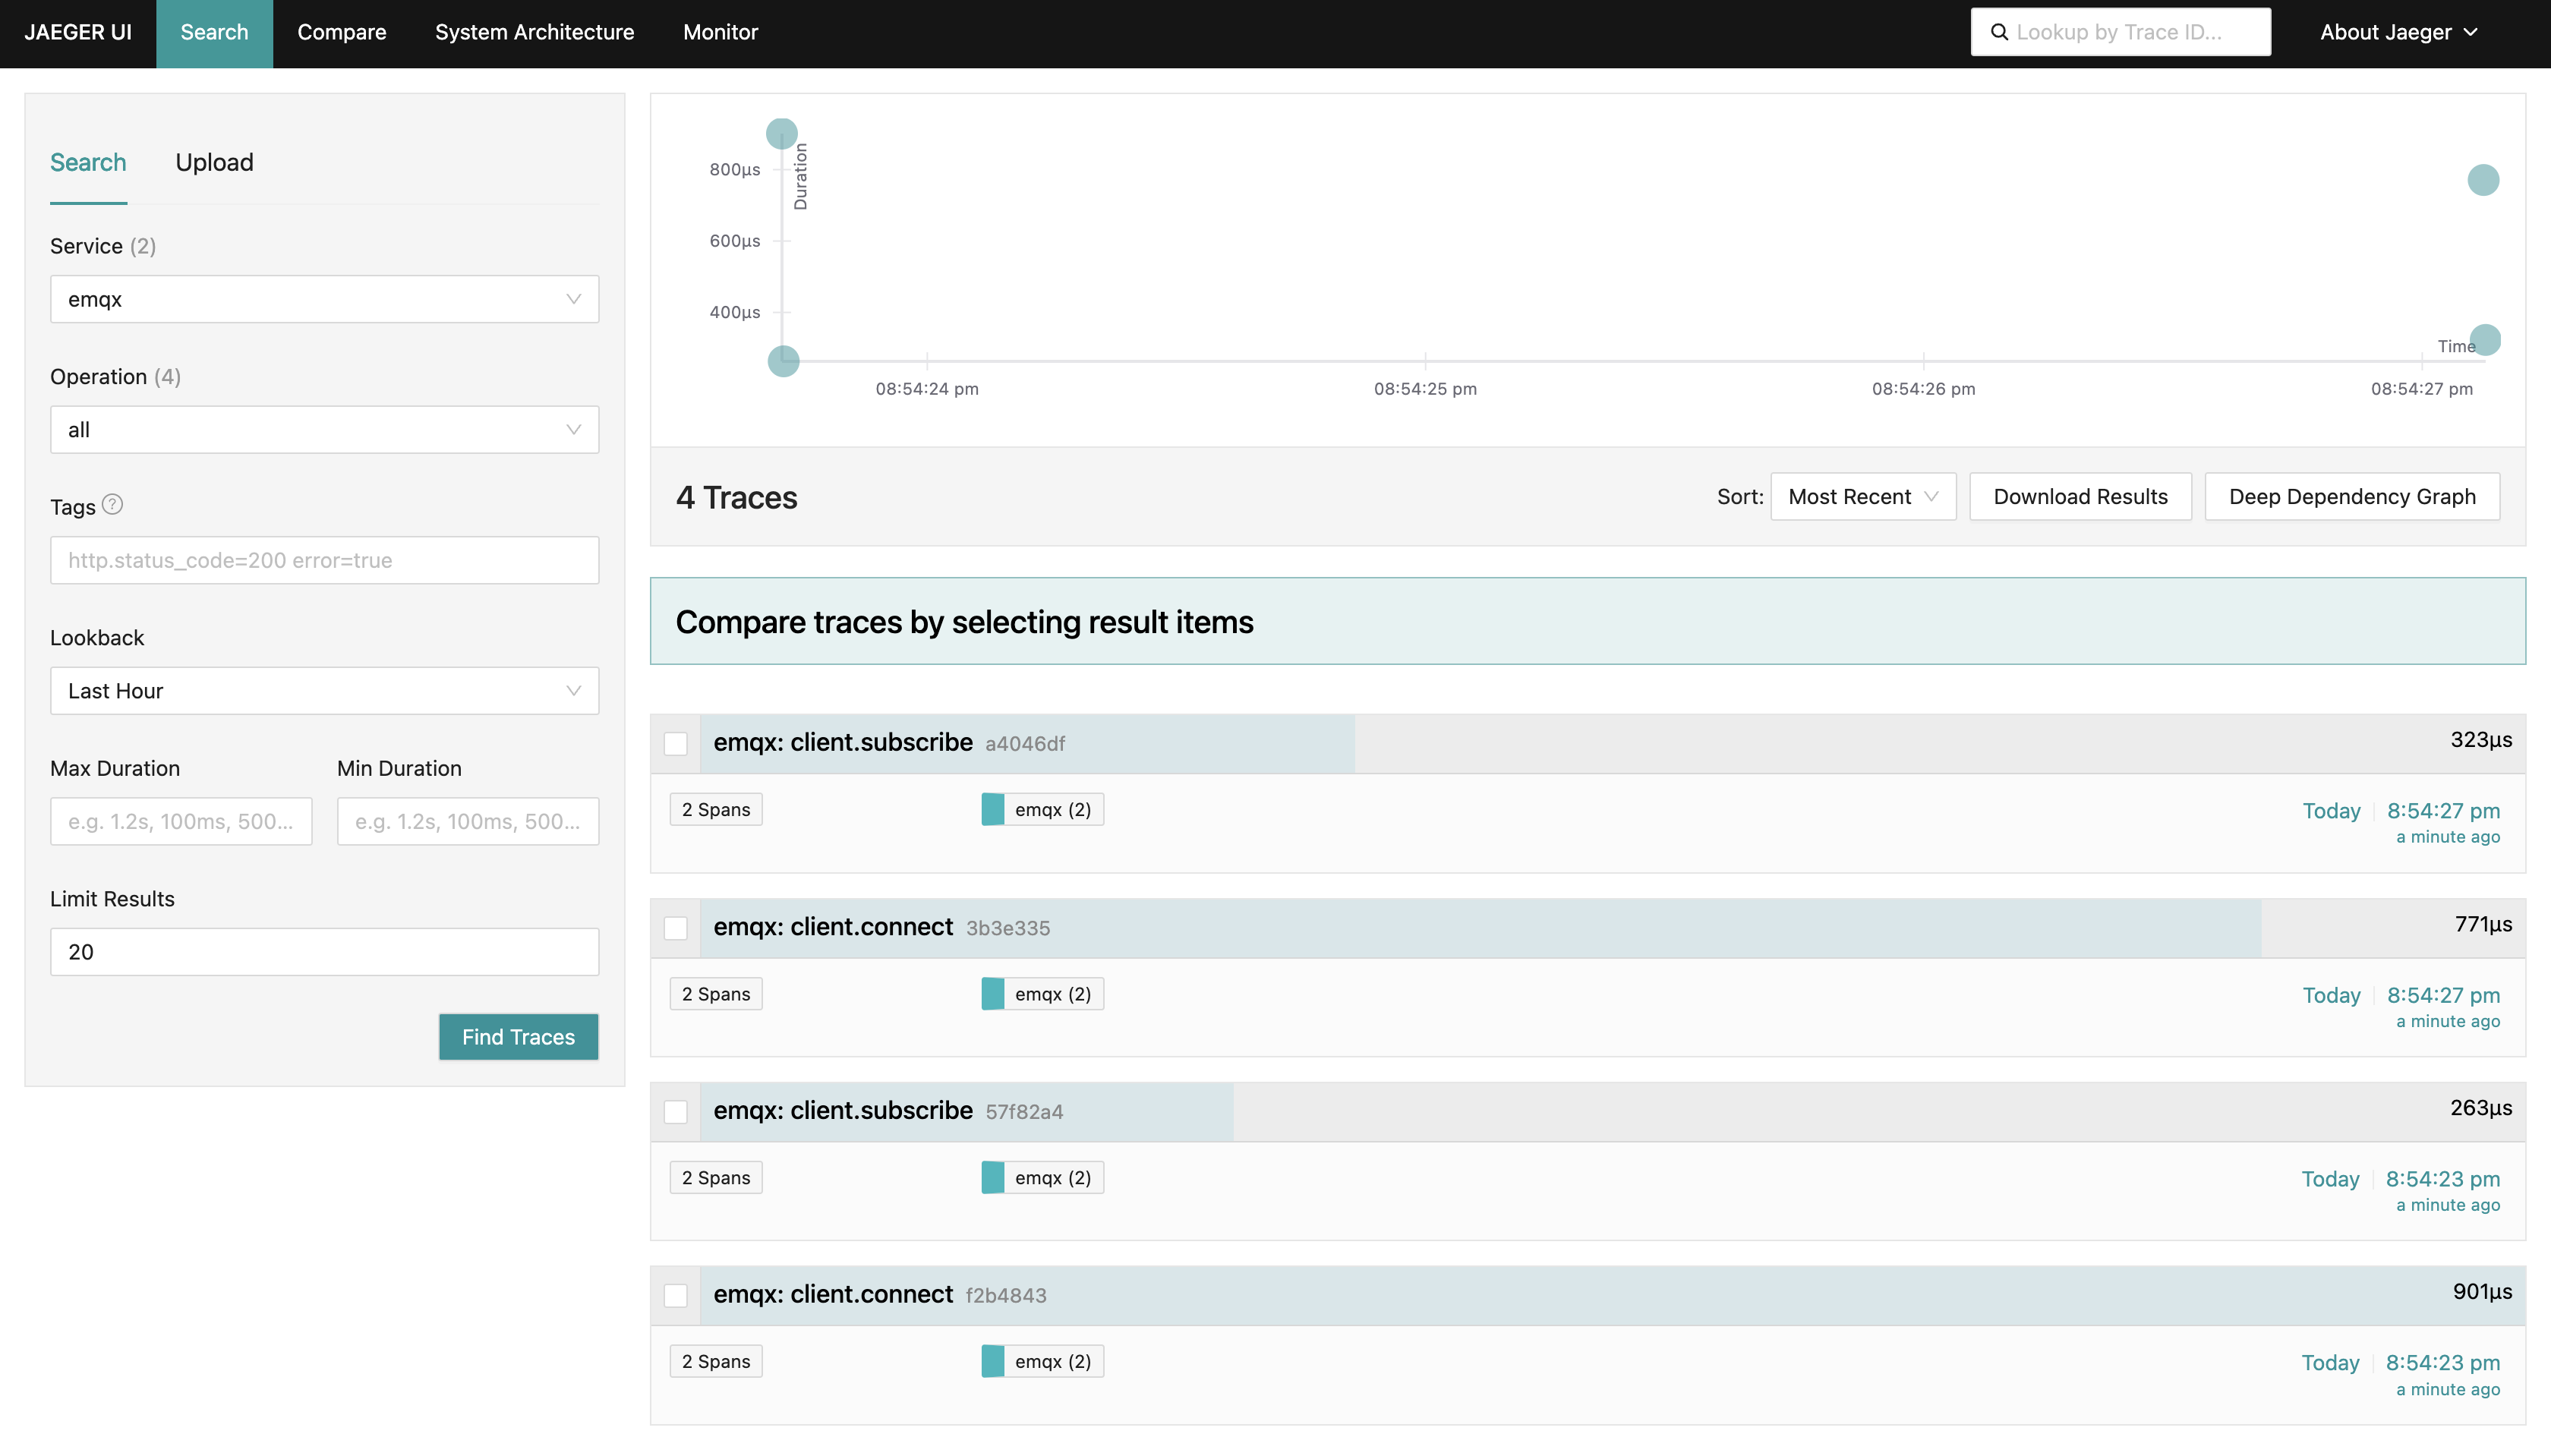
After approximately 5 seconds (the default interval for exporting trace data in EMQX), navigate to the Jaeger WEB UI at http://localhost:16686 to view trace data.
Select the
emqxservice and click Find Traces. If theemqxservice does not appear immediately, wait a moment and refresh the page. You should see traces for client connection and subscription events:
Publish a message:
bashmqttx pub -t t/1 -h 172.19.0.2 -p 1883After a short delay, you can find detailed traces of the MQTT message in the Jaeger WEB UI.
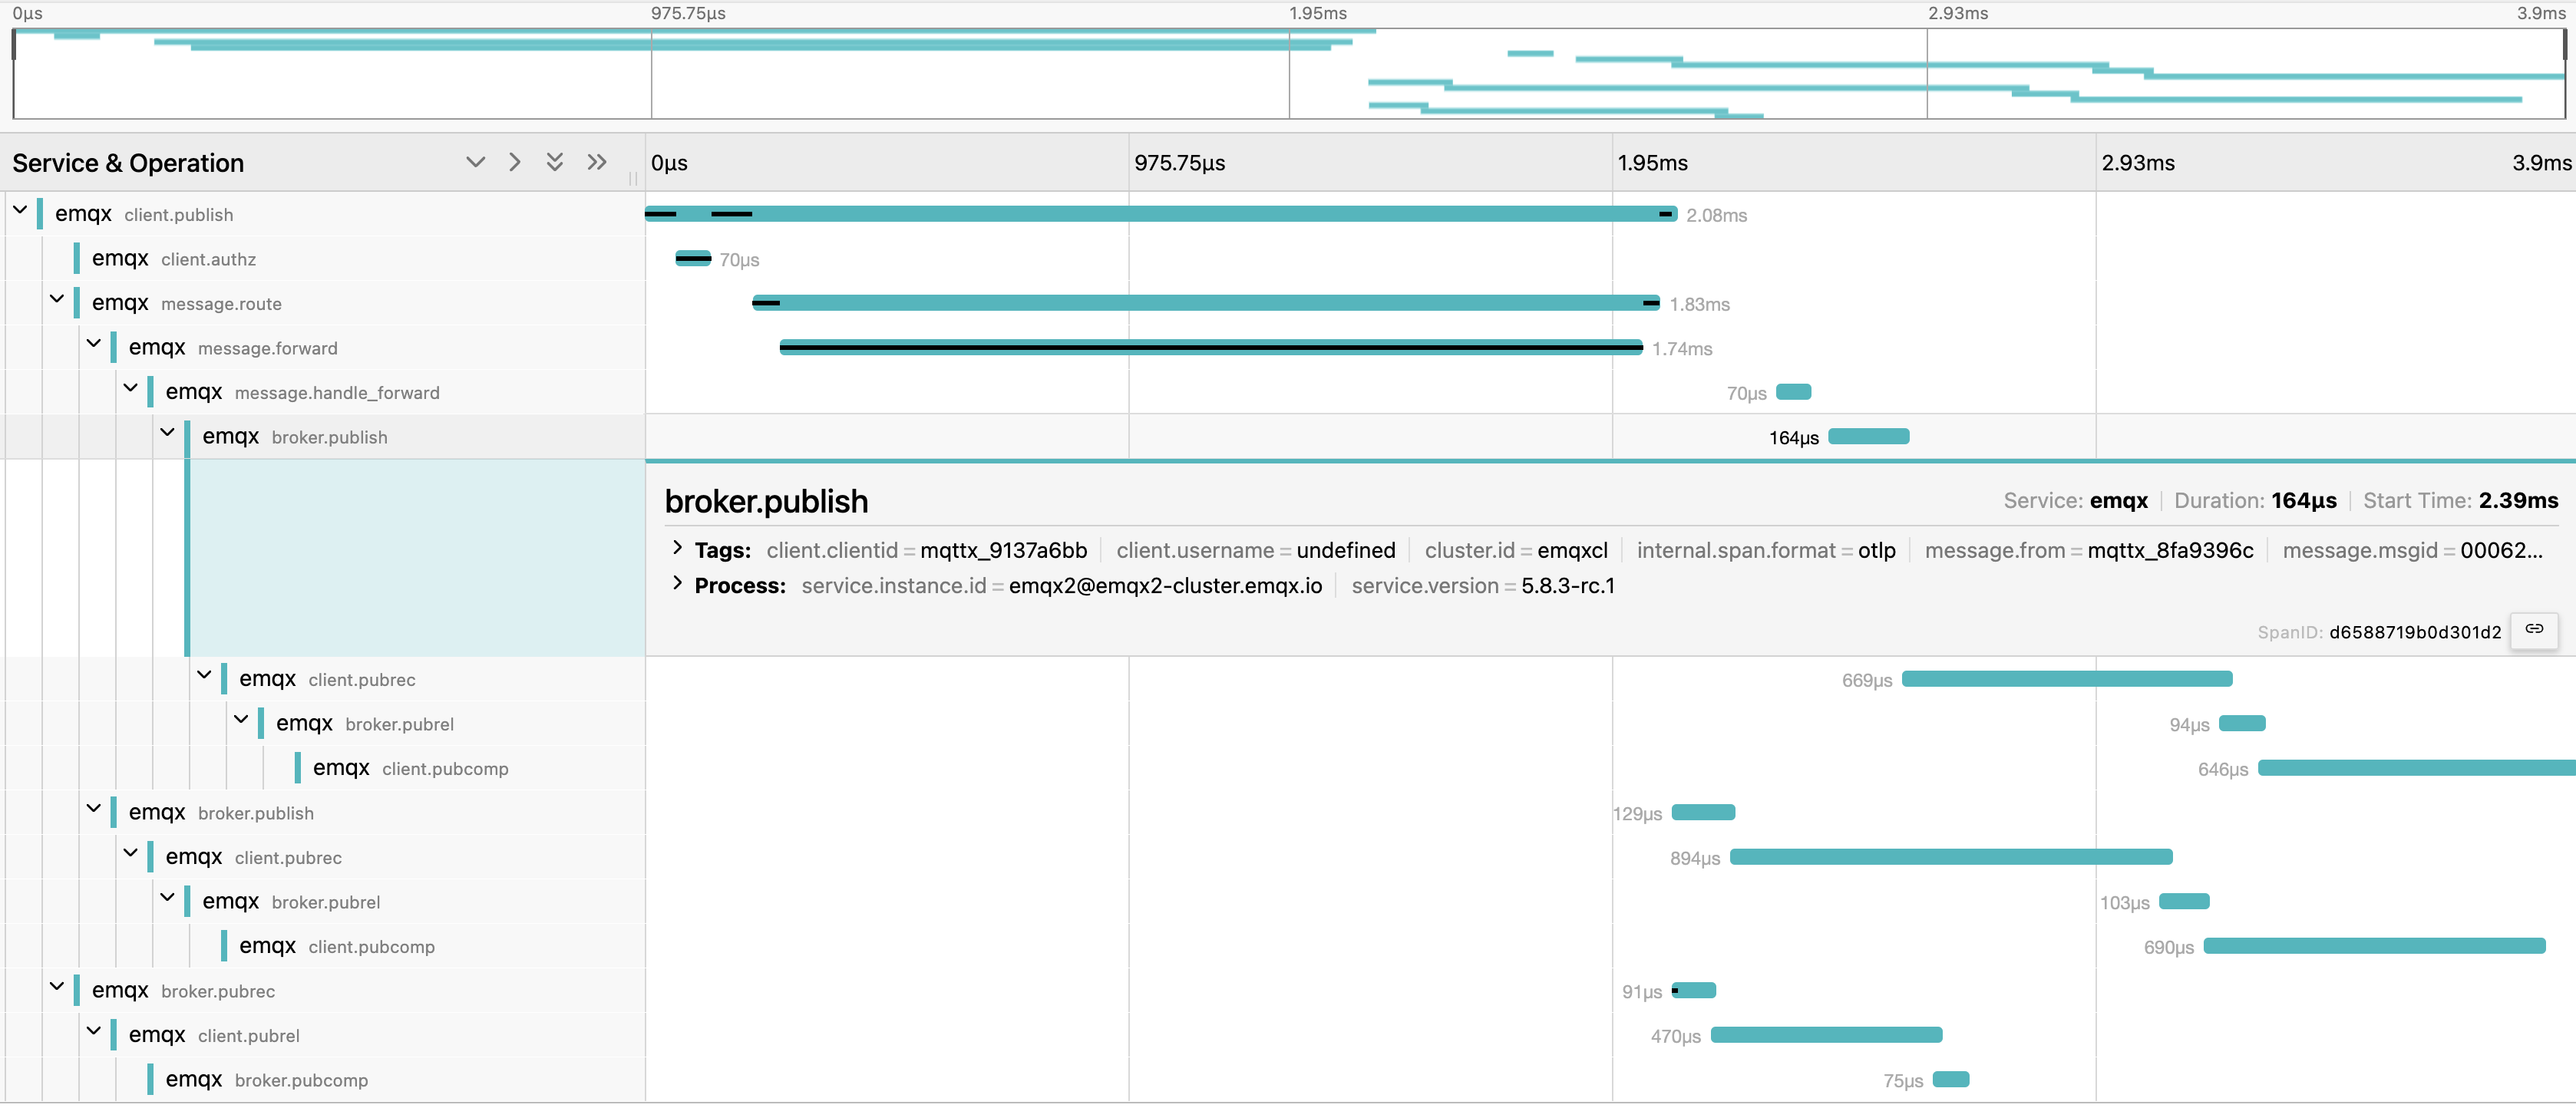
Click a trace to view detailed span information and the trace timeline. Depending on the number of subscribers, cross-node message routing, QoS levels, and the
msg_trace_levelconfiguration, an MQTT message trace may include varying numbers of spans.Below is an example trace timeline and span information when two clients have QoS 2 subscriptions, the publisher sends a QoS 2 message, and the
msg_trace_levelis set to 2.Notably, since the client
mqttx_9137a6bbis connected to a different EMQX node than the publisher, two additional spans (message.forwardandmessage.handle_forward) appear to represent cross-node transmission.
Manage Trace Span Overload
EMQX accumulates trace spans and periodically exports them in batches. The export interval is controlled by the opentelemetry.trace.scheduled_delay parameter, which defaults to 5 seconds. The batch trace span processor includes overload protection, allowing accumulation of spans up to a limit, which defaults to 2048 spans. You can adjust this limit using the following configuration:
opentelemetry {
  traces {
    max_queue_size = 50000
    scheduled_delay = 1000
  }
}
When the max_queue_size limit is reached, new trace spans are dropped until the current queue is exported.
Note
If the traced messages are distributed to a large number of subscribers, or if the message volume is high and the sampling rate is set too high, only a small portion of spans may be exported, with most spans discarded due to overload protection.
For end-to-end tracing mode, consider increasing the max_queue_size value based on message volume and sampling rate, and reducing the scheduled_delay configuration to increase span export frequency. This helps avoid loss of spans due to overload protection.
However, note that higher export frequency and larger queue sizes may increase system resource consumption. You should carefully estimate factors such as message TPS and available system resources before enabling this feature and apply appropriate configurations.