Operation Monitoring
Status statistics
You can view the operation monitoring of nodes and rules to gain insight into the operational status of NeuronEX.
Southbound driver node statistics
Each driver node has a Data Statistics operation button, which is used to display the statistical information of the node.
The statistical fields of the southbound driving node are as follows:
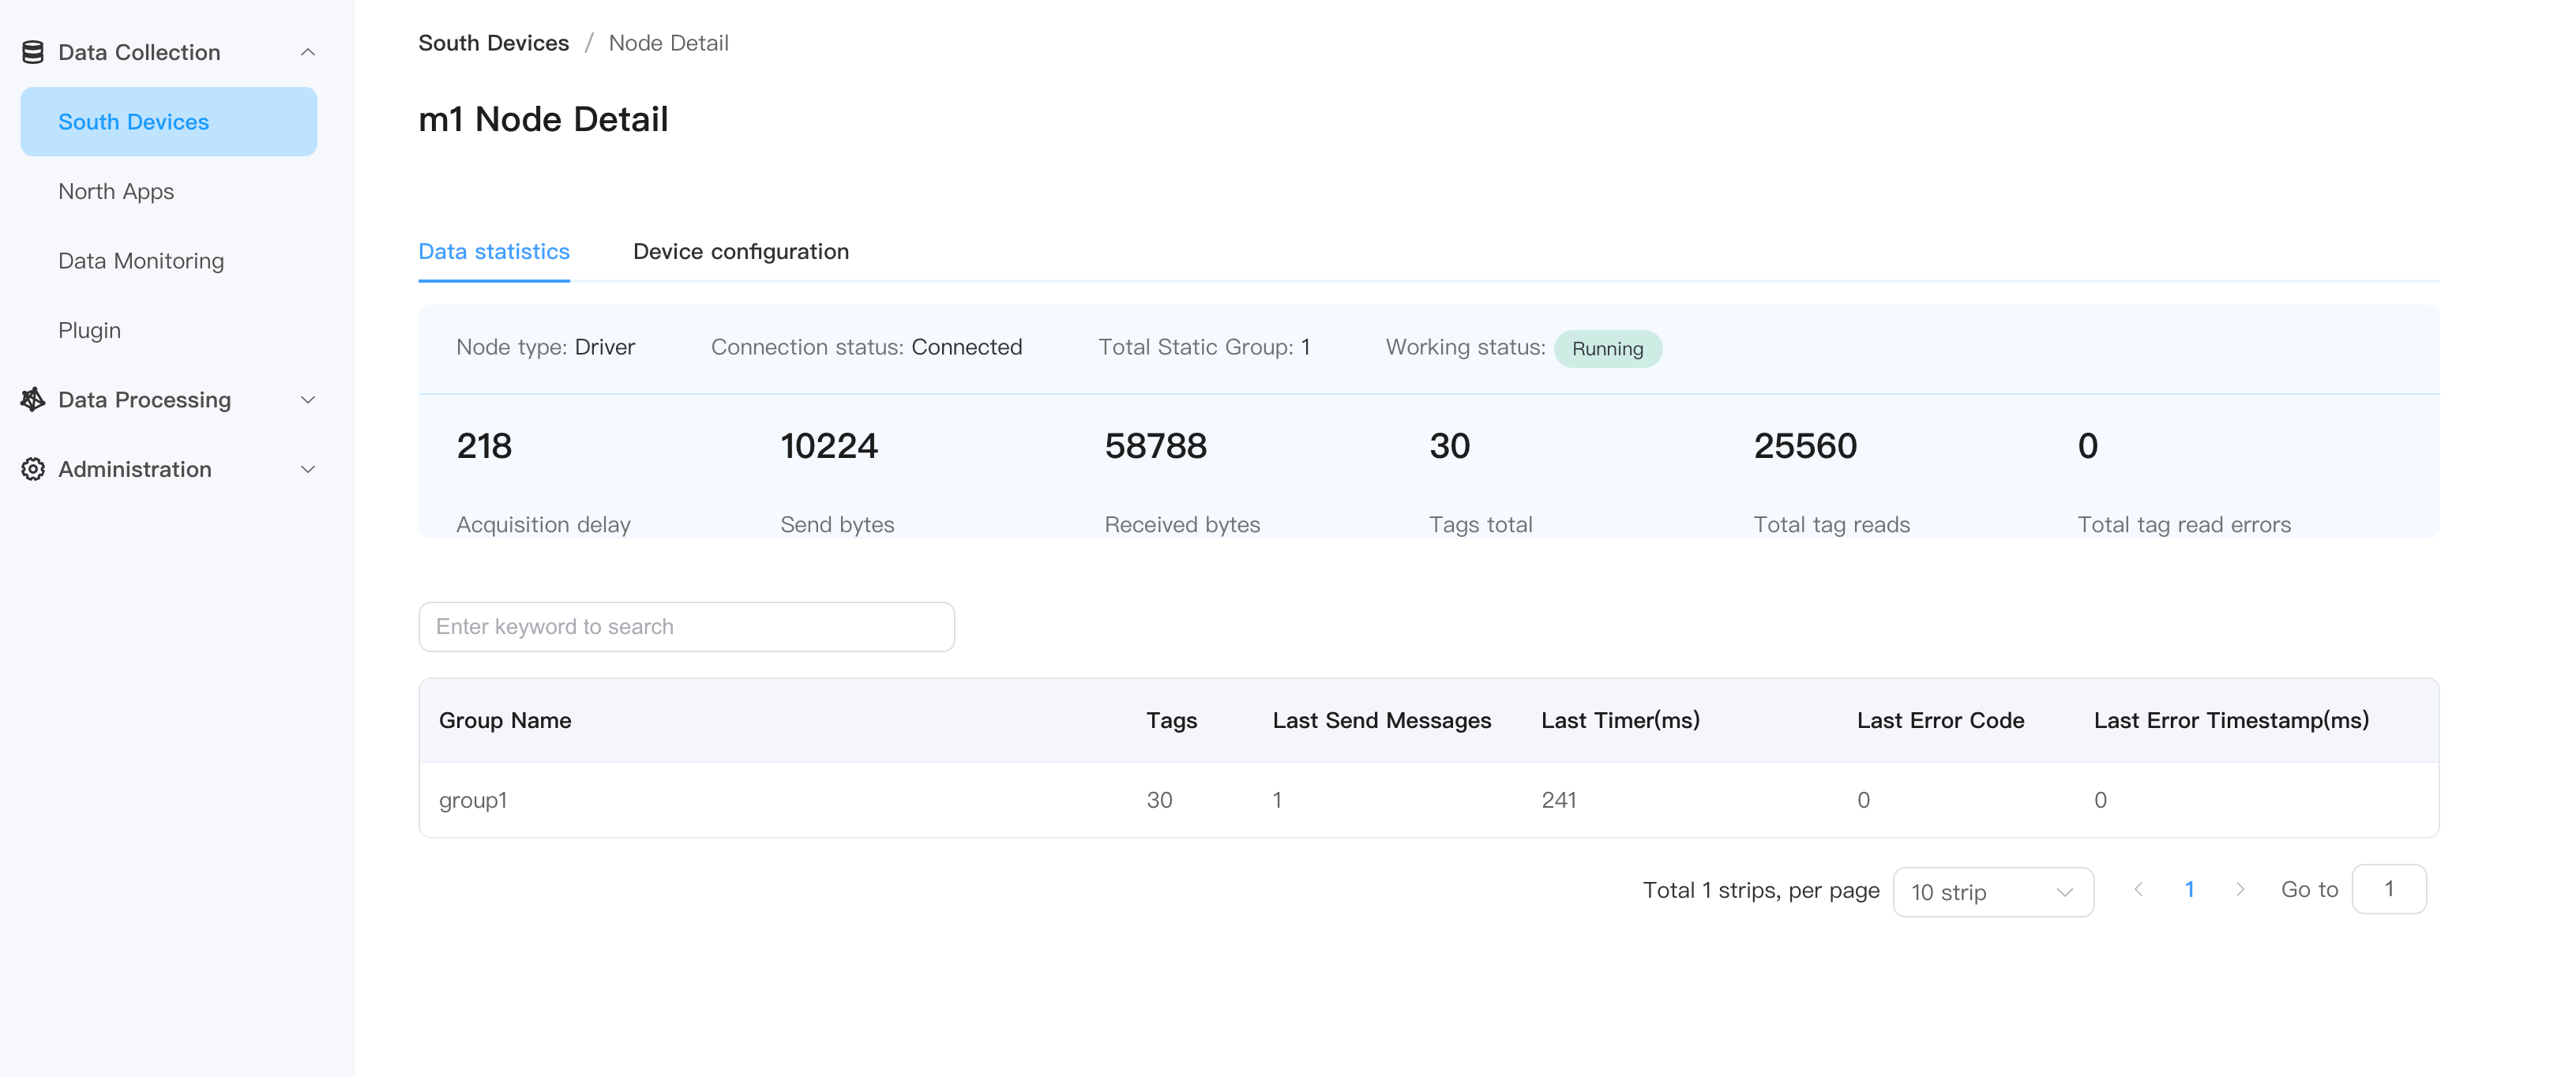
note
Depending on the driver or the number of configured collection groups, the statistical fields of the southbound driver node will be slightly different.
Northbound application node statistics
The statistical fields of the northbound application node are as follows:
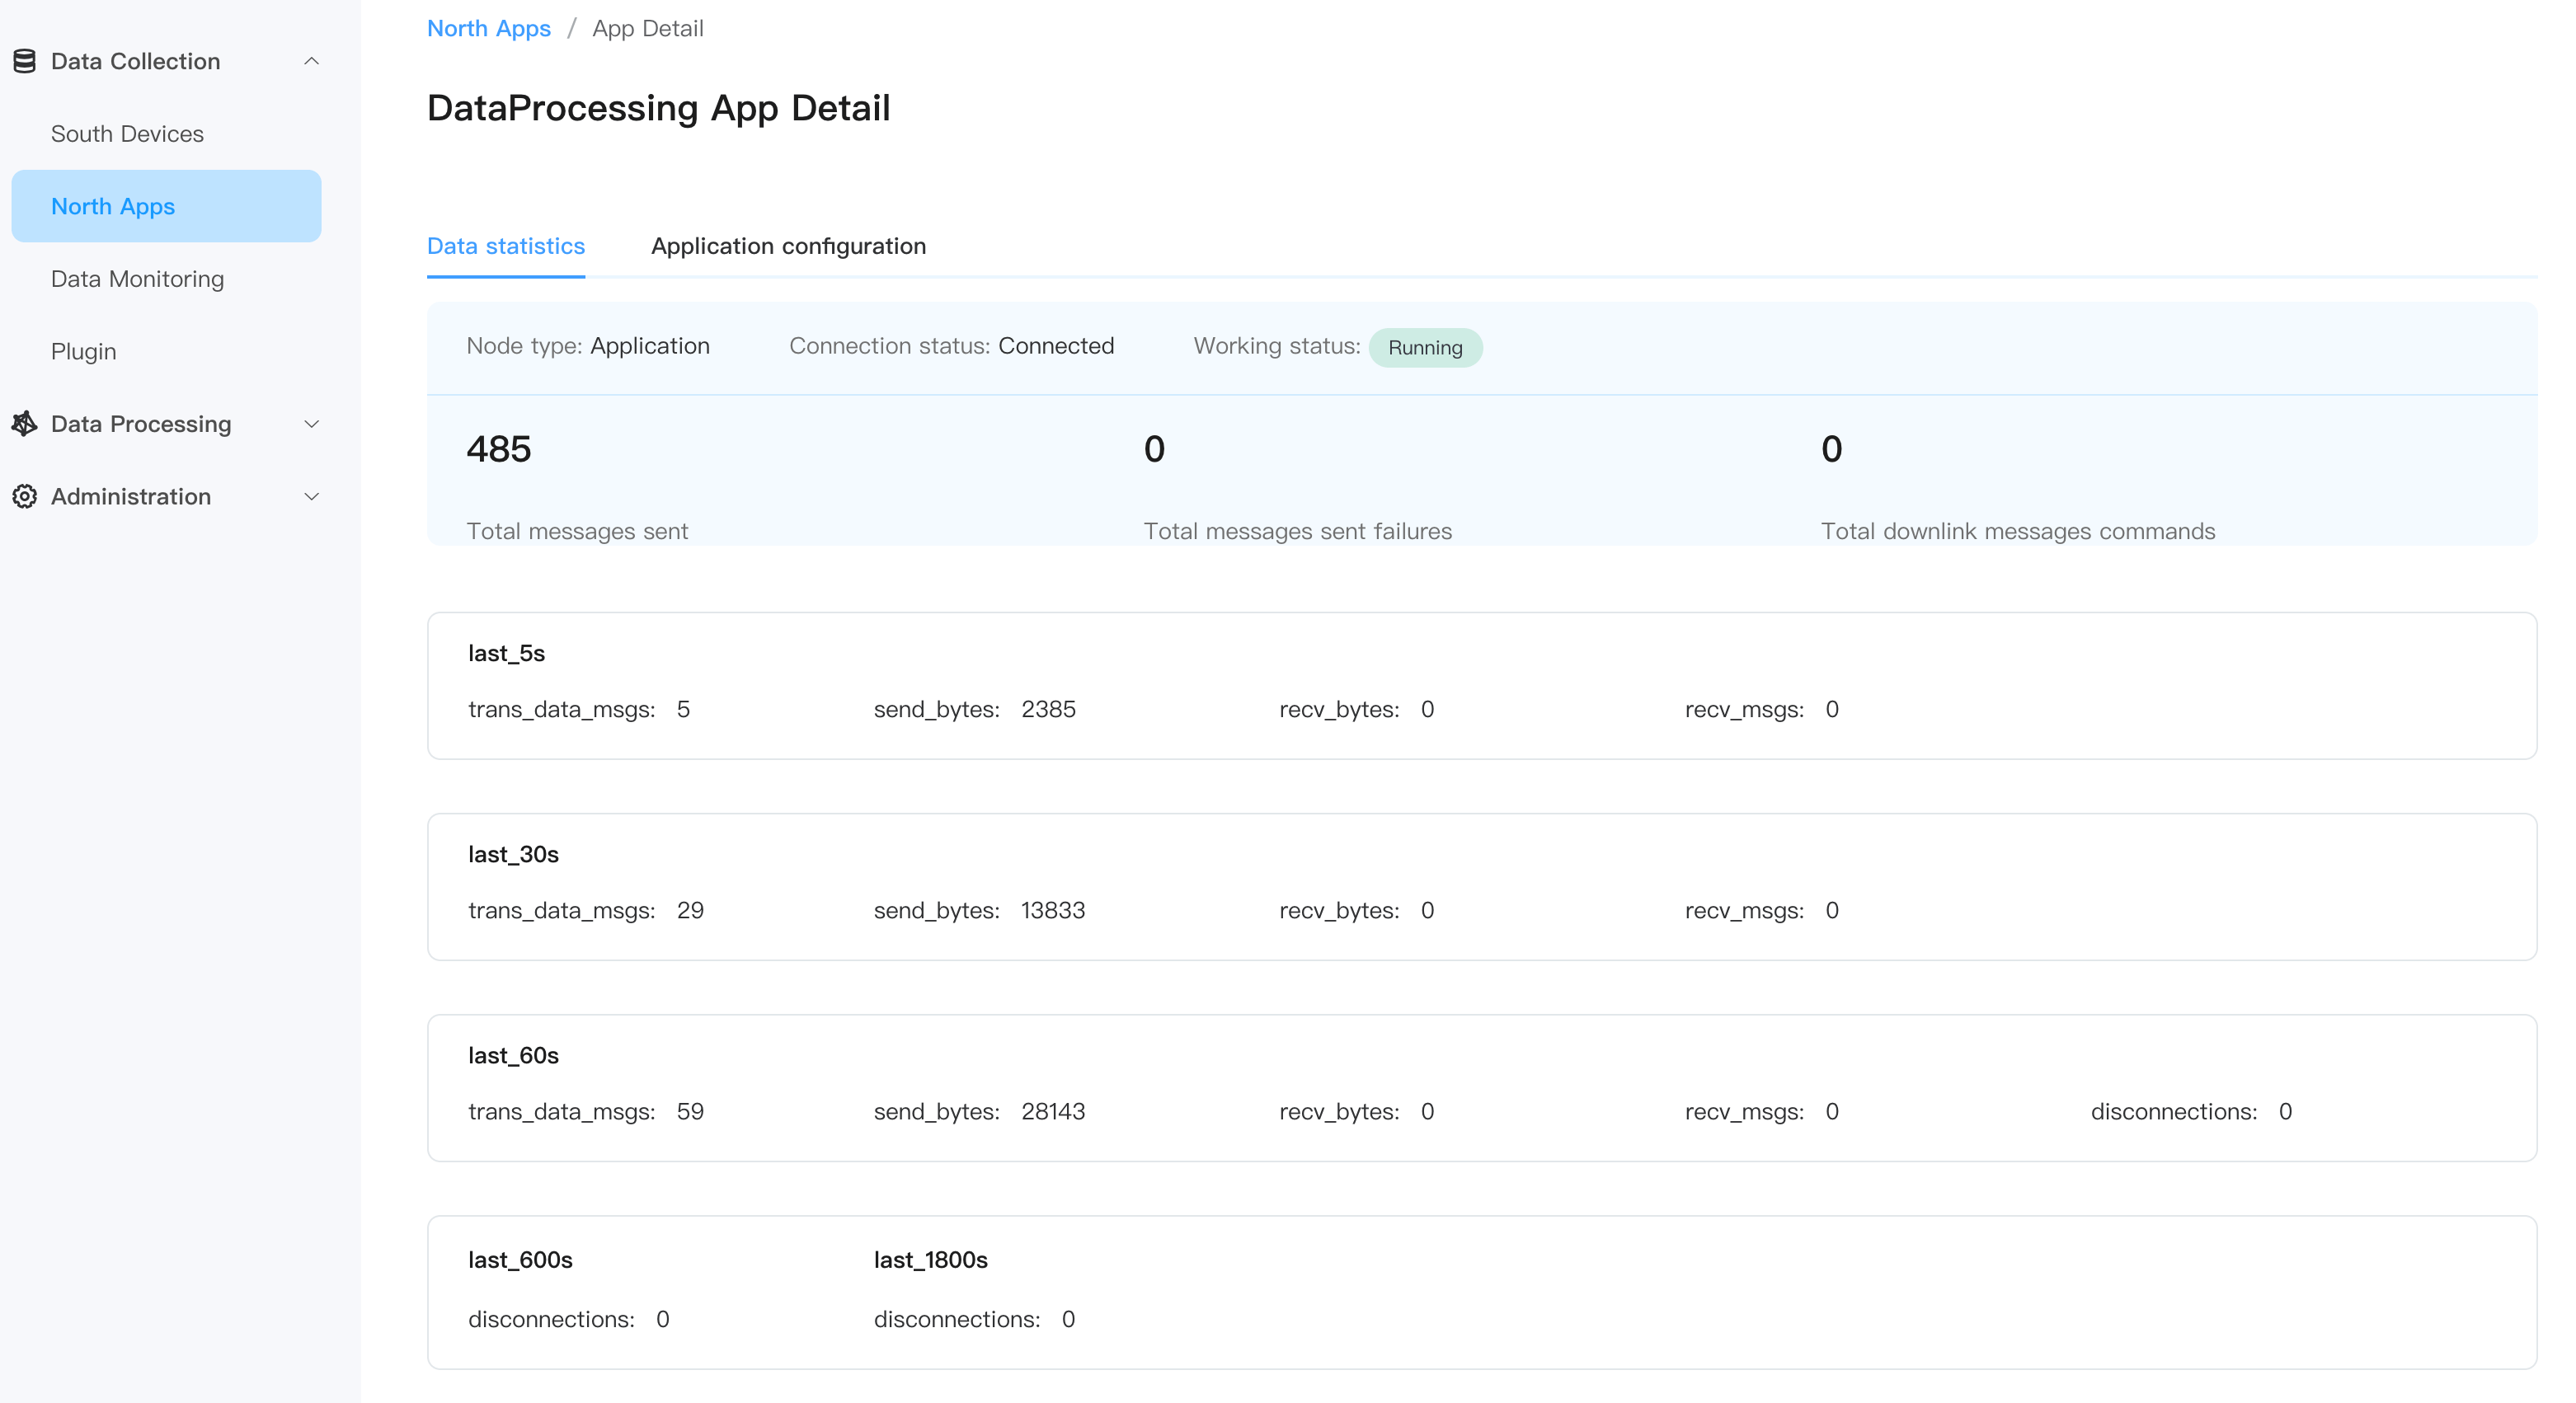
note
The statistical fields of different northbound application nodes will be slightly different.
Rule statistics
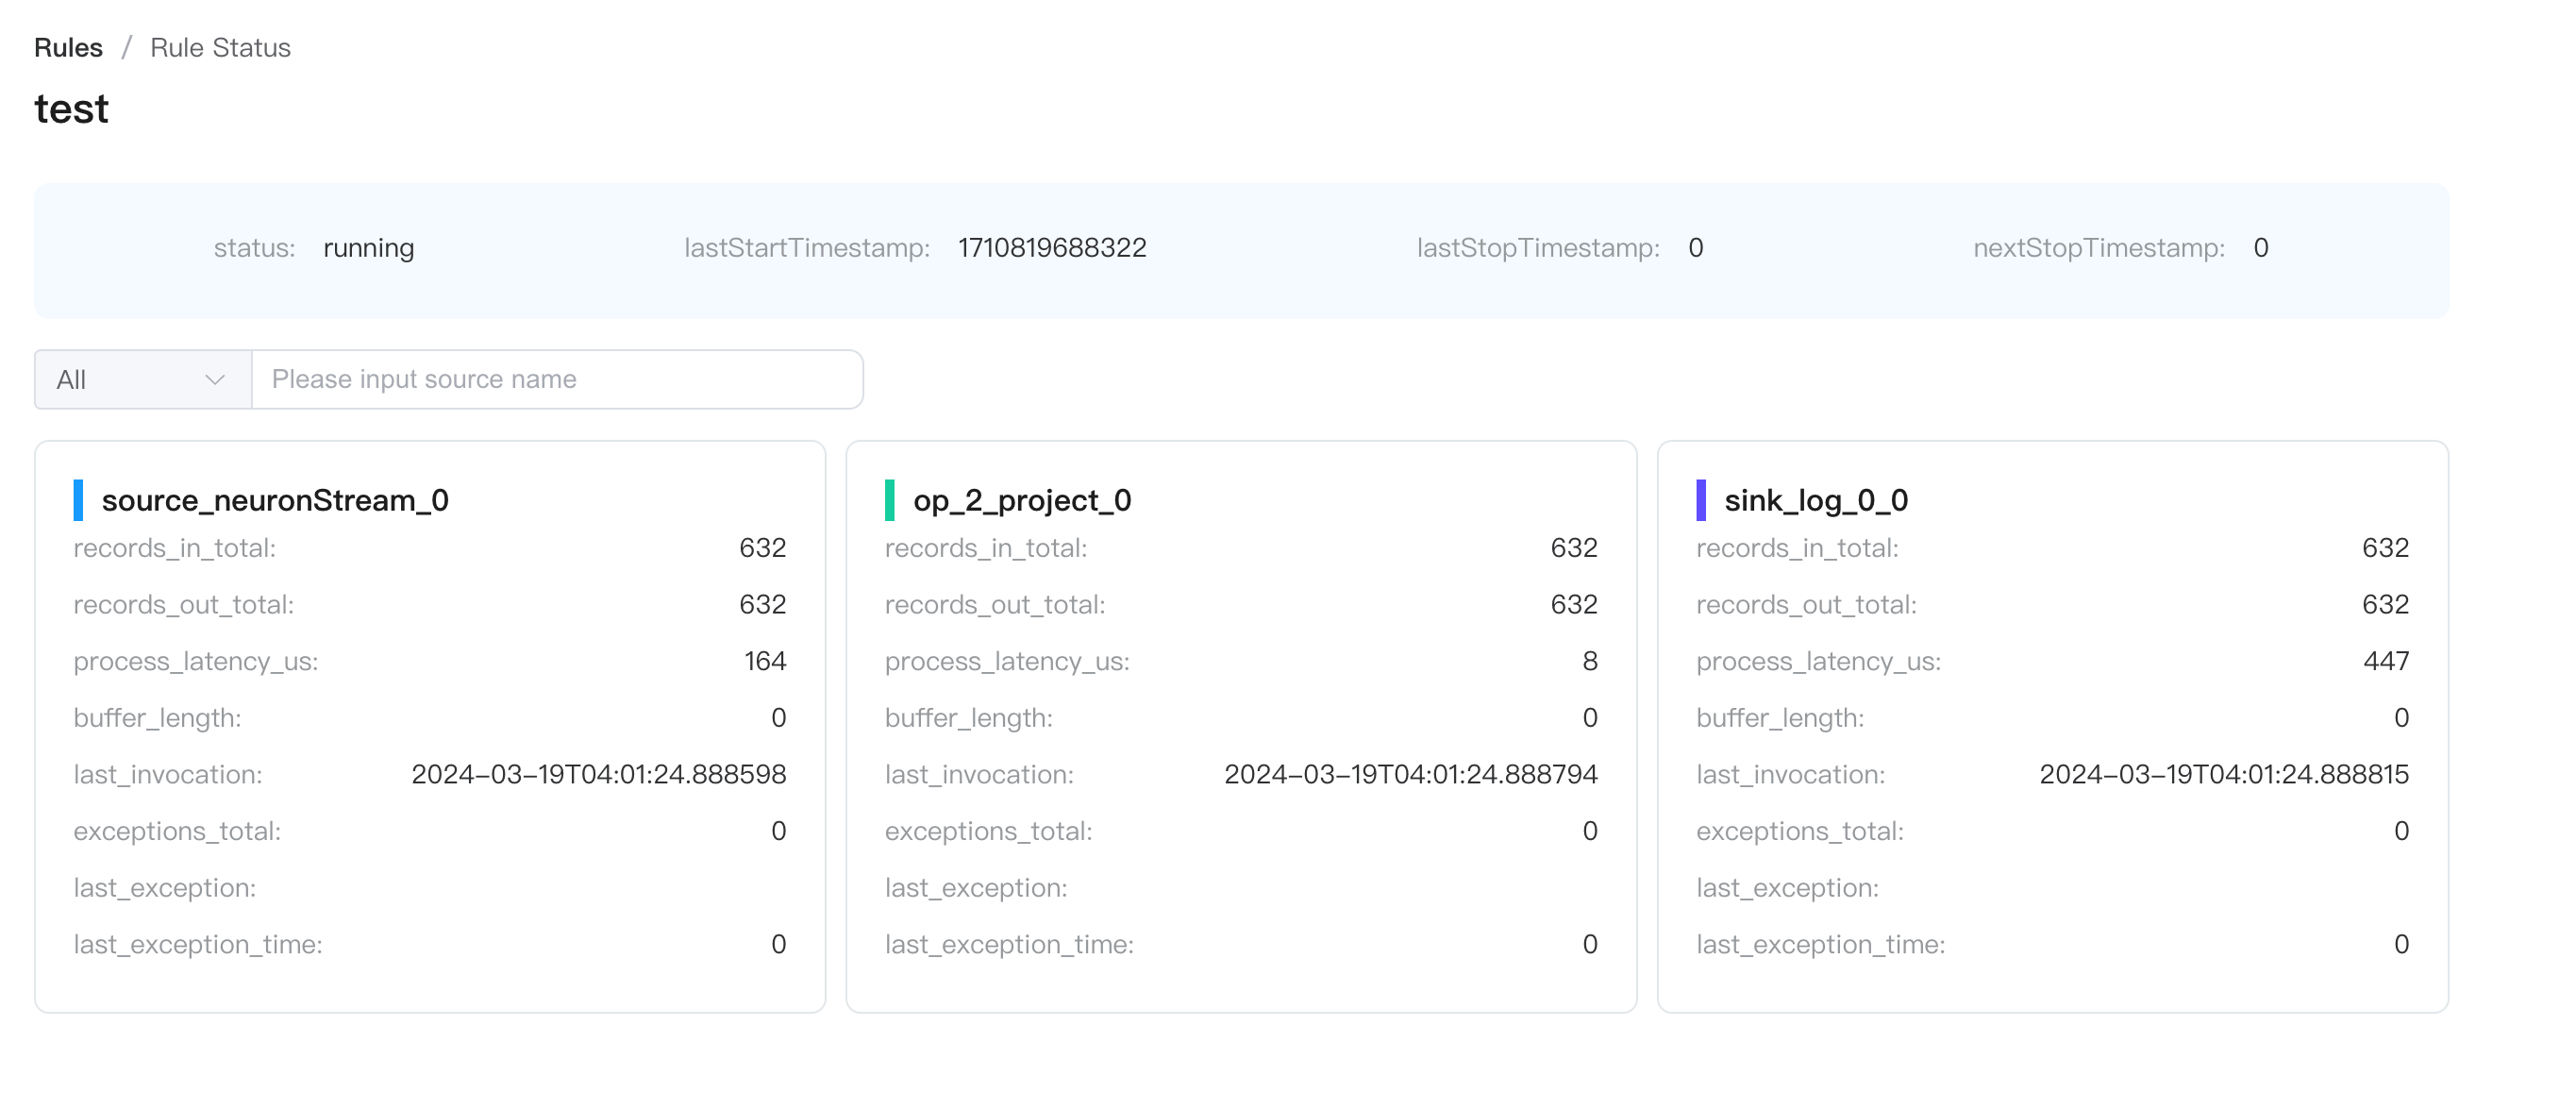
Clicking on Data Statistics of the rule allows you to view the statistics of the rule.
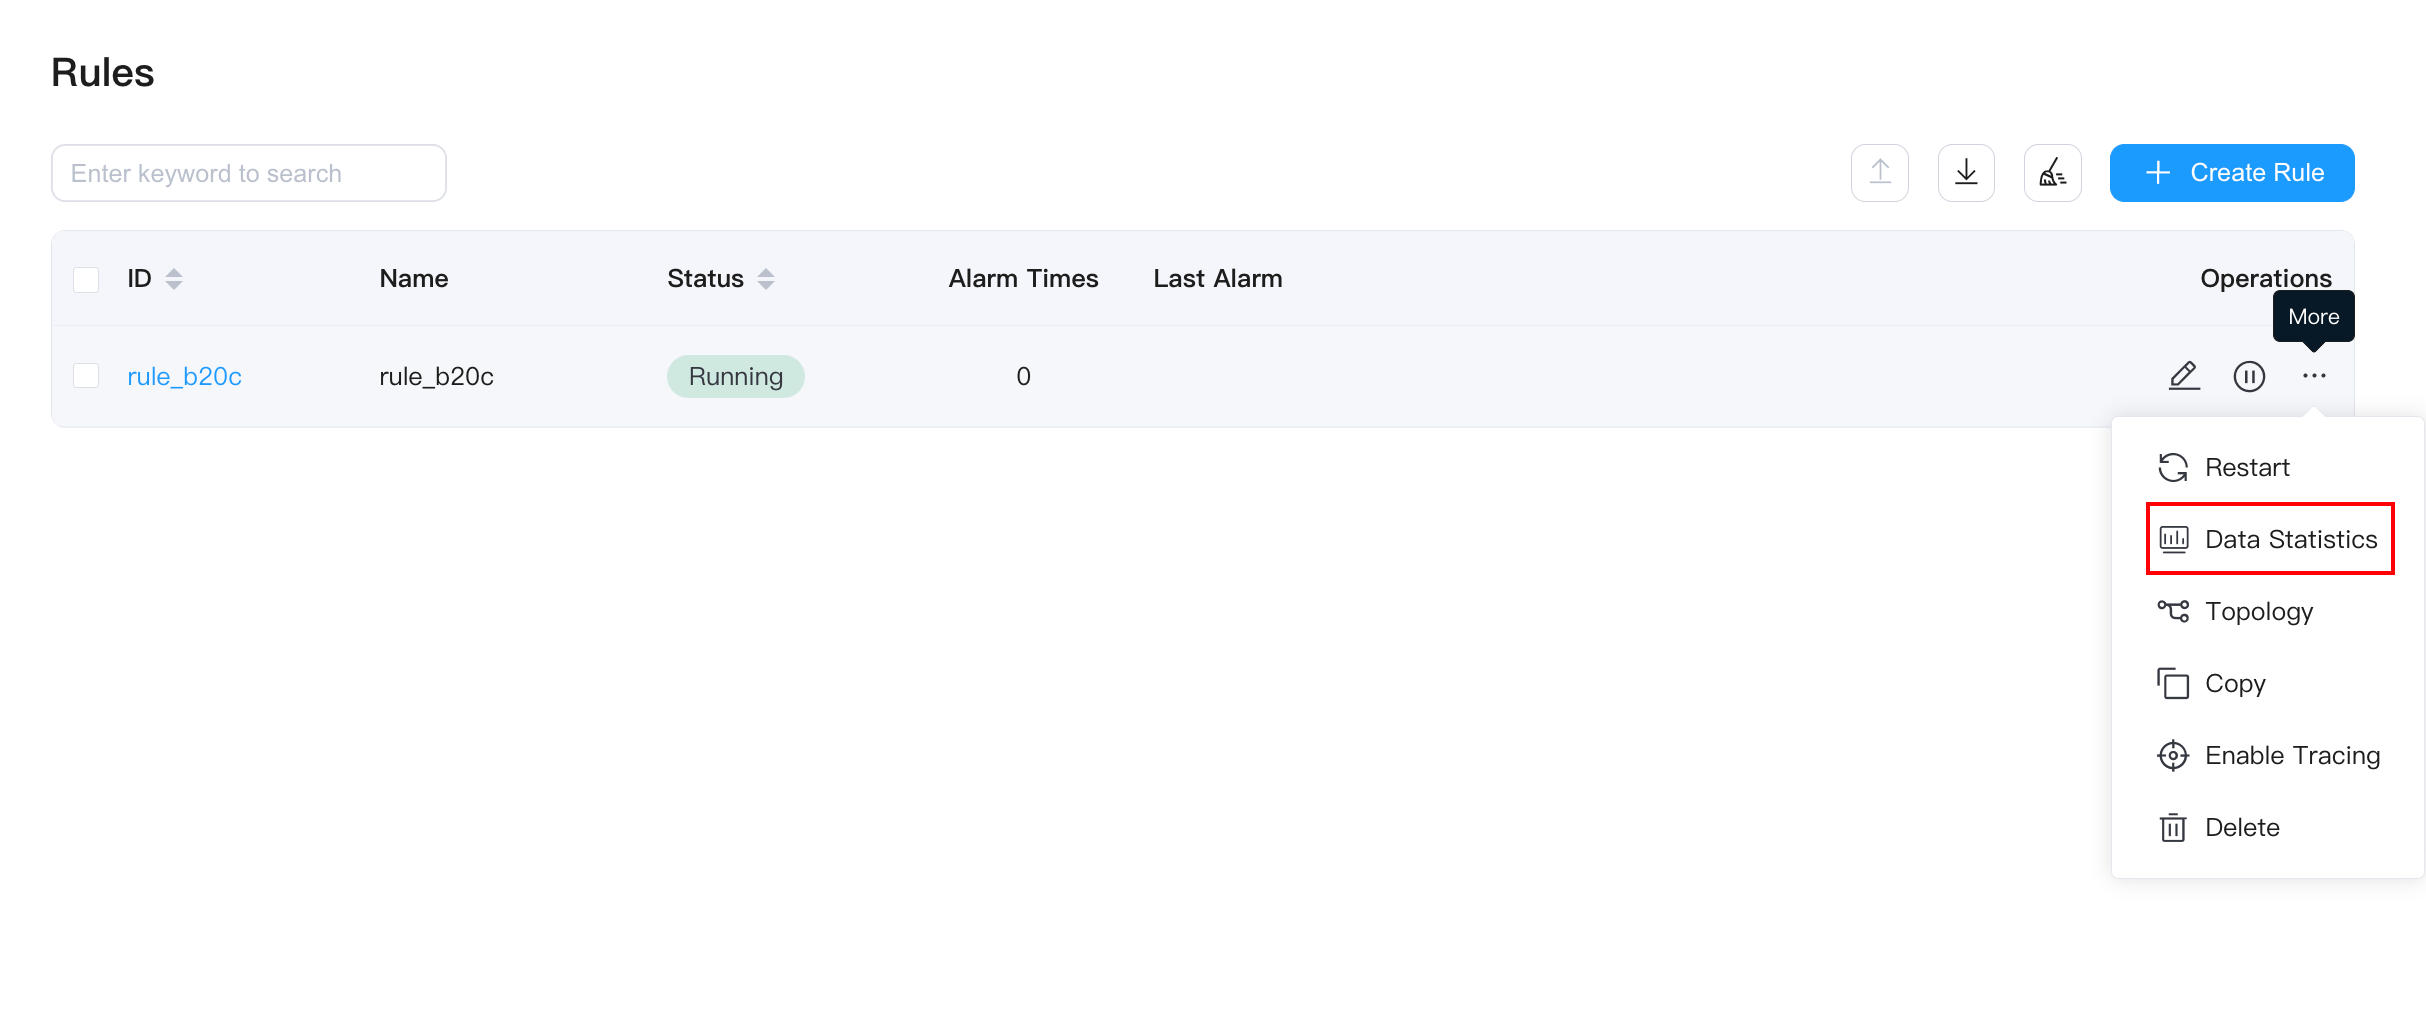
After clicking, the displayed content is as follows:
Metrics statistics
NeuronEX supports the metrics statistics function based on the Prometheus data model, which is used to monitor the running status of drivers and rules. The basic principle of Prometheus is to periodically capture the status of monitored components through the HTTP protocol. Any component can be accessed for monitoring as long as it provides the corresponding HTTP interface. NeuronEX provides the corresponding interface and can smoothly access Prometheus for monitoring.
- metrics statistics of data collection module
http://x.x.x.x:8085/api/neuron/metrics
- metrics statistics of data processing module