Architecture
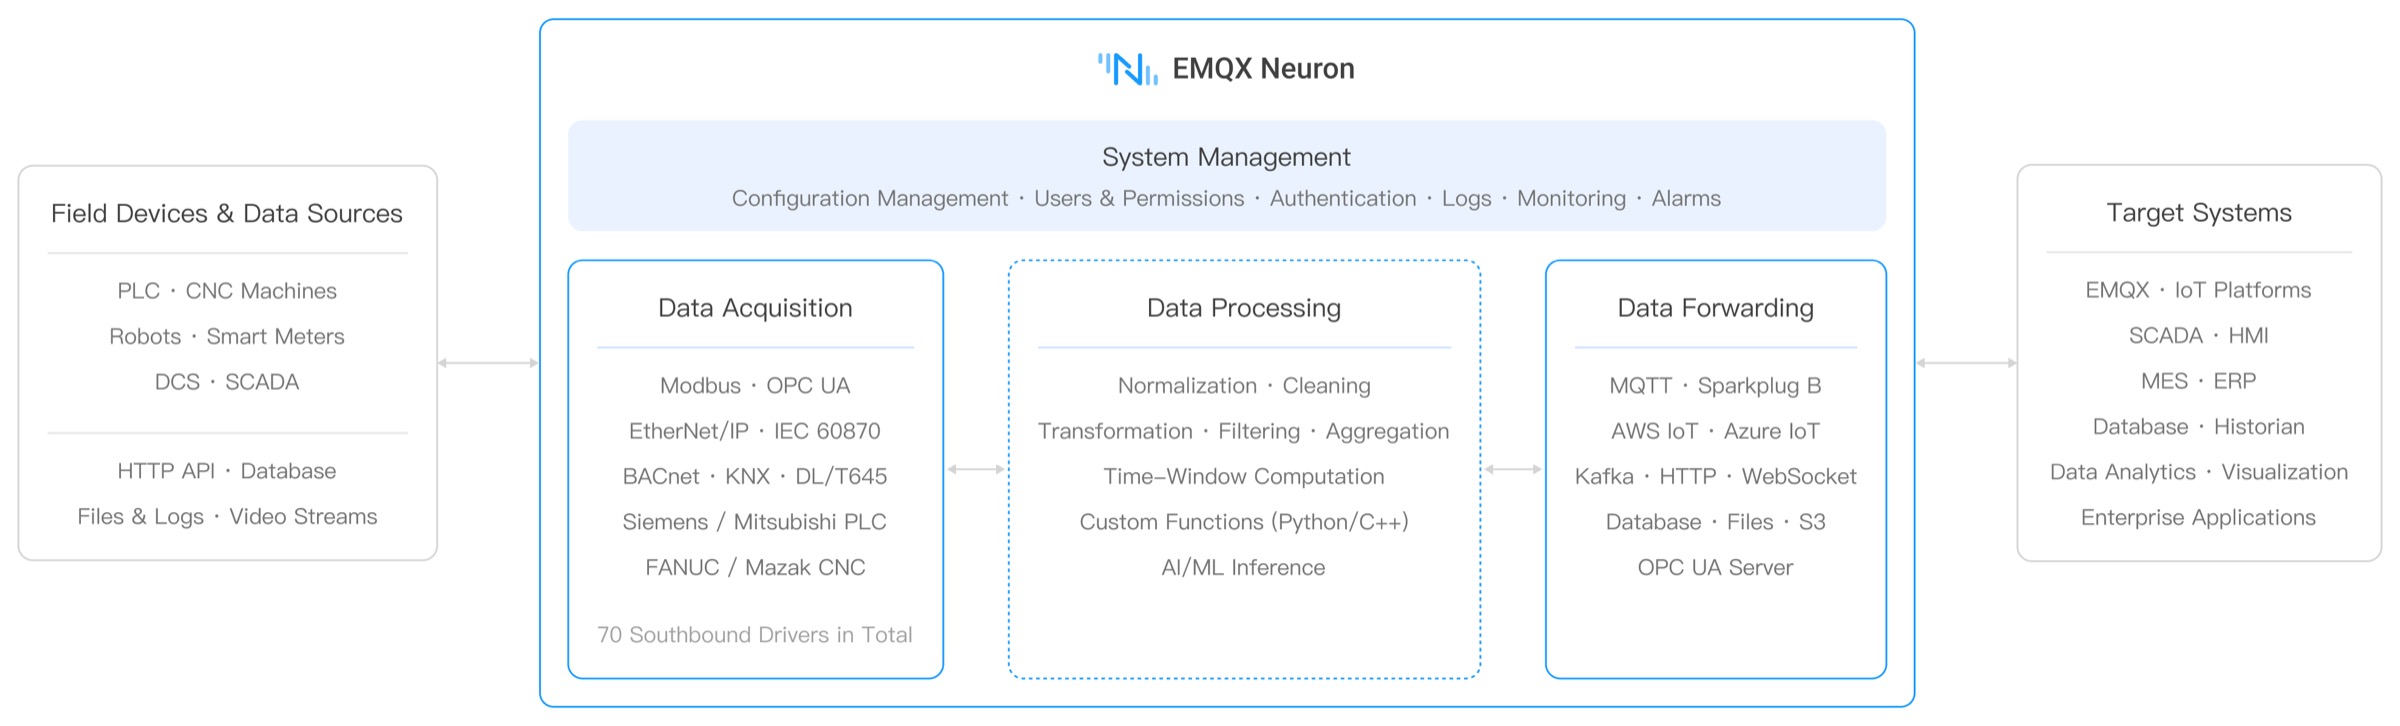
EMQX Neuron runs on the plant floor: southbound drivers read and write devices over their native protocols, northbound applications send data outward, a separate stream processing engine handles the data in between, and a system management module configures and monitors the whole thing.
Core data model
Three concepts underpin every configuration in EMQX Neuron:
| Concept | What it is |
|---|---|
| Node | A running instance of one southbound driver or northbound application. The same driver can back several nodes, each talking to a different device |
| Group | A collection unit under a node, with its own polling interval. The group is the unit of collection, reporting, and subscription |
| Tag | One address inside a device, with read/write attributes, a data type, and precision |
A single EMQX Neuron process runs many southbound and northbound nodes side by side, isolated from one another, with the core framework routing messages between them.
For configuration steps, see Data Collection, Processing and Delivery; for limits such as name lengths, groups per node, and the fastest polling interval, see Configuration specification on that page.
Routing from southbound to northbound
Collected data does not go straight from a driver to an application — the core framework's message bus forwards it:
- On startup, each node opens two UNIX domain sockets (
AF_UNIX/SOCK_DGRAM): one carries control commands, the other carries data, keeping the control plane and data plane separate. - A northbound application subscribes by (driver, group). The core framework records the subscription along with that application's socket address.
- When a group finishes a polling cycle, the core framework looks up every application subscribed to that group and delivers the data to each one's data-plane socket.
Because subscription is per group rather than per node, different groups on the same device can go to different applications — a high-frequency group to the local SCADA, a low-frequency group to the cloud. See Subscribe to Southbound Data.
Stream processing engine
The stream processing engine is a separate process, not part of the EMQX Neuron main process. The two communicate over an NNG channel:
- On the EMQX Neuron side, the rule engine application (a northbound application) listens on
0.0.0.0:7081— the port is configurable in the range 1024–65535 — using the NNGpair0protocol. - The engine process dials in as the client and receives the subscribed southbound data.
The consequence is that collection and processing do not block each other: restarting the engine, a faulty rule, or a load spike will not disturb southbound collection, and the engine can be scaled independently. The cost is one cross-process hop for the data.
The engine can also ingest non-device sources — HTTP Pull, HTTP Push, SQL databases, files, and video streams — and merge them with device data in the same engine. Results are written out through a sink.
Offline caching
Plant networks are unreliable, so data is not lost when a northbound connection drops. Taking the MQTT application as an example, with offline caching enabled:
| Setting | Description | Range |
|---|---|---|
| Cache memory size | Messages are buffered in memory first after a disconnect | 1–1024 MB |
| Cache disk size | Spills to disk once memory fills; should be larger than the memory cache | 1–10240 MB |
| Sync interval | Interval for replaying cached messages after reconnecting, in milliseconds | 10–120000, default 100 |
The memory and disk tiers are configured together — set both or neither. Once the connection recovers, cached messages are replayed in batches at the sync interval.
System management
- Configuration: one web console for southbound drivers, northbound applications, and processing rules; configuration is persisted in the data directory and survives upgrades.
- Security: username and password access control, JWT-based API authentication, and TLS/SSL for transport.
- Observability: runtime logs, per-node performance metrics, connection status monitoring, and alerts.
- High availability: deployable in master-backup mode.
See Operations.