MQTT
MQTT is a messaging protocol designed for IoT devices and applications operating on a publish/subscribe model. It's lightweight, efficient, reliable, and allows for real-time communication. MQTT is well-suited for environments with limited resources, where efficient use of power and bandwidth is necessary.
EMQX Neuron supports MQTT as one of its communication protocols. The EMQX Neuron MQTT application allows users to quickly build IoT applications that use MQTT communication between devices and the cloud.
Using the MQTT application, developers can also publish messages back to IoT devices, triggering actions such as turning lights, motors, and other equipment on or off.
The application also supports secure communication with devices, using authentication and encrypted communication protocols to ensure data safety and privacy.
TIP
It is not recommended to enable multiple MQTT application nodes in the same EMQX Neuron instance, as this may lead to performance degradation and resource contention issues. To collect and forward data from different southbound devices, it is recommended to add multiple subscriptions within the same MQTT node.
Add Application
To create a northbound MQTT node and connect it to an MQTT Broker to upload data, navigate to Data Collection -> North Apps and click Add Application to add an MQTT client node.
- Name: The name of this application node, for example, "mqtt".
- Application: Select the MQTT application.
Configure Application
See the table below for the configuration parameters.
| Parameter | Description |
|---|---|
| MQTT Version | The version of MQTT protocol, default v3.1.1. |
| Client ID | MQTT client id for communication, a required field. |
| QoS Level | MQTT QoS level for message delivery, optional, default QoS 0. |
| Upload Format | JSON format of reported data, a required field: - values-format, data are split into values and errors sub-objects. - tags-format, tag data are put in a single array. - ECP-format: Add tag types on the basis of tags-format. - Custom: Customize the reported data format. For data communication format, see Upstream/Downstream Data Format |
| Upload Tag Error Code | When data tag collection reports an error, report the tag error code, default enabled. |
| Write Request Topic | MQTT topic to which the application subscribes for write requests. For data communication format, see Upstream/Downstream Data Format . If tracing is enabled, configure the user properties traceparent and tracestate according to the W3C standard. |
| Write Response Topic | MQTT topic to which the application sends write responses. |
| Driver Status Report | Reports status of all the southbound nodes to the specified topic. |
| Status Report Topic | The topic for status reporting. |
| Status Report Interval | The time interval for reporting the status of the southbound node, in seconds. The range is 1-3600, default 1. |
| Offline Data Caching | Offline data caching switch. Cache MQTT messages when offline, and sync cached messages when back online. |
| Cache Memory Size | In-memory cache limit (MB) in case of communication failure, a required field. Range in [0, 1024]. Should not be larger than Cache Disk Size. For details about the cache feature, see Offline Data Caching |
| Cache Disk Size | In-disk cache limit (MB) in case of communication failure, a required field. Range in [0, 10240]. If nonzero, cache-mem-size should also be nonzero. |
| Cache Sync Interval | Time interval (MS) between each message to sync when communication restores. Range in [10, 120000]. |
| Broker Host | MQTT Broker host, a required field. |
| Broker Port | MQTT Broker port number, a required field. |
| Username | Username when connecting to the broker, optional. |
| Password | Password when connecting to the broker, optional. |
| SSL | Whether to enable MQTT SSL, default false. For details, see MQTT over SSL |
| CA | CA certificate, required when SSL is enabled and using self-signed certificates. |
| Client Cert | Client certificate, required when using SSL two-way authentication. |
| Client Private Key | Client key, required when using SSL two-way authentication. |
Offline Data Caching
EMQX Neuron's offline data caching is a valuable feature designed to enhance application robustness and reliability. This feature is particularly beneficial in environments where network connectivity is inconsistent, unstable, or limited. It works by locally storing data on the device running EMQX Neuron during any network outages, enabling the MQTT application to synchronize data with the broker once the network connection is restored.
The process is straightforward: when a network disruption occurs, the MQTT application initially stores data in a memory cache. It only reverts to flushing data to a disk cache if the memory cache becomes full. Once the network connection is reestablished, the MQTT application starts publishing the cached data to the broker following a FIFO (First In, First Out) order. This streamlined approach ensures smooth data flow and connectivity, even in challenging network conditions.
Offline data caching is controlled by the Offline Data Caching, Cache Memory Size, and Cache Disk Size parameters. To enable the cache feature:
- Set the Offline Data Caching parameter to true and switch on offline data caching.
- Set the Cache Memory Size parameter to specify the memory cache size in megabytes, and the max allowed memory cache size is 1GB.
- Set the Cache Disk Size parameter to specify the disk cache size in megabytes, and the max allowed disk cache size is 10GB.
- Set the Cache Sync Interval parameter to specify the cache message synchronizing interval in milliseconds, and the max allowed cache sync interval is 120s.
TIP
The Offline Data Caching parameter is added since EMQX Neuron version 2.4.3. For older versions, you may disable offline data caching by setting both Cache Memory Size and Cache Disk Size to zero.
The following table gives some statistics on disk space usage for offline caching (using the Modbus TCP driver).
- The first column is the number of tags in each MQTT message.
- The second column is the MQTT message payload size in bytes for that many tags.
- The third column is the number of cached messages on disk.
- The fourth column is the resulting disk space usage in kilobytes.
| Tags / Message | Message Payload (Bytes) | Cached Messages | Used Disk Size (KB) |
|---|---|---|---|
| 10 | 219 | 100 | 64 |
| 10 | 219 | 1000 | 349 |
| 100 | 1284 | 100 | 228 |
| 100 | 1284 | 1000 | 2077 |
| 1000 | 12993 | 100 | 1401 |
| 1000 | 12993 | 1000 | 13427 |
TIP
This application configuration will automatically subscribe to multiple topics. It is recommended to configure the corresponding permissions for each topic on the MQTT Broker when configuring ACL, to ensure that the application can work properly.
Driver Status Report
The driver status reporting feature allows users to report the status of southbound drivers to a specified MQTT topic. To report driver status, set the Driver Status Report parameter to True and specify the Status Report Topic and Status Report Interval parameters. The reported data format is as follows:
{
	"timestamp": 1725583528917,
	"states": [{
		"node": "modbus1",
		"link": 1,
		"running": 3
	}, {
		"node": "s7-1200",
		"link": 0,
		"running": 3
	}, {
		"node": "opcua1",
		"link": 1,
		"running": 3
	}]
}
Where:
timestamp: Report timestamp, in milliseconds.states: Driver status list, each element contains the following fields:node: Southbound driver name.link: Driver connection status, 0 for disconnected, 1 for connected.running: Driver running status, 3 for running, 4 for stopped.
MQTT over SSL
SSL/TLS (Secure Sockets Layer/Transport Layer Security) is a security protocol used to encrypt communication channels between networked devices. It enables secure communication over an insecure network, such as the Internet. MQTT over SSL/TLS is a secure method for transmitting MQTT messages between the client and the MQTT broker by encrypting the data being transmitted with SSL/TLS encryption. This ensures that all data passed between the clients and the broker are encrypted and secure.
The EMQX Neuron MQTT application supports running MQTT over SSL. To enable SSL encryption, turn on the SSL parameter when configuring the node.
- If using self-signed certificates, the CA parameter should be provided with the server-side CA certificate. The certificate of the broker you are connecting to should be issued by the provided CA.
- If using two-way authentication, you should also provide the client certificate and key file through the Client Cert and Client Private key parameters respectively.
Connecting to EMQX Cloud
To connect to the managed MQTT service from EMQ, see EMQX Cloud for how the port, authentication, and TLS differ.
Add Subscription
After application configuration, data delivery can be enabled via southbound device subscriptions.
Click the device card or row on the North Apps page, then Add Subscription on the Group List page:
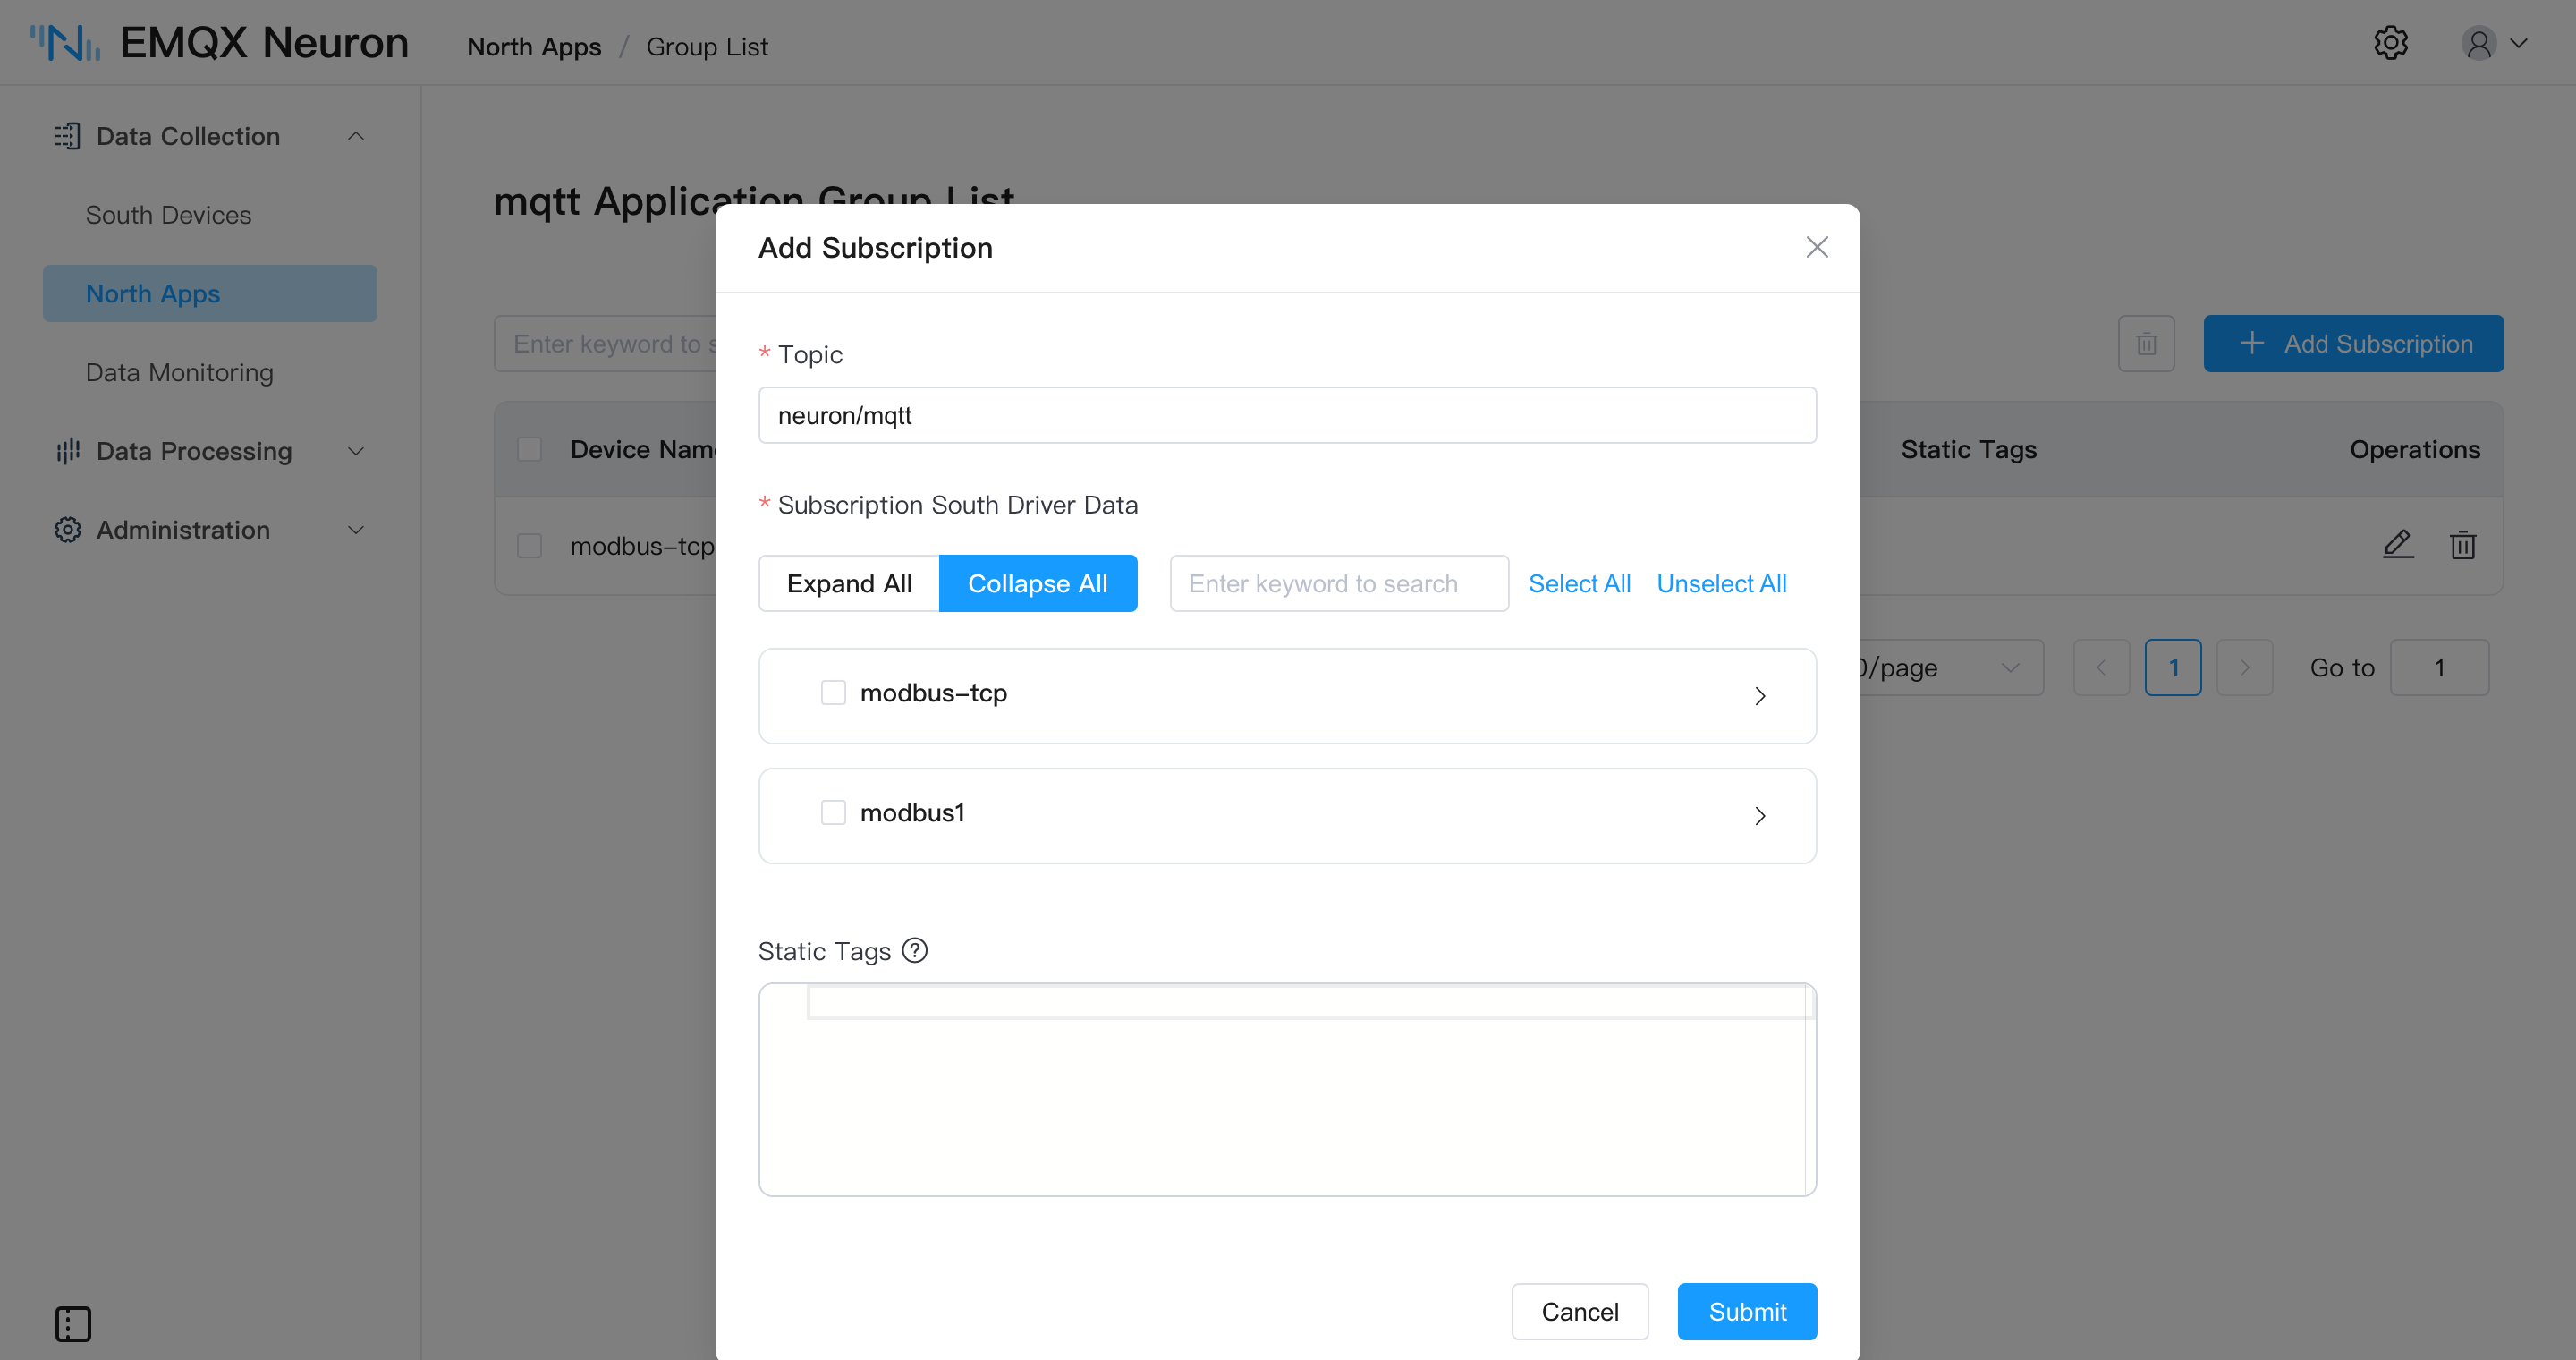
Fill in Topic to set the upload topic (for example /neuron/mqtt/upload); leave it blank to use the default. Under Subscription South Driver Data, expand a driver node and tick the collection groups to subscribe to — several at once is fine. For the fields, see Subscribe to Southbound Data.
The exact format of the data reported is controlled by the Upload Format parameter; see Upstream/Downstream Data Format.
Test the MQTT Application
This section will use the public EMQX Broker as an example to demonstrate how to use the MQTT application to forward the Modbus TCP data.
Southbound driver
The southbound Modbus TCP driver has been installed, the group and point configurations are complete, and communication with EMQX Neuron is functioning normally. For details on the installation and configuration of the Modbus TCP driver, refer to the Modbus TCP section.
Northbound Application
On Data Collection -> North Apps, click Add Application to add an MQTT client node.
Click the Application Configuration icon on the application card to enter the application configuration interface to set the MQTT connection, and set as follows:
- Client ID: Note that each ID should be independent of each other and cannot be repeated. Here will use the default value of mqtt;
- Qos level: Quality of Service, options: 0, 1, 2. Here will use 0.
- Broker Host: Use the default public EMQX Broker (broker.emqx.io);
- Broker Port: Use MQTT broker port(1883);
For the other fields, keep the default setting and click Submit to complete the configuration, and the application card will automatically enter the working state of Running.
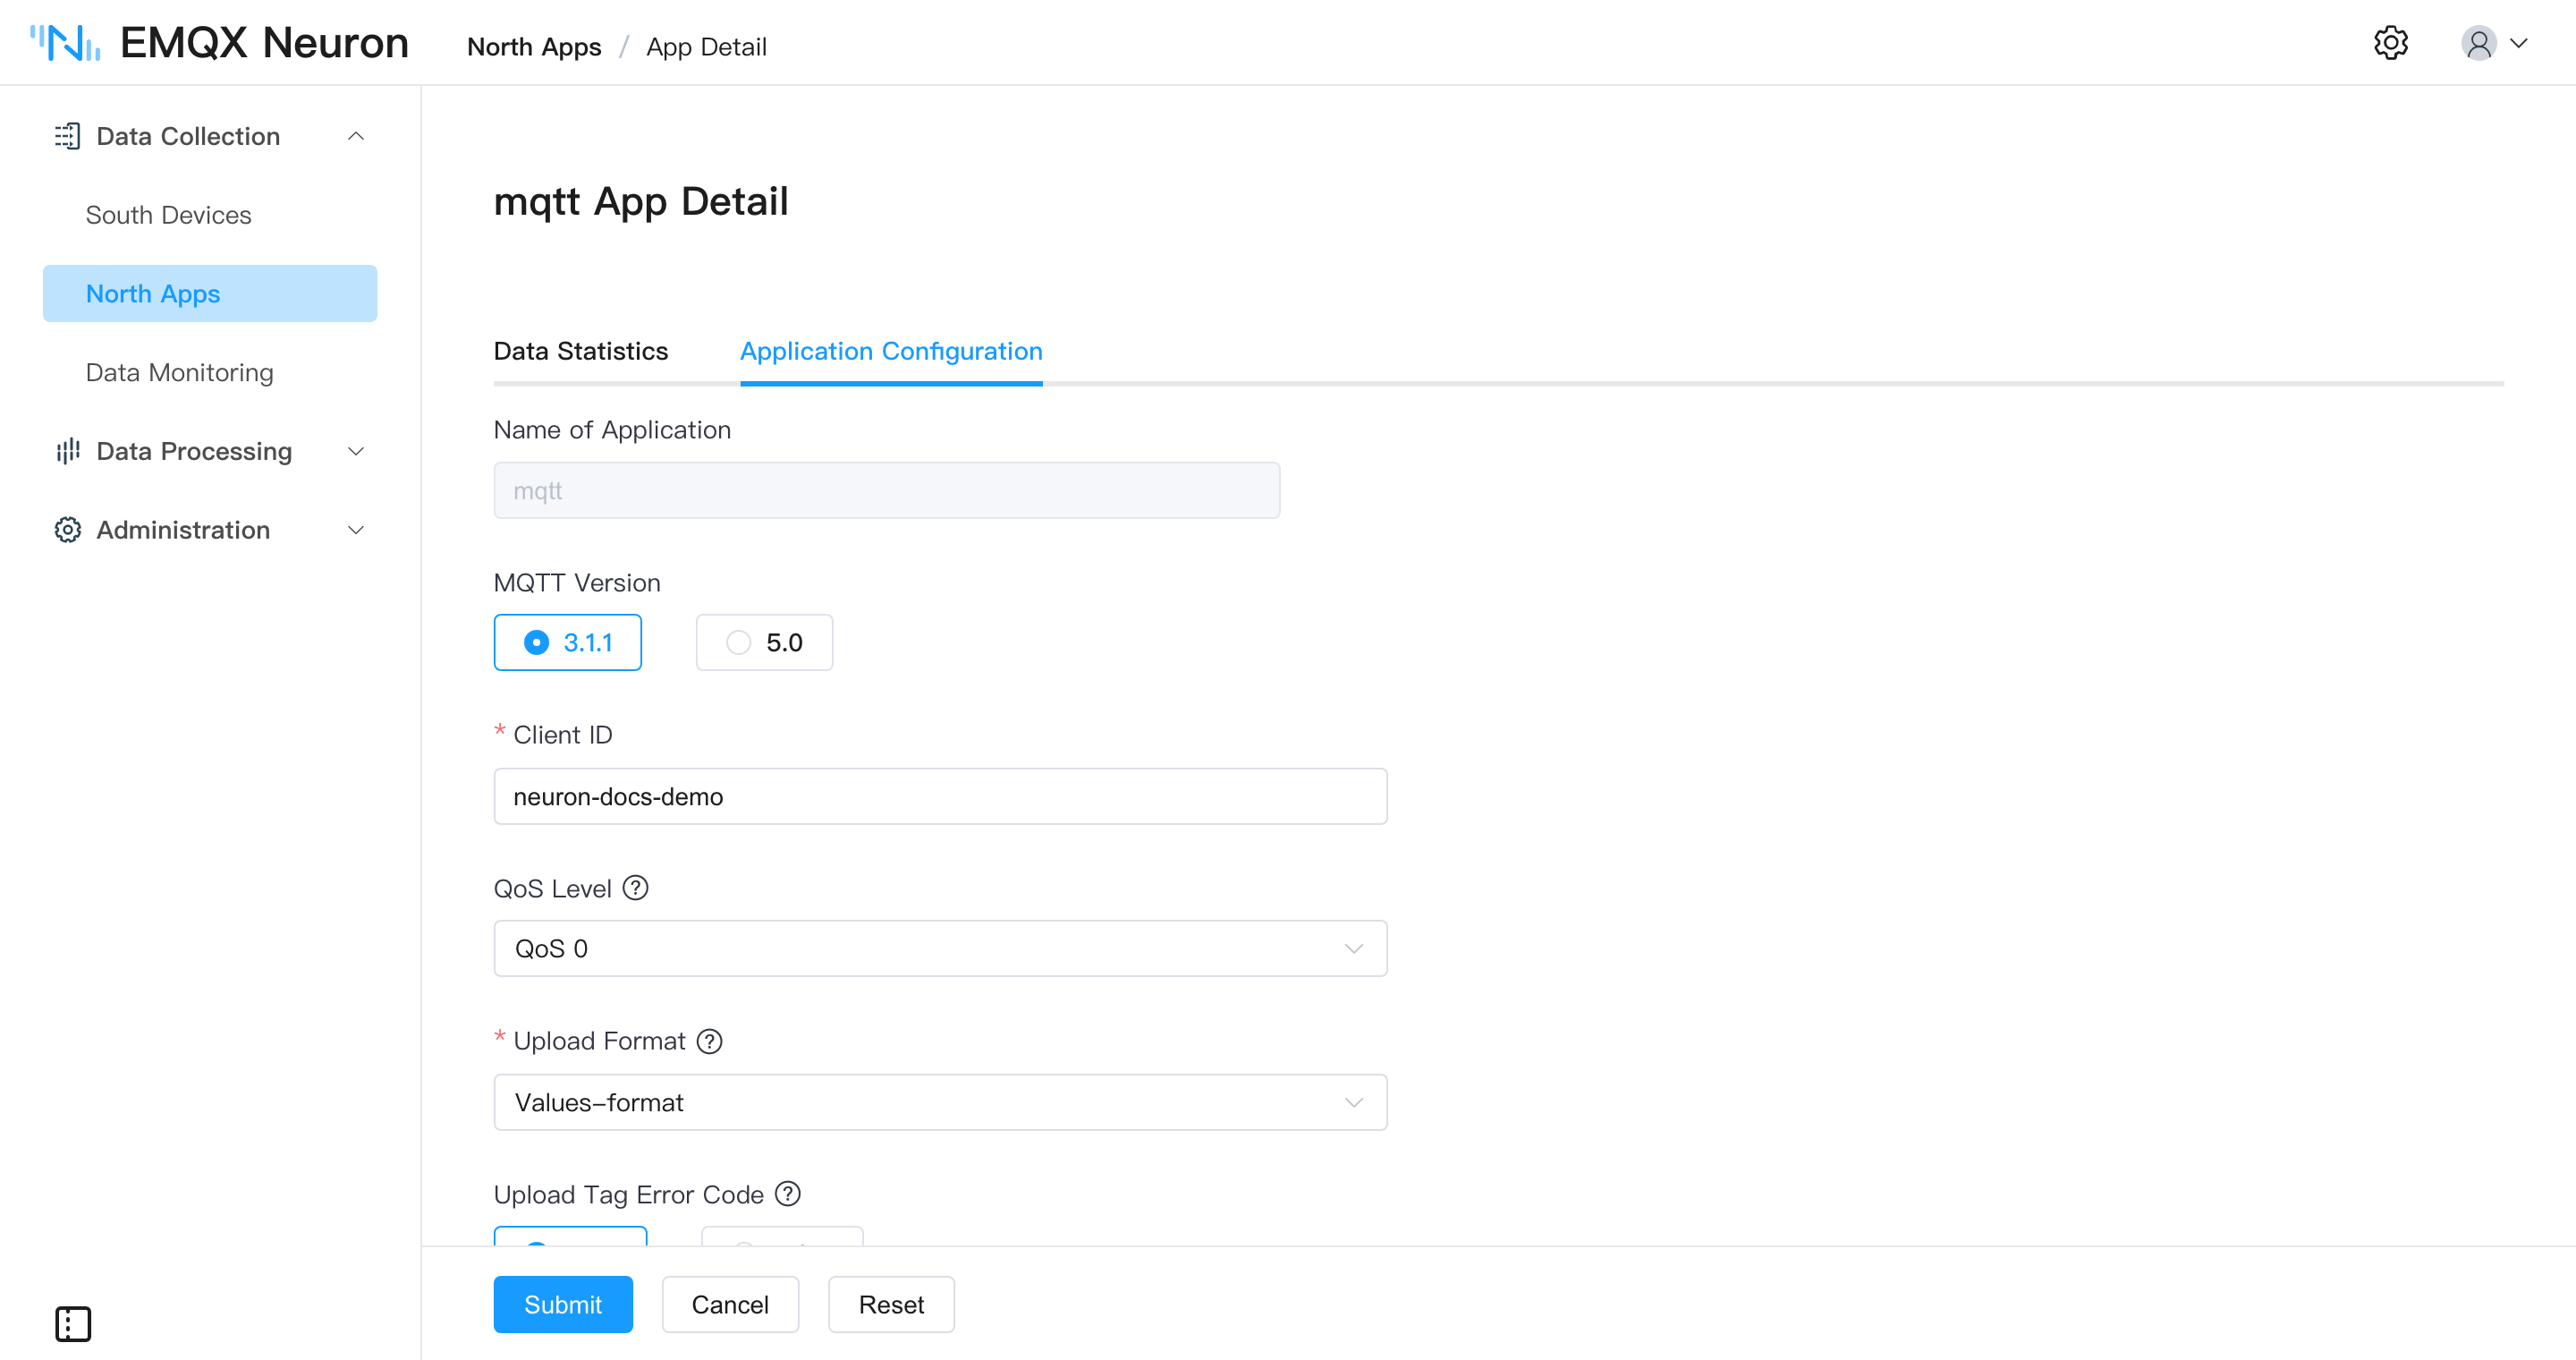
- Client-id: Note that each ID should be independent of each other and cannot be repeated. Use the default value of mqtt;
- Qos level: Quality of Service, divided into 0, 1, 2;
- Host: Use the default public EMQX Broker (broker.emqx.io);
- Port: Use MQTT broker port(1883);
- Click
Submitto complete the configuration of the northbound application, and the application card will automatically enter the working state of Running.
Use MQTTX to View Data
After the subscription is completed, you can use the MQTT client (MQTTX is recommended and can be downloaded from official website) to connect to the public EMQX proxy to view the reported data.
Establish Connection
In MQTTX, click New Connection and configure as follows:
- Name: Enter the connection name, for instance, "neuronmqtt".
- Host: Keep the default broker.emqx.io.
- Port: Maintain the default value, which is 1883.
- Leave other settings at their default values.
Then click Connect.
Adding Subscription
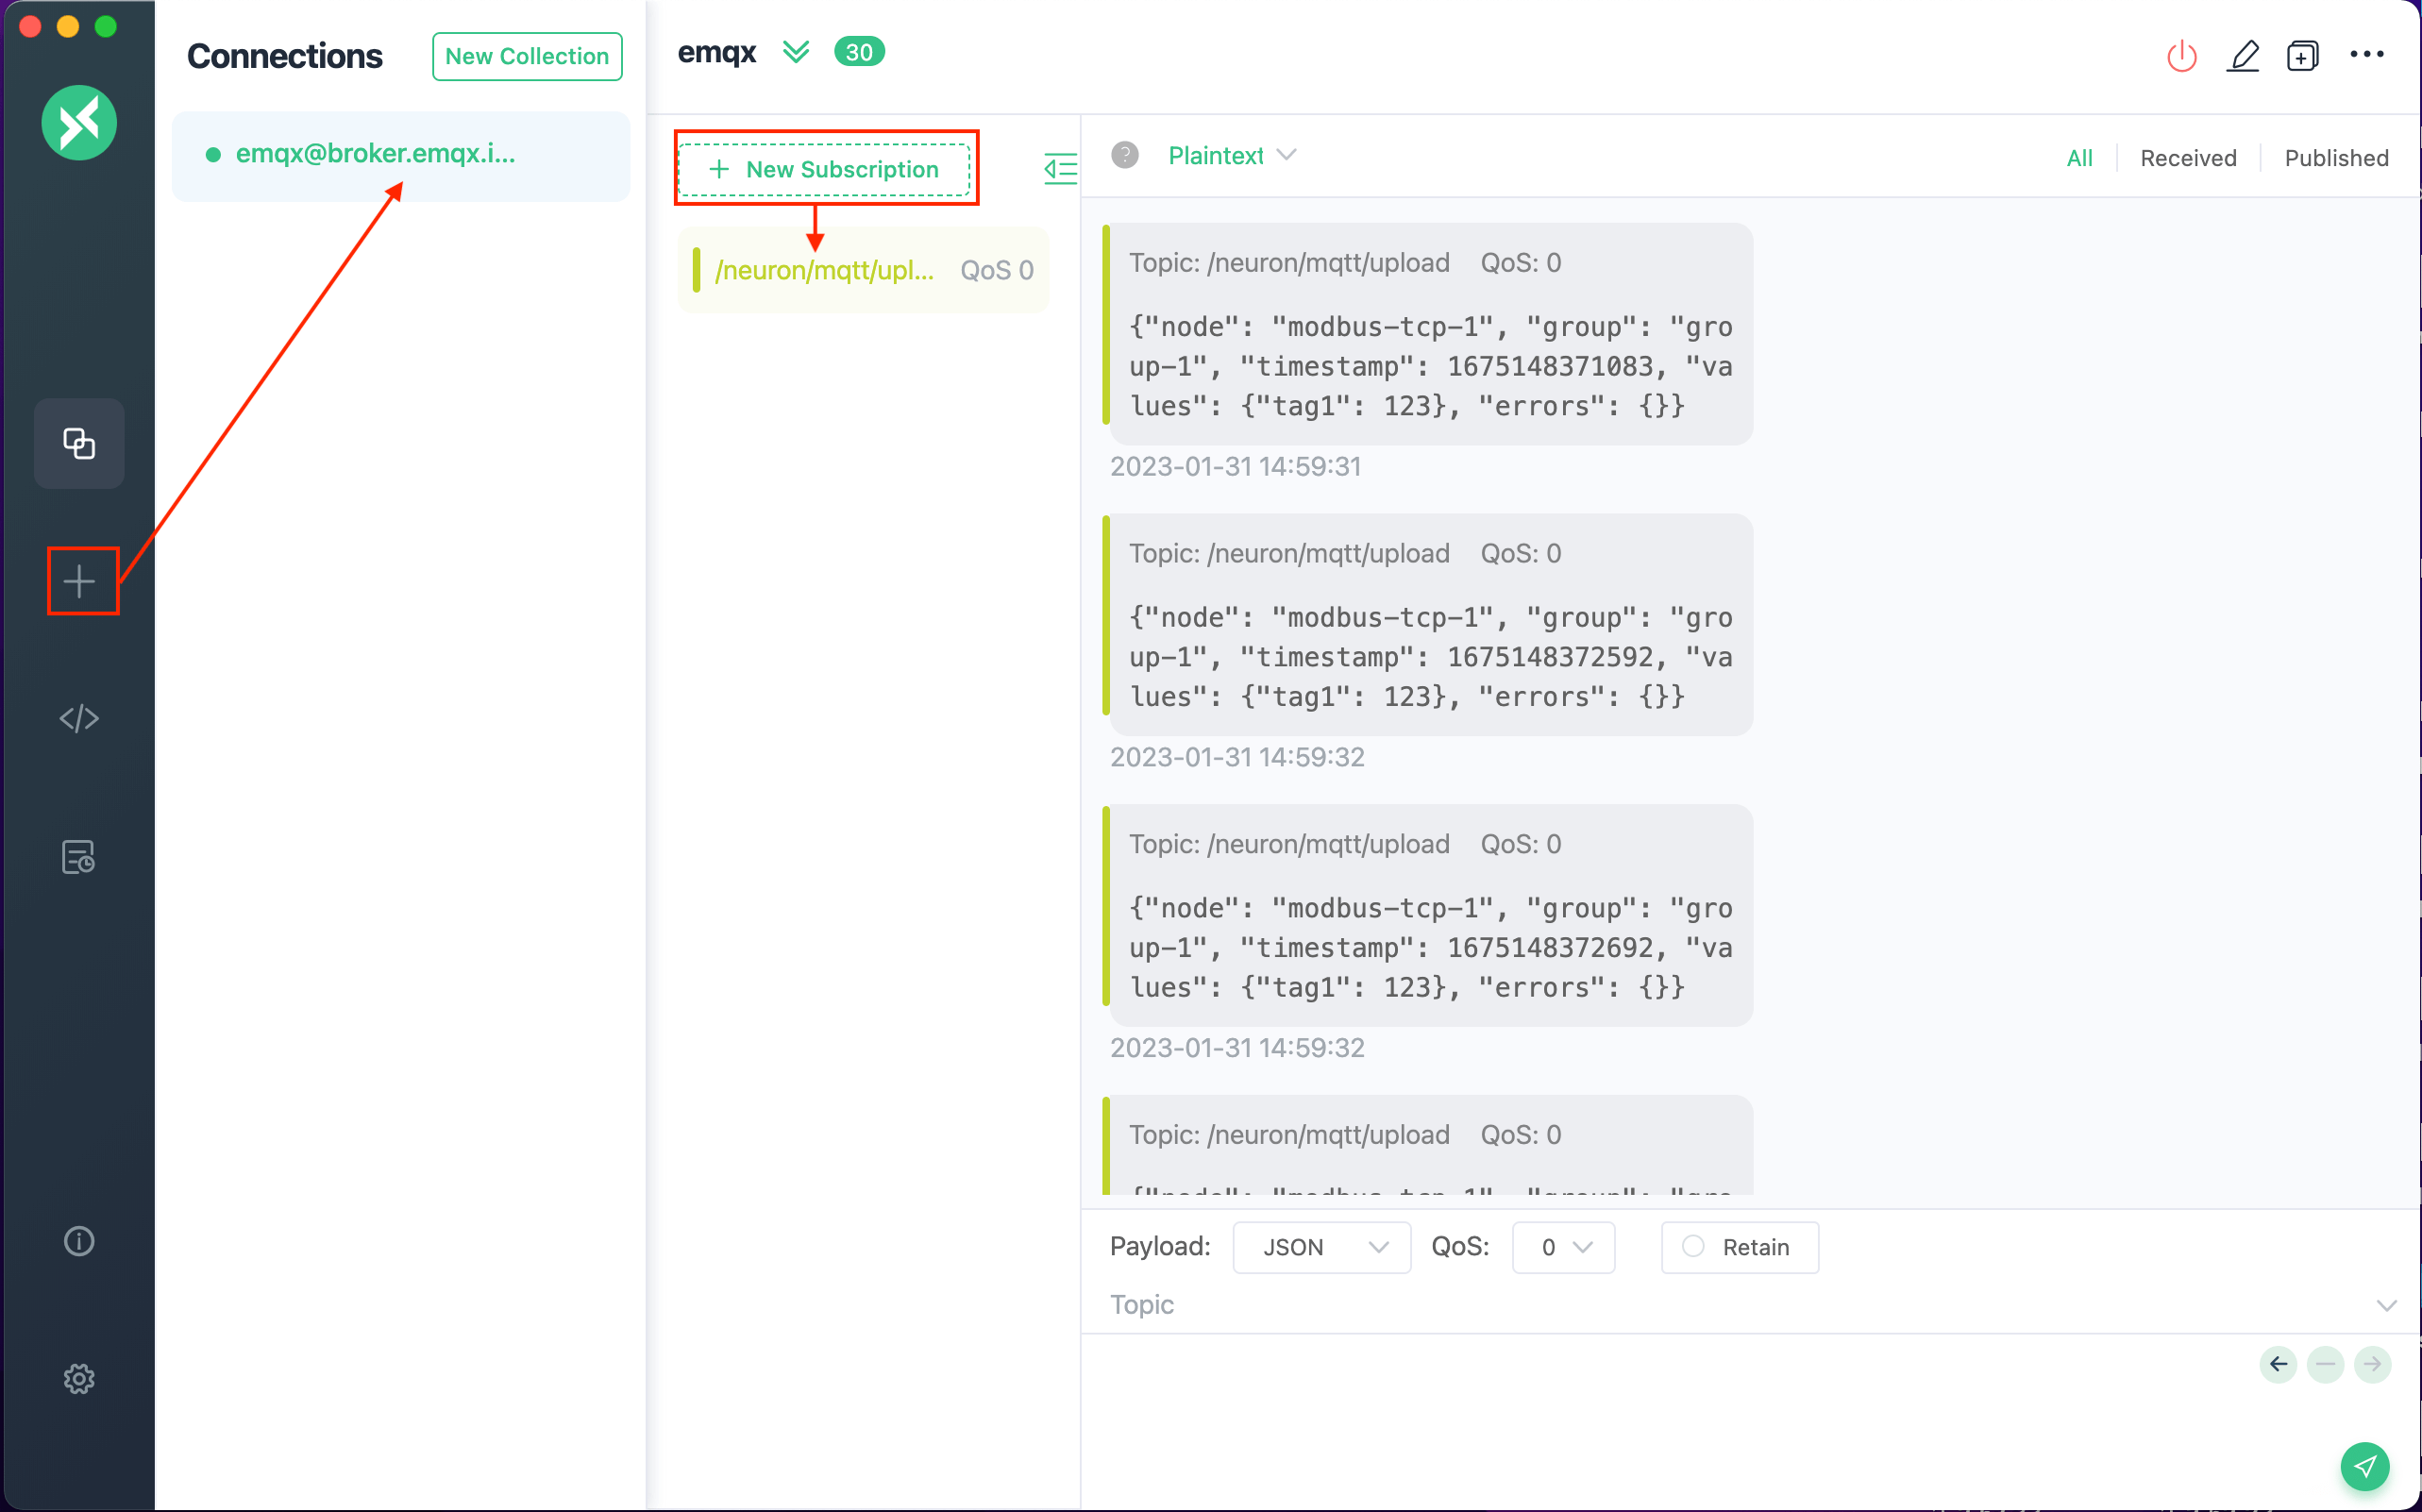
In the connection window, click New Subscription. In the pop-up window, set up as follows:
Topic: This should be consistent with the topic in Create and Configure a Northbound Application, for example, "/neuron/mqtt/upload".
TIP
Note: The default upload Topic format is "/neuron/{node_name}/upload", where {node_name} is the name of the created northbound application. Users can also customize the upload topic.
QoS: Keep the default value, which is 0.
Leave other settings at their default values.
At this point, we will be able to see the data forwarded by EMQX Neuron in MQTTX, as shown in the figure below.
Operation and Maintenance
On the device card or device row, you can click on the Data Statistics icon to review the application's operation status and track the data received and sent. For explanations on statistical fields, refer to the Create a Northbound Application section.
If there are any issues with device operation, you can click on the DEBUG log chart. The system will automatically print DEBUG level logs for that node and switch back to the system default log level after ten minutes. Later, you can click on Administration -> Logs to view logs and perform troubleshooting. For a detailed interpretation of system logs, see Managing Logs.