Create a Southbound Driver
A southbound driver is the protocol implementation between EMQX Neuron and a field device. One driver node corresponds to one device or one group of devices.
This page covers what is common to every driver: creating the node, reading its states, interpreting its runtime metrics, and diagnosing a connection that will not come up. For per-protocol connection parameters, supported data types, and address formats, see Southbound Drivers. To create many nodes or tags at once, see Bulk Configuration and Migration.
Add a driver node
On Data Collection → South Devices, click Add Device:
Field | Description |
|---|---|
| Name | Node name, unique within the instance, up to 128 characters |
| Driver | Selected by the protocol the device uses |
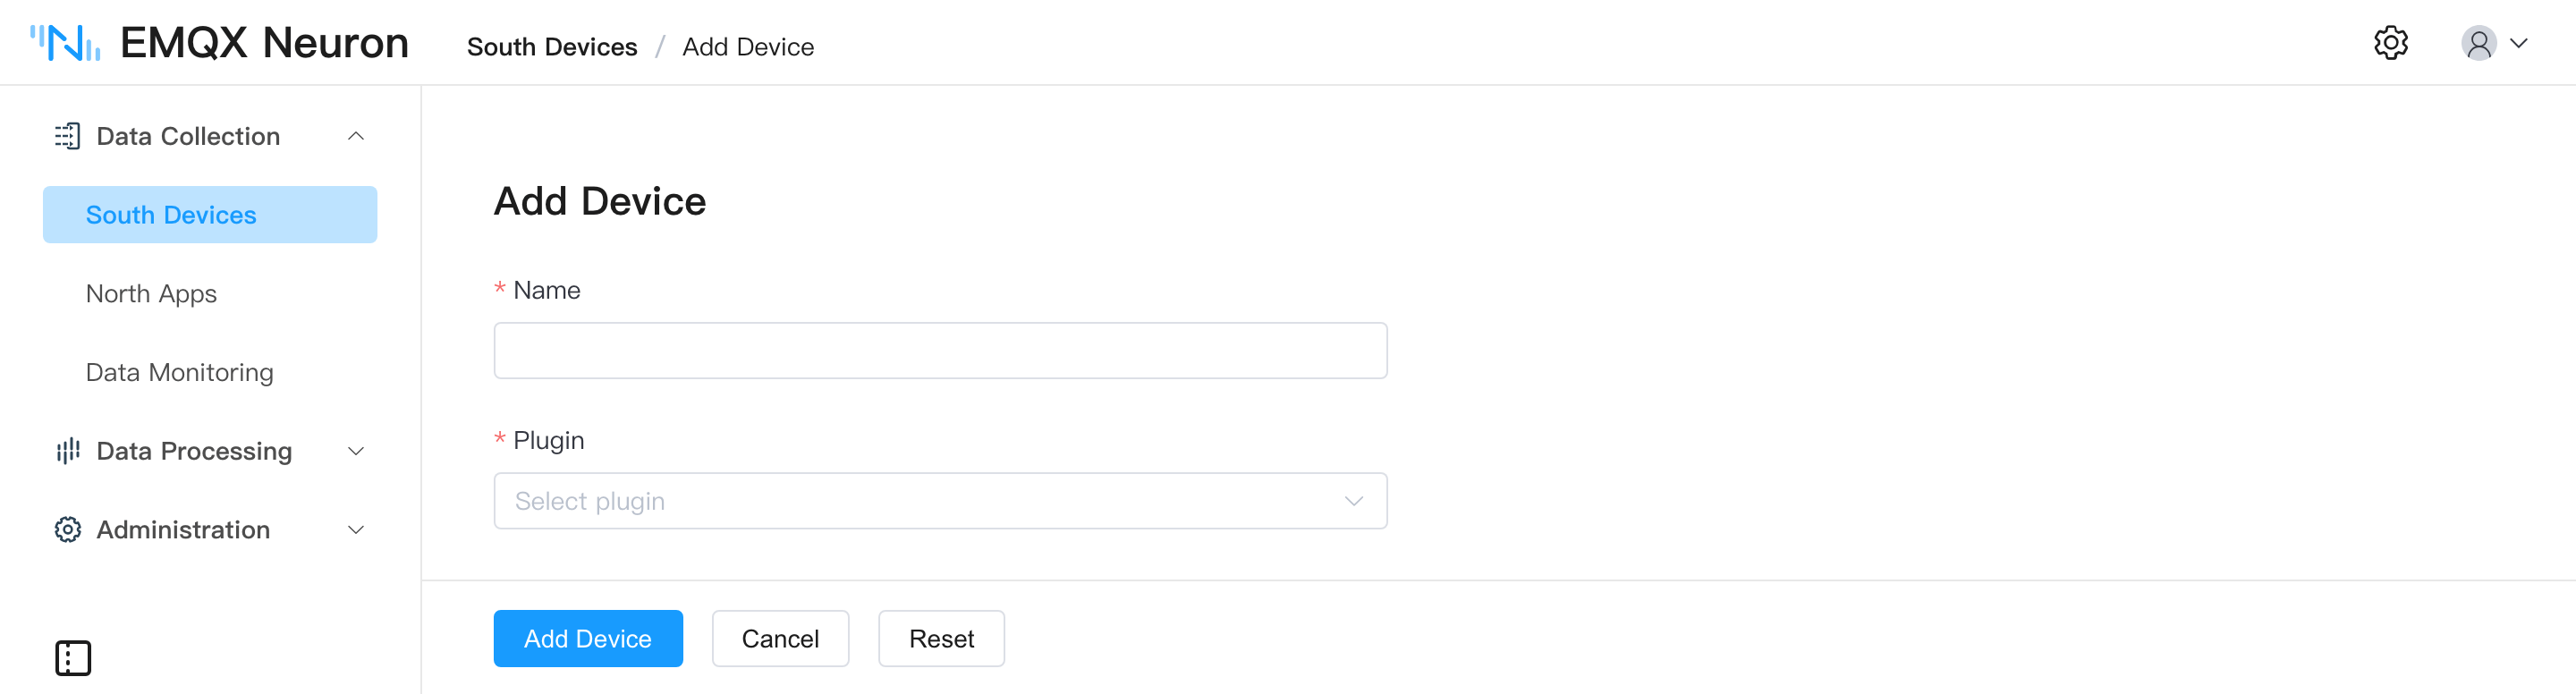
The node name appears in the default upload topic /neuron/{application}/{driver}/{group}, in OPC UA Server NodeIds, and in rule SQL. Use a stable identifier such as the device tag number rather than a temporary name.
Once created, the node appears on the South Devices page. Click its card to open Device Configuration and fill in the connection parameters, which differ per protocol.
Running state and link state
The two states are independent and are shown separately on the card.
| Running state | Meaning |
|---|---|
| Init | The node exists, but the driver has not finished initializing or the configuration is incomplete |
| Ready | The configuration passed validation but the node has not been started |
| Running | Started, issuing read commands at each group's polling interval |
| Stopped | Stopped manually; no commands are issued |
| Link state | Meaning |
|---|---|
| Connected | The link to the device is healthy and read commands are answered |
| Disconnected | The link is not established, or the device does not respond |
TIP
A newly created driver stays Disconnected until tags are configured. That is expected — EMQX Neuron only issues read requests once there are tags to collect.
The driver card
The toggle at the top right switches between card and list view; the list view is easier to scan when there are many nodes.
| Action | Purpose |
|---|---|
| Group List | Open the node's collection groups to configure groups and tags |
| Device Configuration | Change connection parameters |
| Edit Device | Rename the node |
| Data Statistics | Review collection volume, error counts, and link latency |
| Enable DEBUG log | Print command-level detail for this node; click again to turn it off |
| Download driver log | Export this node's log for offline analysis or a support ticket |
| Copy | Create a new node carrying the full configuration and tags — see Driver duplication |
| Running state toggle | On connects to the device and starts collecting; off disconnects |
| Delete | Delete the node together with all its groups and tags |
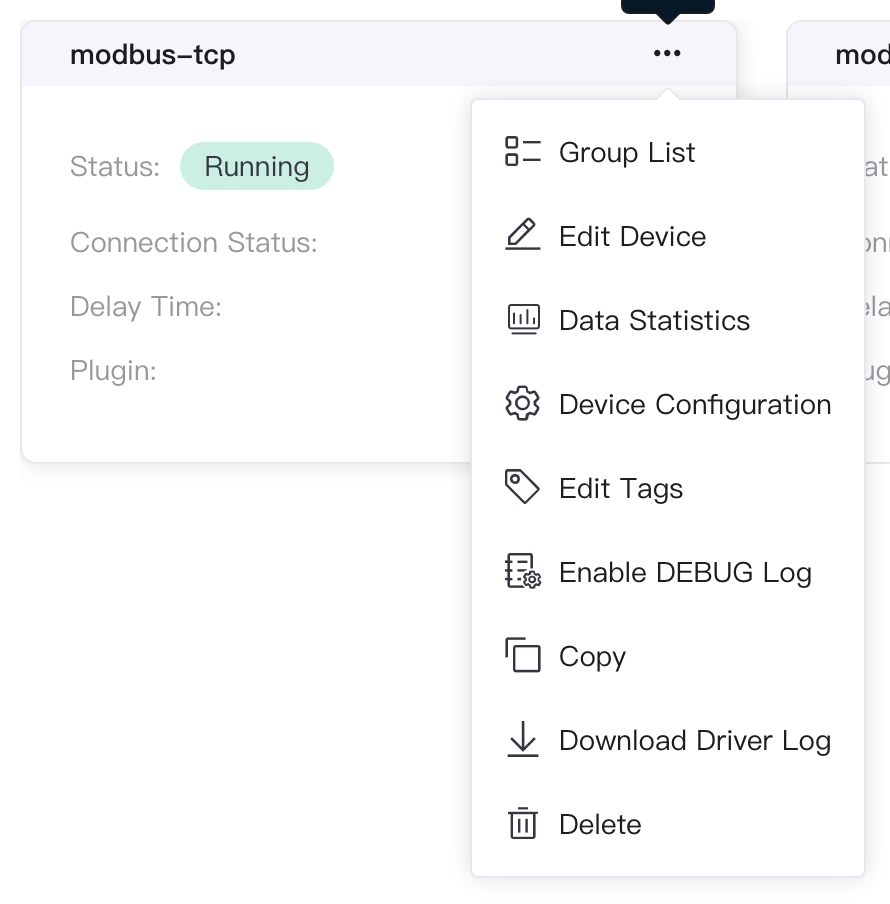
The card also shows the latency between sending and receiving a command, and the name of the driver in use.
Runtime statistics
Click Data Statistics on the card or row:
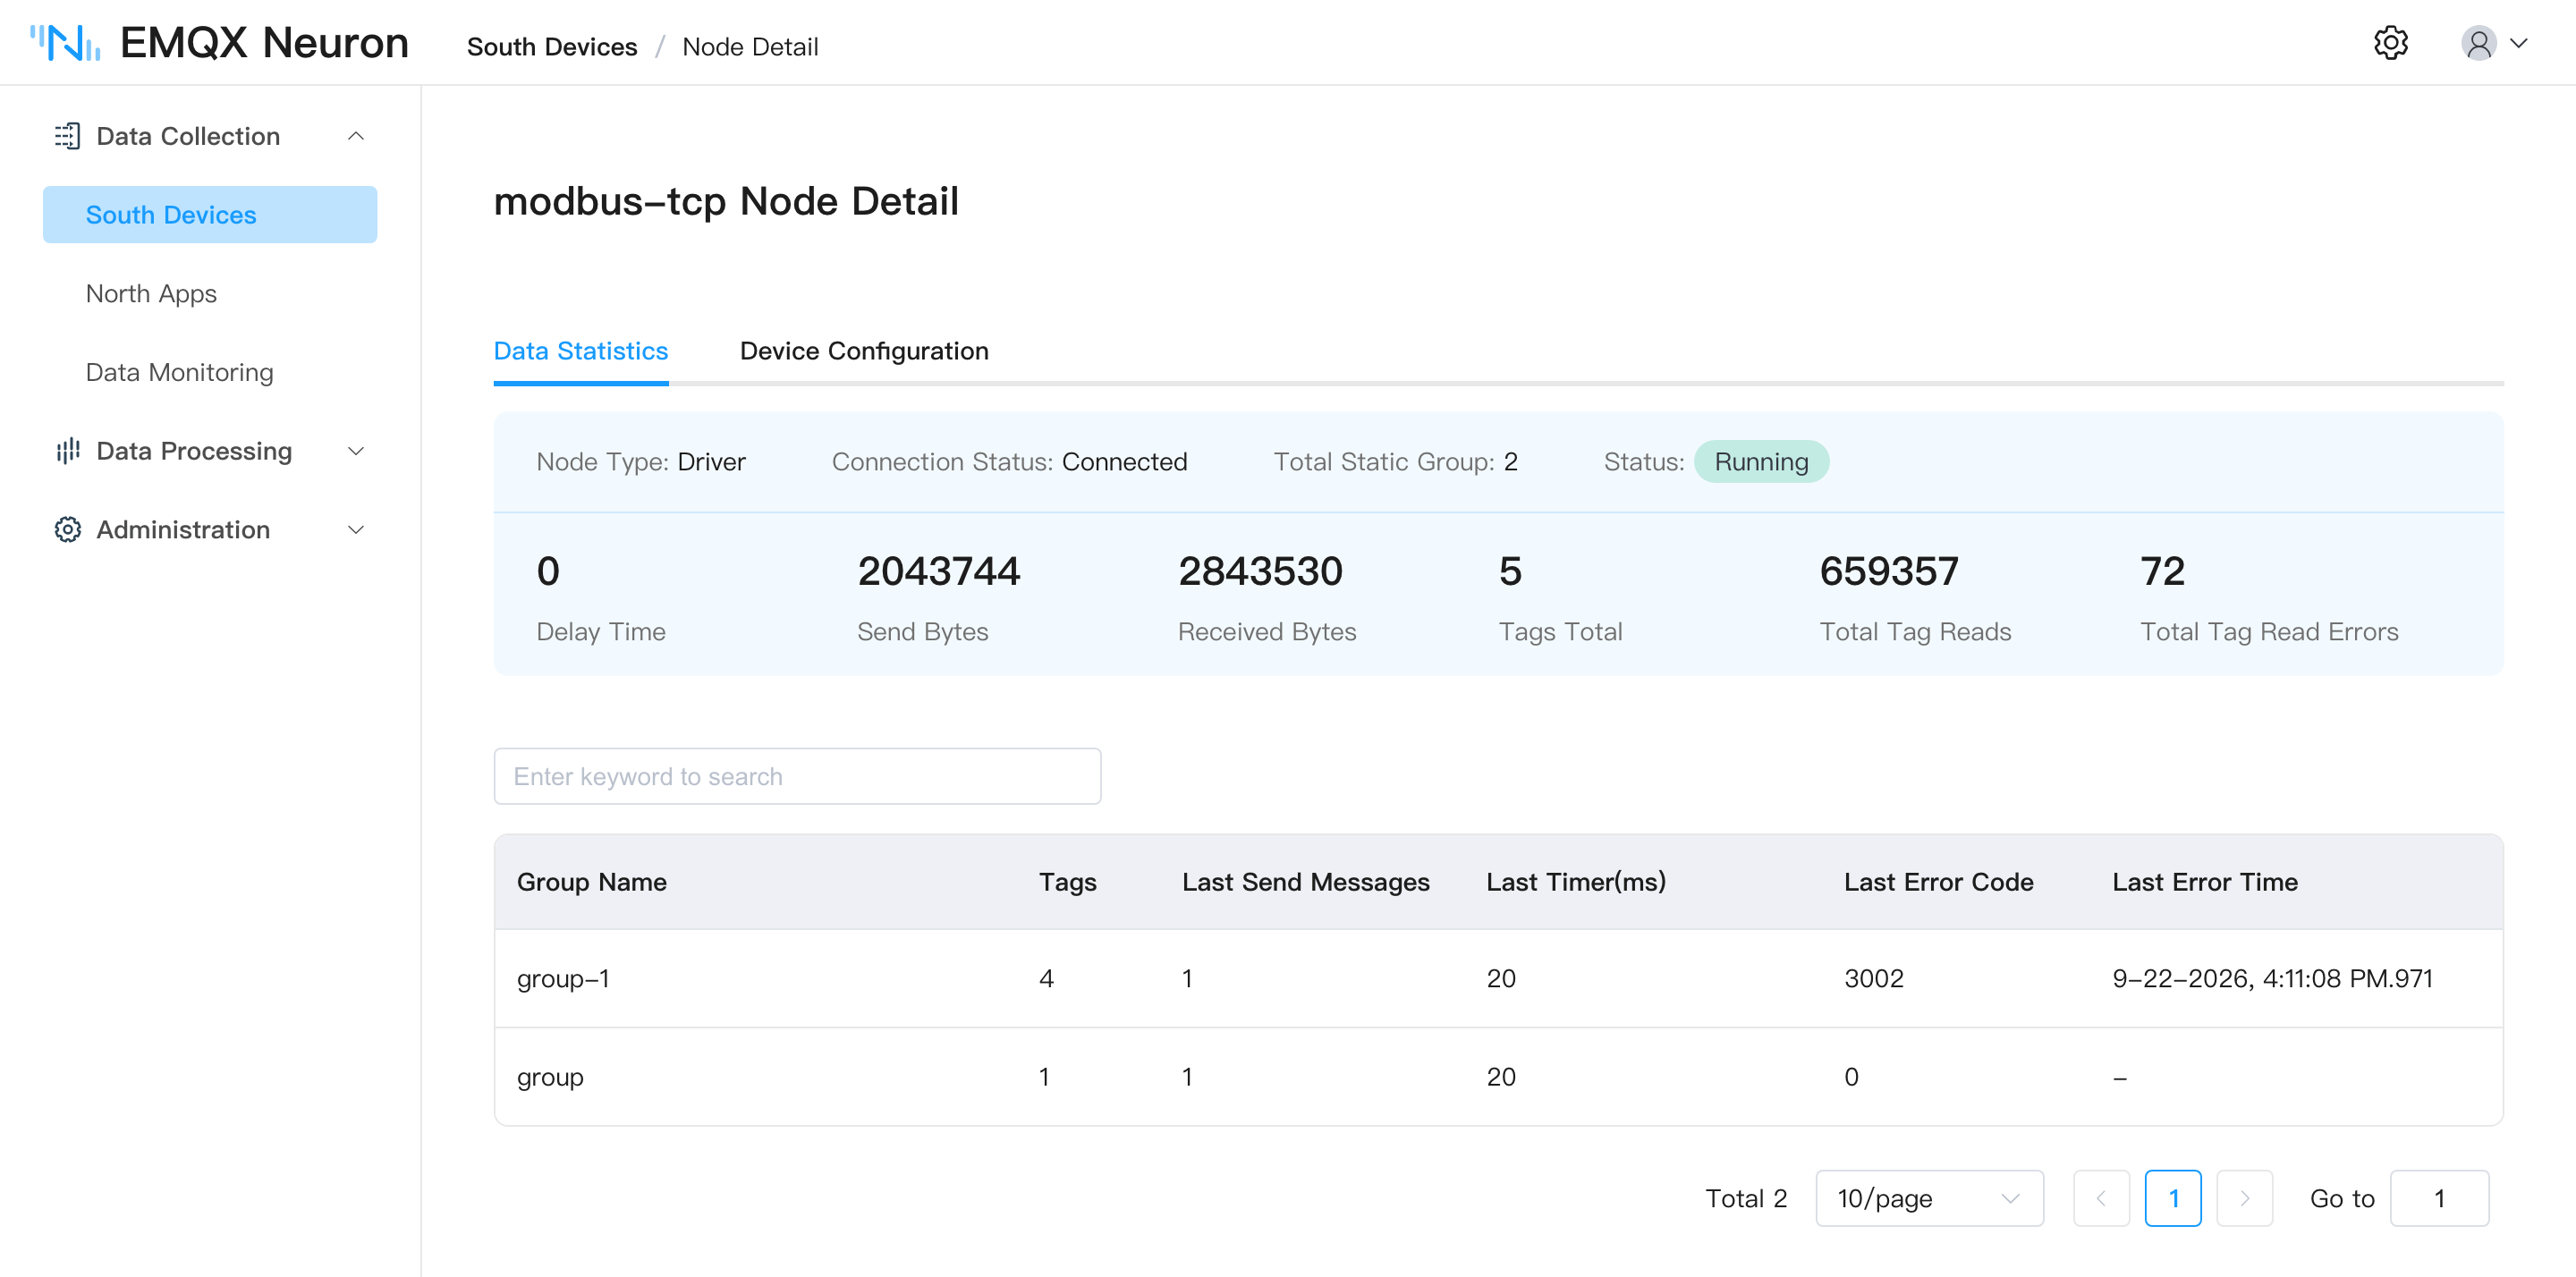
| Metric | Description | What an abnormal value indicates |
|---|---|---|
last_rtt_ms | Round-trip time of the most recent command, in milliseconds | Consistently high means the link or the device is slow; widen the group's polling interval |
tag_reads_total | Total read commands, including failures | — |
tag_read_errors_total | Failed read commands | A rising ratio against tag_reads_total usually means a wrong tag address, or an address the device does not support |
group_tags_total | Tags in the group | — |
group_last_send_msgs | Messages sent on one firing of the group timer | — |
group_last_timer_ms | Duration of one group timer cycle, in milliseconds | Approaching or exceeding the group's polling interval means the group holds too many tags; split it or widen the interval |
send_bytes / recv_bytes | Total bytes sent / received | — |
link_state | Link state: DISCONNECTED = 0, CONNECTED = 1 | — |
running_state | Node state: INIT = 1, READY = 2, RUNNING = 3, STOPPED = 4 | — |
Diagnosing a connection
When the link state stays Disconnected, work through the following.
1. Confirm the network is reachable
Run this on the EMQX Neuron host:
telnet <device IP> <port>For a container deployment, run it inside the container:
docker exec -it neuronex telnet <device IP> <port>2. Confirm tags exist With no tags, no read request is issued and the link stays disconnected.
3. Verify the connection parameters IP, port, slave ID, byte order, and start address (0-based or 1-based). A wrong byte order or start address can leave the link state as connected while the values collected are wrong.
4. Check device-side configuration Some protocols require a service or permission to be enabled on the device — Siemens S7, for example, needs PUT/GET enabled in the PLC and optimized block access turned off. See the relevant driver page.
5. Read the DEBUG log Click Enable DEBUG log on the card, then open Administration → Logs to see the commands actually exchanged. See Managing Logs.
6. Check firewalls Confirm the port is open on both the device side and the EMQX Neuron side.
Next steps
- Groups and Tags: organize collection groups, configure tag addresses, and shape the data
- Bulk Configuration and Migration: create many nodes or tags at once
- Data Monitoring and Device Control: confirm the collected values and write commands back to devices