KubernetesでEMQXログを収集する
目的
ELKを使用してEMQXクラスターのログを収集します。
ELKのデプロイ
ELKはElasticsearch、Logstash、Kibana(Elastic Stackとも呼ばれます)を指します:
- Elasticsearch:Luceneに基づく分散型のほぼリアルタイム検索および分析エンジンで、REST APIを通じてデータとやり取りします。
- Logstash:さまざまなソースからログを収集、変換、転送するための主要なデータフローエンジンです。
- Kibana:Elasticsearchのデータをリアルタイムで可視化・分析するためのWebインターフェースです。
シングルノードElasticsearchのデプロイ
シングルノードElasticsearchクラスターのデプロイは比較的簡単です。以下のYAML構成ファイルを使用して、迅速にElasticsearchクラスターをデプロイできます。
以下の内容をYAMLファイルとして保存し、
kubectl applyでデプロイします。yaml--- apiVersion: v1 kind: Service metadata: name: elasticsearch-logging namespace: kube-logging labels: k8s-app: elasticsearch kubernetes.io/cluster-service: "true" addonmanager.kubernetes.io/mode: Reconcile spec: ports: - port: 9200 protocol: TCP targetPort: db selector: k8s-app: elasticsearch --- apiVersion: v1 kind: ServiceAccount metadata: name: elasticsearch-logging namespace: kube-logging labels: k8s-app: elasticsearch kubernetes.io/cluster-service: "true" addonmanager.kubernetes.io/mode: Reconcile --- kind: ClusterRole apiVersion: rbac.authorization.k8s.io/v1 metadata: name: elasticsearch-logging labels: k8s-app: elasticsearch kubernetes.io/cluster-service: "true" addonmanager.kubernetes.io/mode: Reconcile rules: - apiGroups: - "" resources: - "services" - "namespaces" - "endpoints" verbs: - "get" --- kind: ClusterRoleBinding apiVersion: rbac.authorization.k8s.io/v1 metadata: namespace: kube-logging name: elasticsearch-logging labels: k8s-app: elasticsearch kubernetes.io/cluster-service: "true" addonmanager.kubernetes.io/mode: Reconcile subjects: - kind: ServiceAccount name: elasticsearch-logging namespace: kube-logging apiGroup: "" roleRef: kind: ClusterRole name: elasticsearch apiGroup: "" --- apiVersion: apps/v1 kind: StatefulSet metadata: name: elasticsearch-logging namespace: kube-logging labels: k8s-app: elasticsearch kubernetes.io/cluster-service: "true" addonmanager.kubernetes.io/mode: Reconcile spec: serviceName: elasticsearch-logging replicas: 1 selector: matchLabels: k8s-app: elasticsearch template: metadata: labels: k8s-app: elasticsearch spec: serviceAccountName: elasticsearch-logging containers: - image: docker.io/library/elasticsearch:7.9.3 name: elasticsearch-logging resources: limits: cpu: 1000m memory: 1Gi requests: cpu: 100m memory: 500Mi ports: - containerPort: 9200 name: db protocol: TCP - containerPort: 9300 name: transport protocol: TCP volumeMounts: - name: elasticsearch-logging mountPath: /usr/share/elasticsearch/data/ env: - name: "NAMESPACE" valueFrom: fieldRef: fieldPath: metadata.namespace - name: "discovery.type" value: "single-node" - name: ES_JAVA_OPTS value: "-Xms512m -Xmx2g" # Elasticsearchはvm.max_map_countを少なくとも262144に設定する必要があります。 # OSがすでにこれより高い値に設定している場合は、このinitコンテナを削除して構いません。 initContainers: - name: elasticsearch-logging-init image: alpine:3.6 command: ["/sbin/sysctl", "-w", "vm.max_map_count=262144"] securityContext: privileged: true - name: increase-fd-ulimit image: busybox imagePullPolicy: IfNotPresent command: ["sh", "-c", "ulimit -n 65536"] securityContext: privileged: true - name: elasticsearch-volume-init image: alpine:3.6 command: -chmod - -R - "777" - /usr/share/elasticsearch/data/ volumeMounts: - name: elasticsearch-logging mountPath: /usr/share/elasticsearch/data/ volumeClaimTemplates: - metadata: name: elasticsearch-logging spec: storageClassName: ${storageClassName} accessModes: [ "ReadWriteOnce" ] resources: requests: storage: 10GiTIP
storageClassNameフィールドで適切なStorageClassを選択してください。kubectl get storageclassコマンドでKubernetesクラスターに存在するStorageClassを一覧表示できます。必要に応じてStorageClassを作成してください。Elasticsearchの準備が完了するまで待ちます。
kubectl getコマンドでElasticsearchのPodの状態を確認し、STATUSがRunningであることを確認してください。bash$ kubectl get pod -n kube-logging -l "k8s-app=elasticsearch" NAME READY STATUS RESTARTS AGE elasticsearch-0 1/1 Running 0 16m
Kibanaのデプロイ
この手順では、収集したログを可視化するためにDeploymentでKibanaをデプロイし、NodePortタイプのServiceでKibanaを外部に公開します。
以下の内容をYAMLファイルとして保存し、
kubectl applyでデプロイします。yaml--- apiVersion: v1 kind: Service metadata: name: kibana namespace: kube-logging labels: k8s-app: kibana spec: type: NodePort ports: - port: 5601 nodePort: 35601 protocol: TCP targetPort: ui selector: k8s-app: kibana --- apiVersion: apps/v1 kind: Deployment metadata: name: kibana namespace: kube-logging labels: k8s-app: kibana kubernetes.io/cluster-service: "true" addonmanager.kubernetes.io/mode: Reconcile spec: replicas: 1 selector: matchLabels: k8s-app: kibana template: metadata: labels: k8s-app: kibana annotations: seccomp.security.alpha.kubernetes.io/pod: 'docker/default' spec: containers: - name: kibana image: docker.io/kubeimages/kibana:7.9.3 resources: limits: cpu: 1000m requests: cpu: 100m env: # Elasticsearchのアクセスアドレス - name: ELASTICSEARCH_HOSTS value: http://elasticsearch-logging:9200 ports: - containerPort: 5601 name: ui protocol: TCPKibanaの準備が完了するまで待ちます。
kubectl getコマンドでKibanaのPodの状態を確認し、STATUSがRunningであることを確認してください。bash$ kubectl get pod -n kube-logging -l "k8s-app=kibana" NAME READY STATUS RESTARTS AGE kibana-b7d98644-48gtm 1/1 Running 0 17mブラウザで
http://{node_ip}:35601にアクセスし、KibanaのWebインターフェースを開きます。
Filebeatのデプロイ
FilebeatはElastic Stackの一部であり、軽量なログ収集コンポーネントです。Logstash、Elasticsearch、Kibanaとシームレスに連携します。
以下の内容をYAMLファイルとして保存し、
kubectl applyでデプロイします。yaml--- apiVersion: v1 kind: ConfigMap metadata: name: filebeat-config namespace: kube-logging labels: k8s-app: filebeat data: filebeat.yml: |- filebeat.inputs: - type: container paths: # ホスト上のEMQXコンテナのログパス - /var/log/containers/^emqx.*.log processors: - add_kubernetes_metadata: host: ${NODE_NAME} matchers: - logs_path: logs_path: "/var/log/containers/" output.logstash: hosts: ["logstash:5044"] enabled: true --- apiVersion: v1 kind: ServiceAccount metadata: name: filebeat namespace: kube-logging labels: k8s-app: filebeat --- apiVersion: rbac.authorization.k8s.io/v1beta1 kind: ClusterRole metadata: name: filebeat labels: k8s-app: filebeat rules: - apiGroups: [""] resources: - namespaces - pods verbs: - get - watch - list --- apiVersion: rbac.authorization.k8s.io/v1beta1 kind: ClusterRoleBinding metadata: name: filebeat subjects: - kind: ServiceAccount name: filebeat namespace: kube-logging roleRef: kind: ClusterRole name: filebeat apiGroup: rbac.authorization.k8s.io --- apiVersion: apps/v1 kind: DaemonSet metadata: name: filebeat namespace: kube-logging labels: k8s-app: filebeat spec: selector: matchLabels: k8s-app: filebeat template: metadata: labels: k8s-app: filebeat spec: serviceAccountName: filebeat terminationGracePeriodSeconds: 30 containers: - name: filebeat image: docker.io/kubeimages/filebeat:7.9.3 args: [ "-c", "/etc/filebeat.yml", "-e","-httpprof","0.0.0.0:6060" ] env: - name: NODE_NAME valueFrom: fieldRef: fieldPath: spec.nodeName - name: ELASTICSEARCH_HOST value: elasticsearch - name: ELASTICSEARCH_PORT value: "9200" securityContext: runAsUser: 0 resources: limits: memory: 1000Mi cpu: 1000m requests: memory: 100Mi cpu: 100m volumeMounts: - name: config mountPath: /etc/filebeat.yml readOnly: true subPath: filebeat.yml - name: data mountPath: /usr/share/filebeat/data - name: varlibdockercontainers mountPath: /data/var/ readOnly: true - name: varlog mountPath: /var/log/ readOnly: true - name: timezone mountPath: /etc/localtime volumes: - name: config configMap: defaultMode: 0600 name: filebeat-config - name: varlibdockercontainers hostPath: path: /data/var/ - name: varlog hostPath: path: /var/log/ - name: inputs configMap: defaultMode: 0600 name: filebeat-inputs - name: data hostPath: path: /data/filebeat-data type: DirectoryOrCreate - name: timezone hostPath: path: /etc/localtimeFilebeatの準備が完了するまで待ちます。
kubectl getコマンドでFilebeatのPodの状態を確認し、STATUSがRunningであることを確認してください。bash$ kubectl get pod -n kube-logging -l "k8s-app=filebeat" NAME READY STATUS RESTARTS AGE filebeat-82d2b 1/1 Running 0 45m filebeat-vwrjn 1/1 Running 0 45m
Logstashのデプロイ
Logstashはログの処理と整形に使用します。
この手順では、LogstashのBeats Inputプラグインを使ってログを収集し、Rubyフィルタープラグインでログをフィルタリングします。Logstashは他にも多くの入力・フィルタリングプラグインを提供しており、ビジネスニーズに応じて設定可能です。
以下の内容をYAMLファイルとして保存し、
kubectl applyでデプロイします。yaml--- apiVersion: v1 kind: Service metadata: name: logstash namespace: kube-logging spec: ports: - port: 5044 targetPort: beats selector: k8s-app: logstash clusterIP: None --- apiVersion: apps/v1 kind: Deployment metadata: name: logstash namespace: kube-logging spec: selector: matchLabels: k8s-app: logstash template: metadata: labels: k8s-app: logstash spec: containers: - image: docker.io/kubeimages/logstash:7.9.3 name: logstash ports: - containerPort: 5044 name: beats command: - logstash - '-f' - '/etc/logstash_c/logstash.conf' env: - name: "XPACK_MONITORING_ELASTICSEARCH_HOSTS" value: "http://elasticsearch-logging:9200" volumeMounts: - name: config-volume mountPath: /etc/logstash_c/ - name: config-yml-volume mountPath: /usr/share/logstash/config/ - name: timezone mountPath: /etc/localtime resources: limits: cpu: 1000m memory: 2048Mi requests: cpu: 512m memory: 512Mi volumes: - name: config-volume configMap: name: logstash-conf items: - key: logstash.conf path: logstash.conf - name: timezone hostPath: path: /etc/localtime - name: config-yml-volume configMap: name: logstash-yml items: - key: logstash.yml path: logstash.yml --- apiVersion: v1 kind: ConfigMap metadata: name: logstash-conf namespace: kube-logging labels: k8s-app: logstash data: logstash.conf: |- input { beats { port => 5044 } } filter { ruby { code => " ss = event.get('message').split(' ') len = ss.length() level = '' index = '' msg = '' if len == 0 || len < 2 event.set('level','invalid') return end if ss[1][0] == '[' l = ss[1].length() level = ss[1][1..l-2] index = 2 else level = 'info' index = 0 end event.set('level',level) for i in ss[index..len] msg = msg + i msg = msg + ' ' end event.set('message',msg) " } if [level] == "invalid" { drop {} } } output { elasticsearch { hosts => ["http://elasticsearch-logging:9200"] codec => json index => "logstash-%{+YYYY.MM.dd}" } } --- apiVersion: v1 kind: ConfigMap metadata: name: logstash-yml namespace: kube-logging labels: k8s-app: logstash data: logstash.yml: |- http.host: "0.0.0.0" xpack.monitoring.elasticsearch.hosts: http://elasticsearch-logging:9200Logstashの準備が完了するまで待ちます。
kubectl getコマンドでLogstashのPodの状態を確認し、STATUSがRunningであることを確認してください。bash$ kubectl get pod -n kube-logging -l "k8s-app=logstash" NAME READY STATUS RESTARTS AGE filebeat-82d2b 1/1 Running 0 45m filebeat-vwrjn 1/1 Running 0 45m
EMQXクラスターのデプロイ
EMQXクラスターのデプロイについては、ドキュメントDeploy EMQXを参照してください。
ログ収集の確認
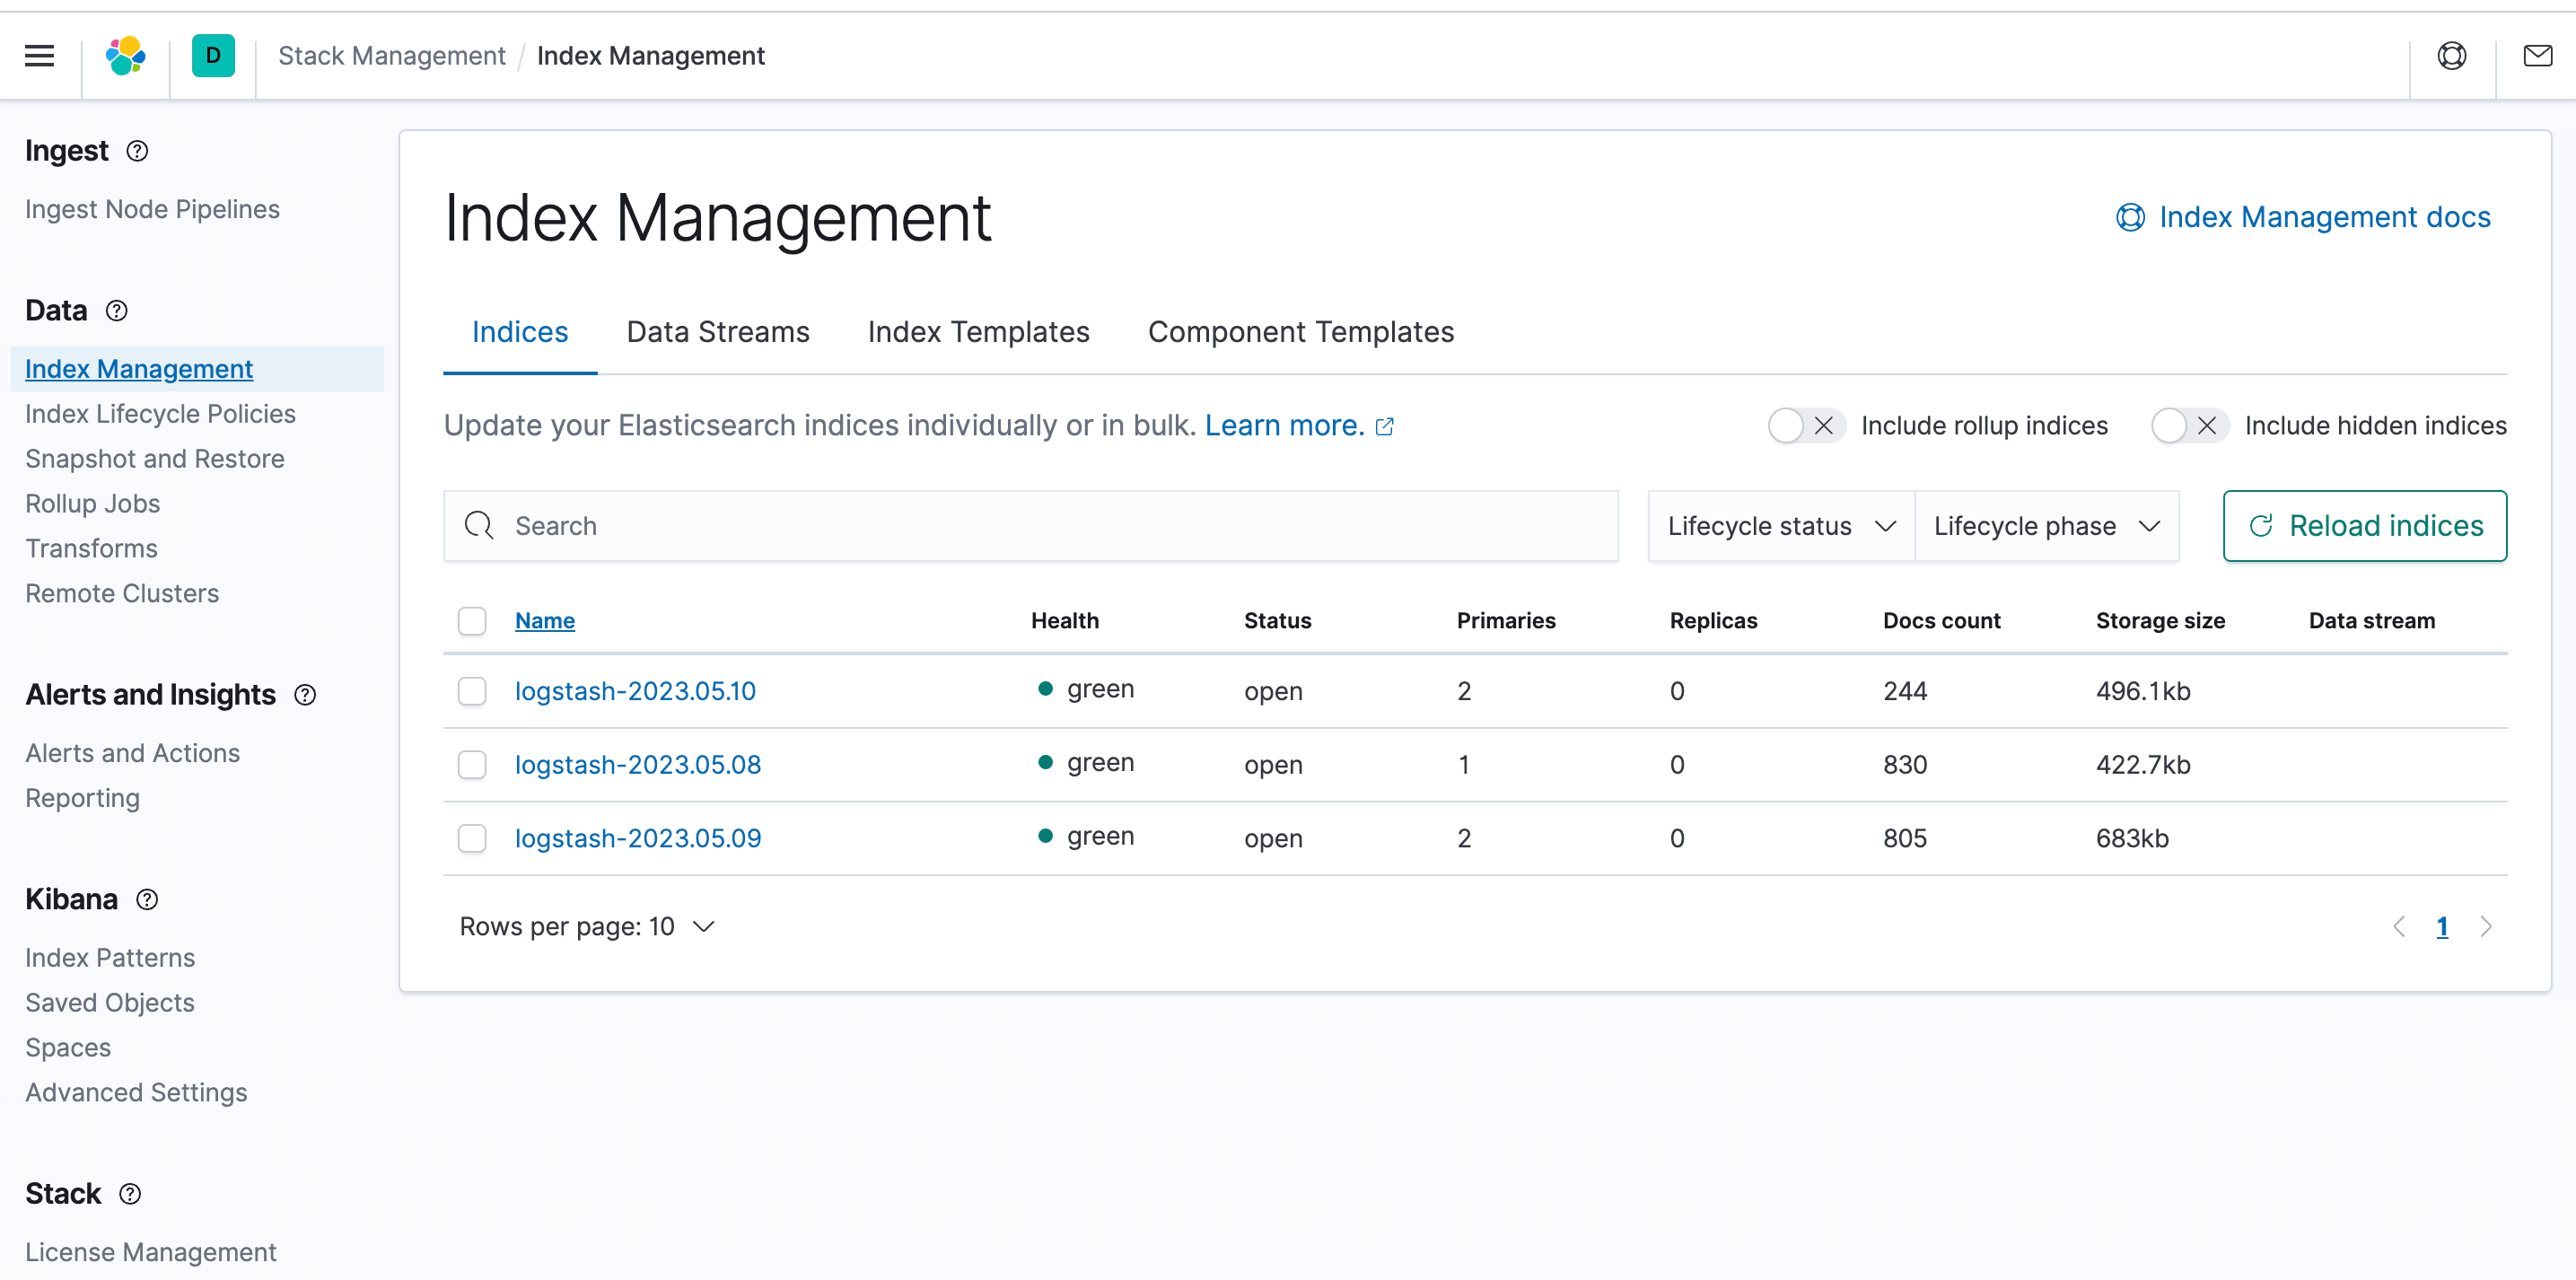
Kibanaインターフェースにログインし、メニューのスタック管理モジュールを開いて、_Index Management_をクリックします。ログのインデックスがすでに収集されていることが確認できます。
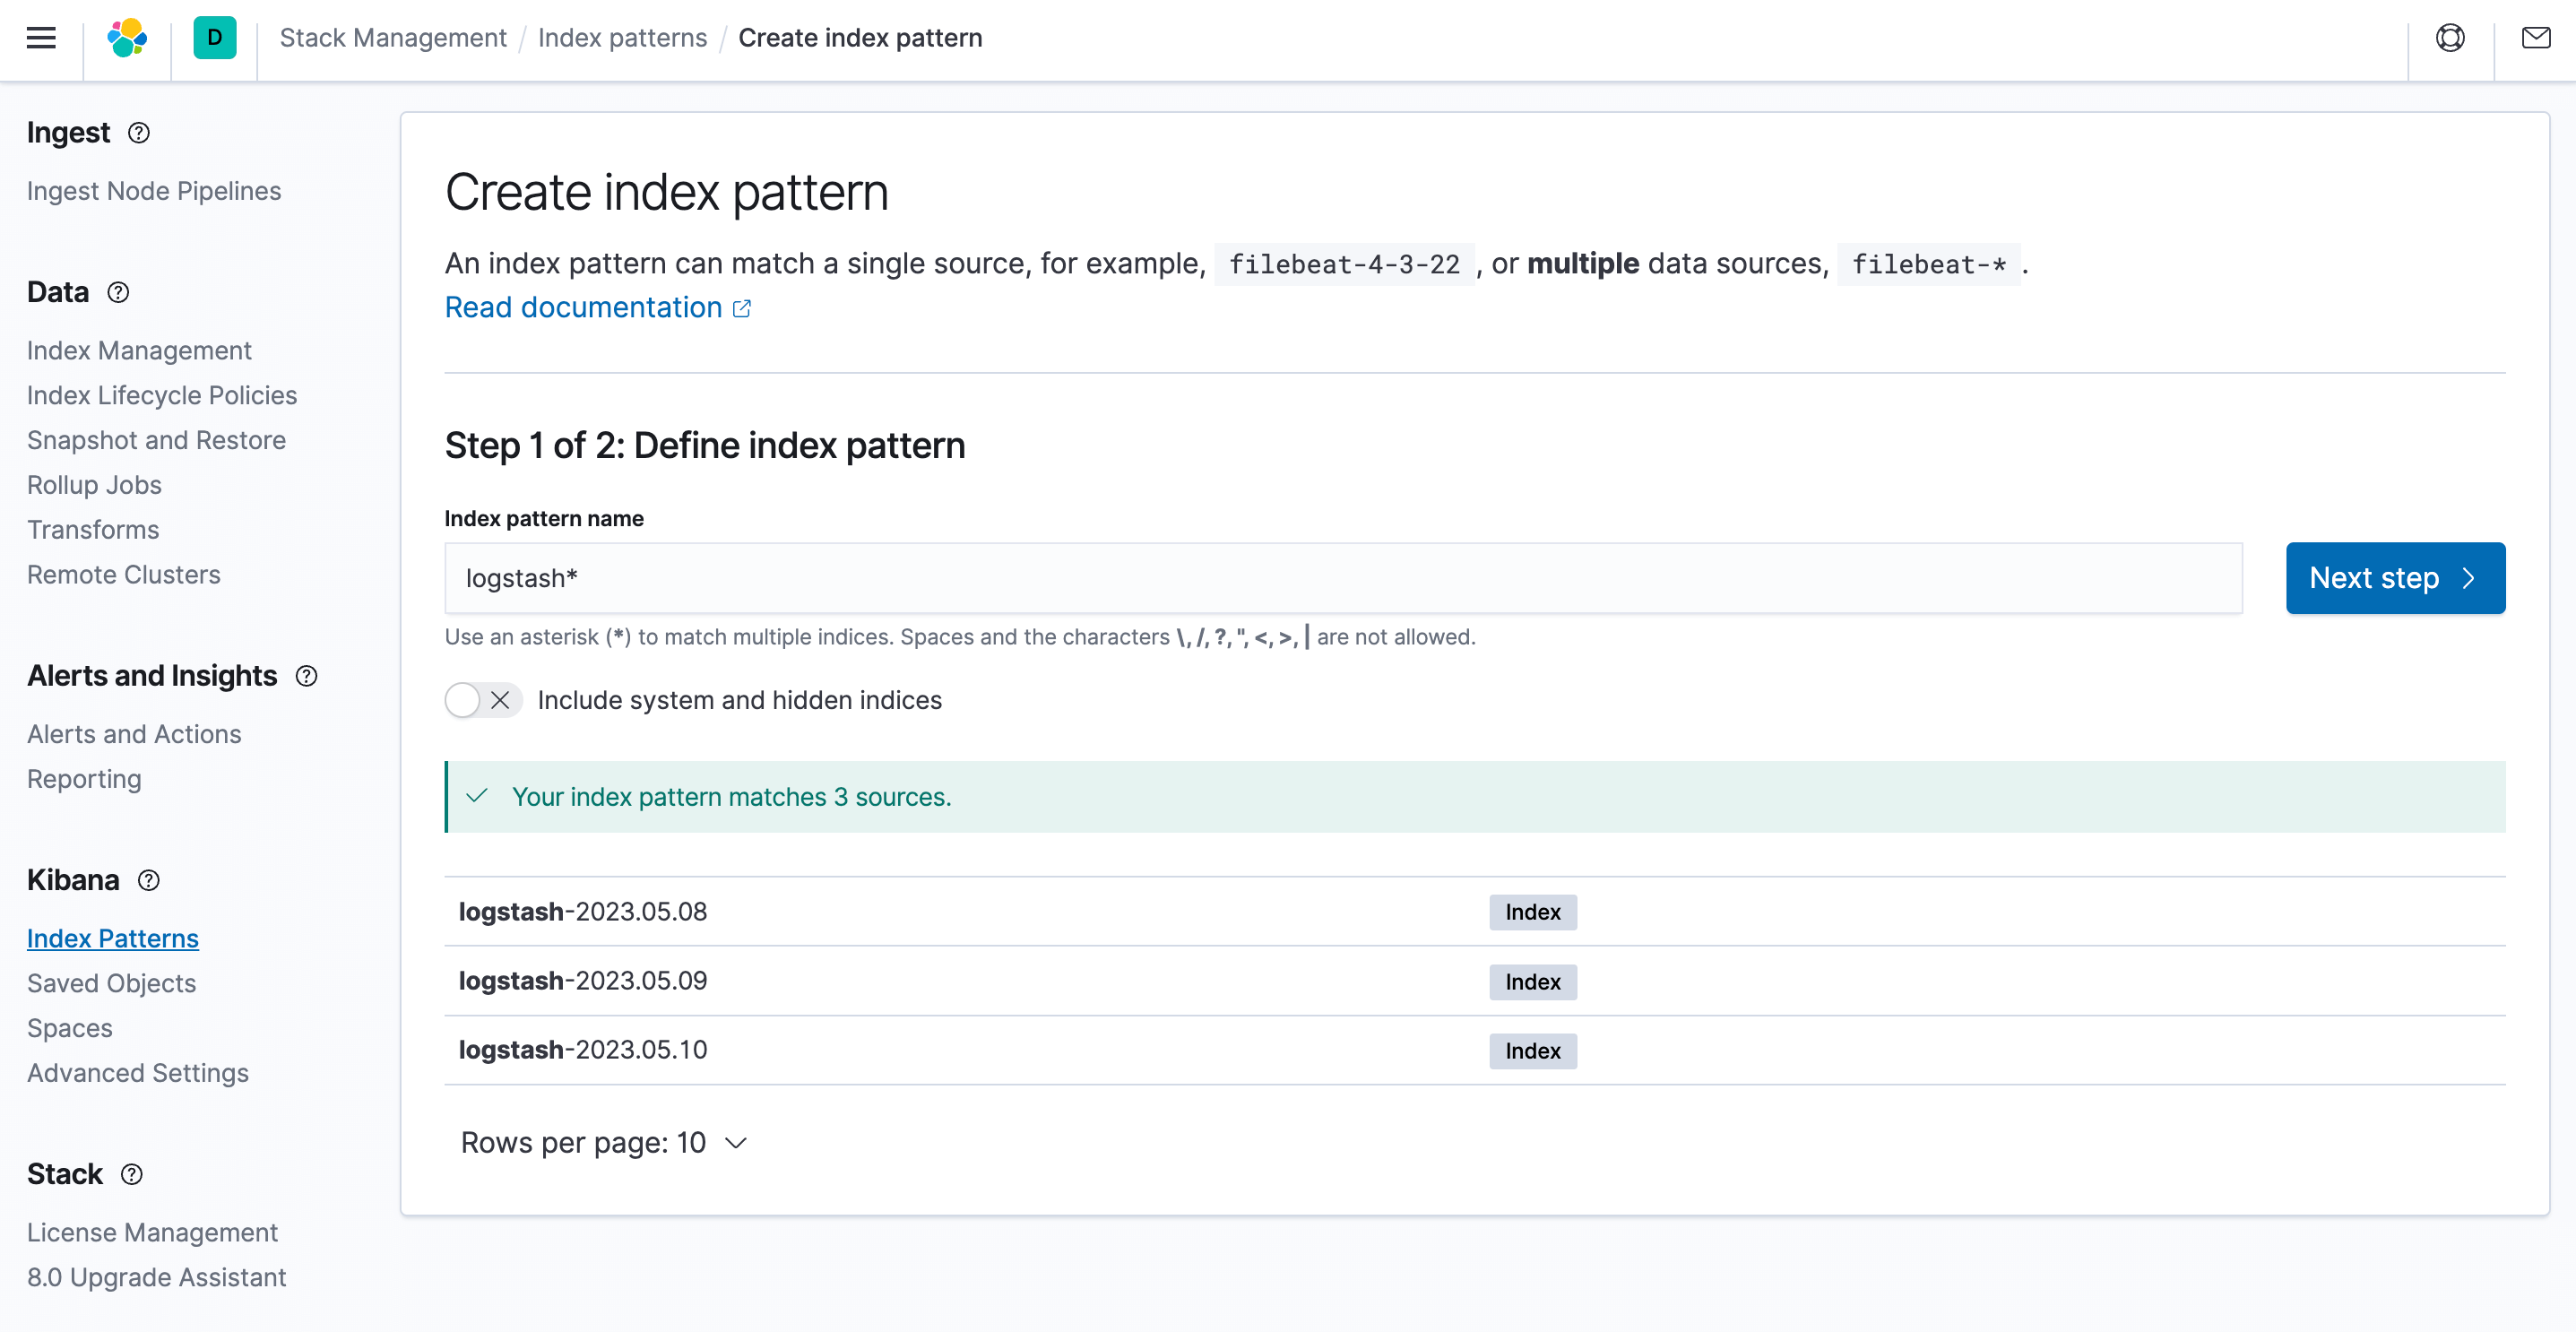
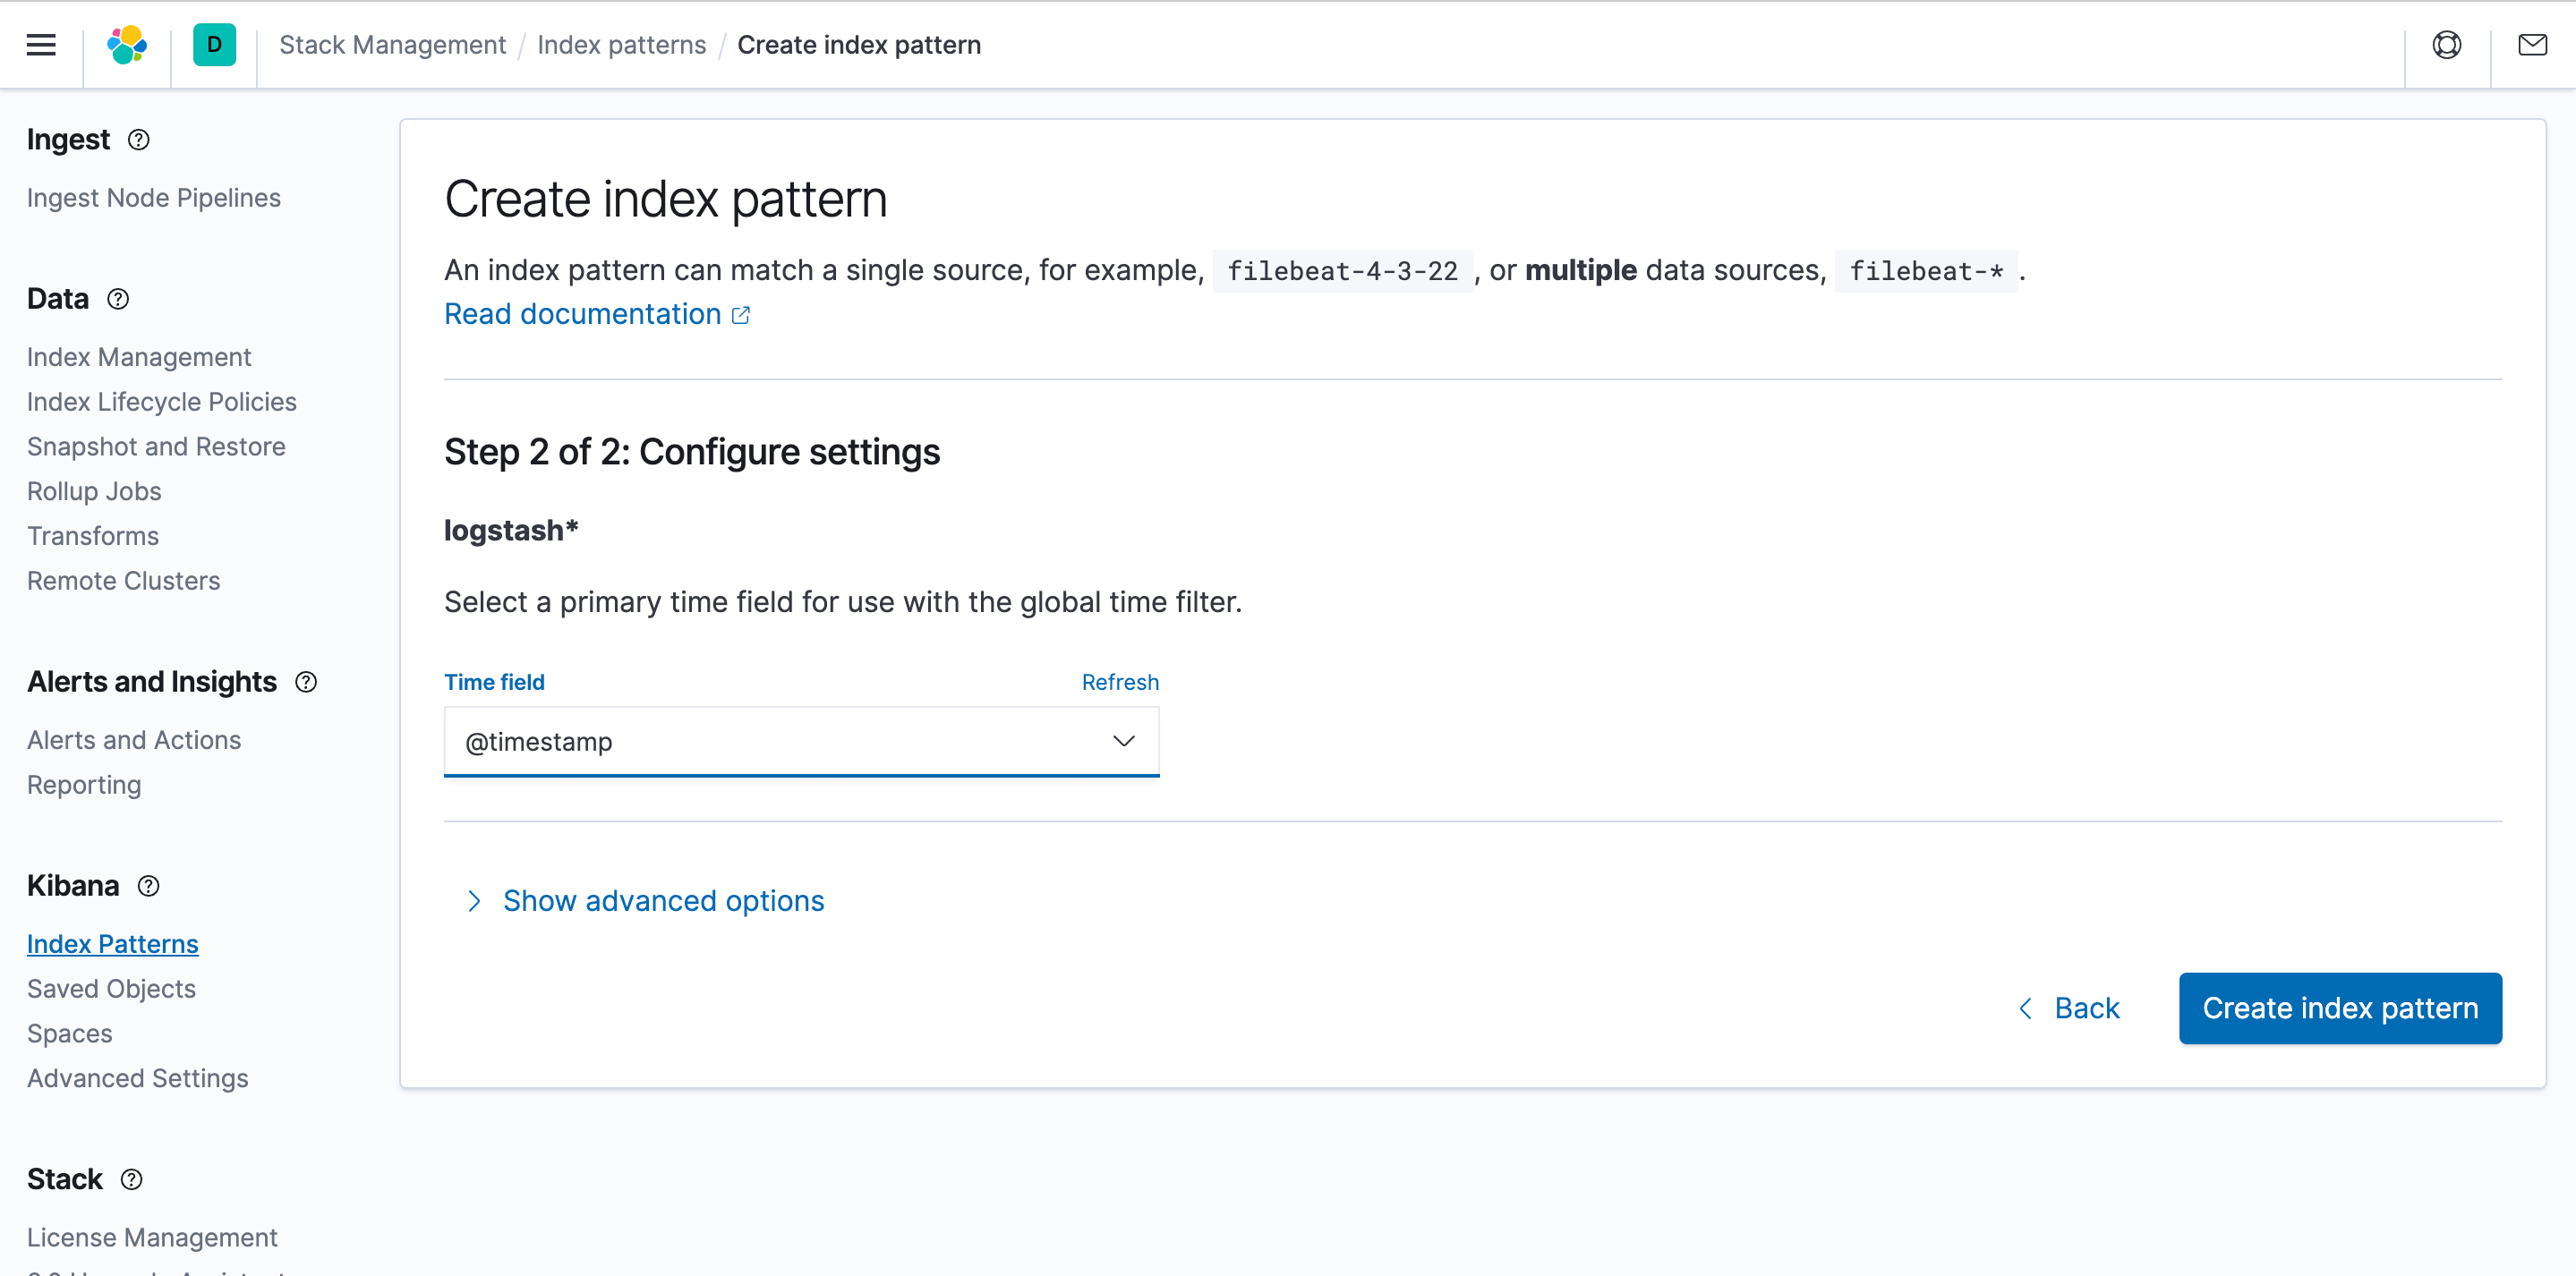
Kibanaでログを検索・閲覧するには、インデックスパターンを作成する必要があります。インデックスパターンを選択し、_Create_をクリックします。
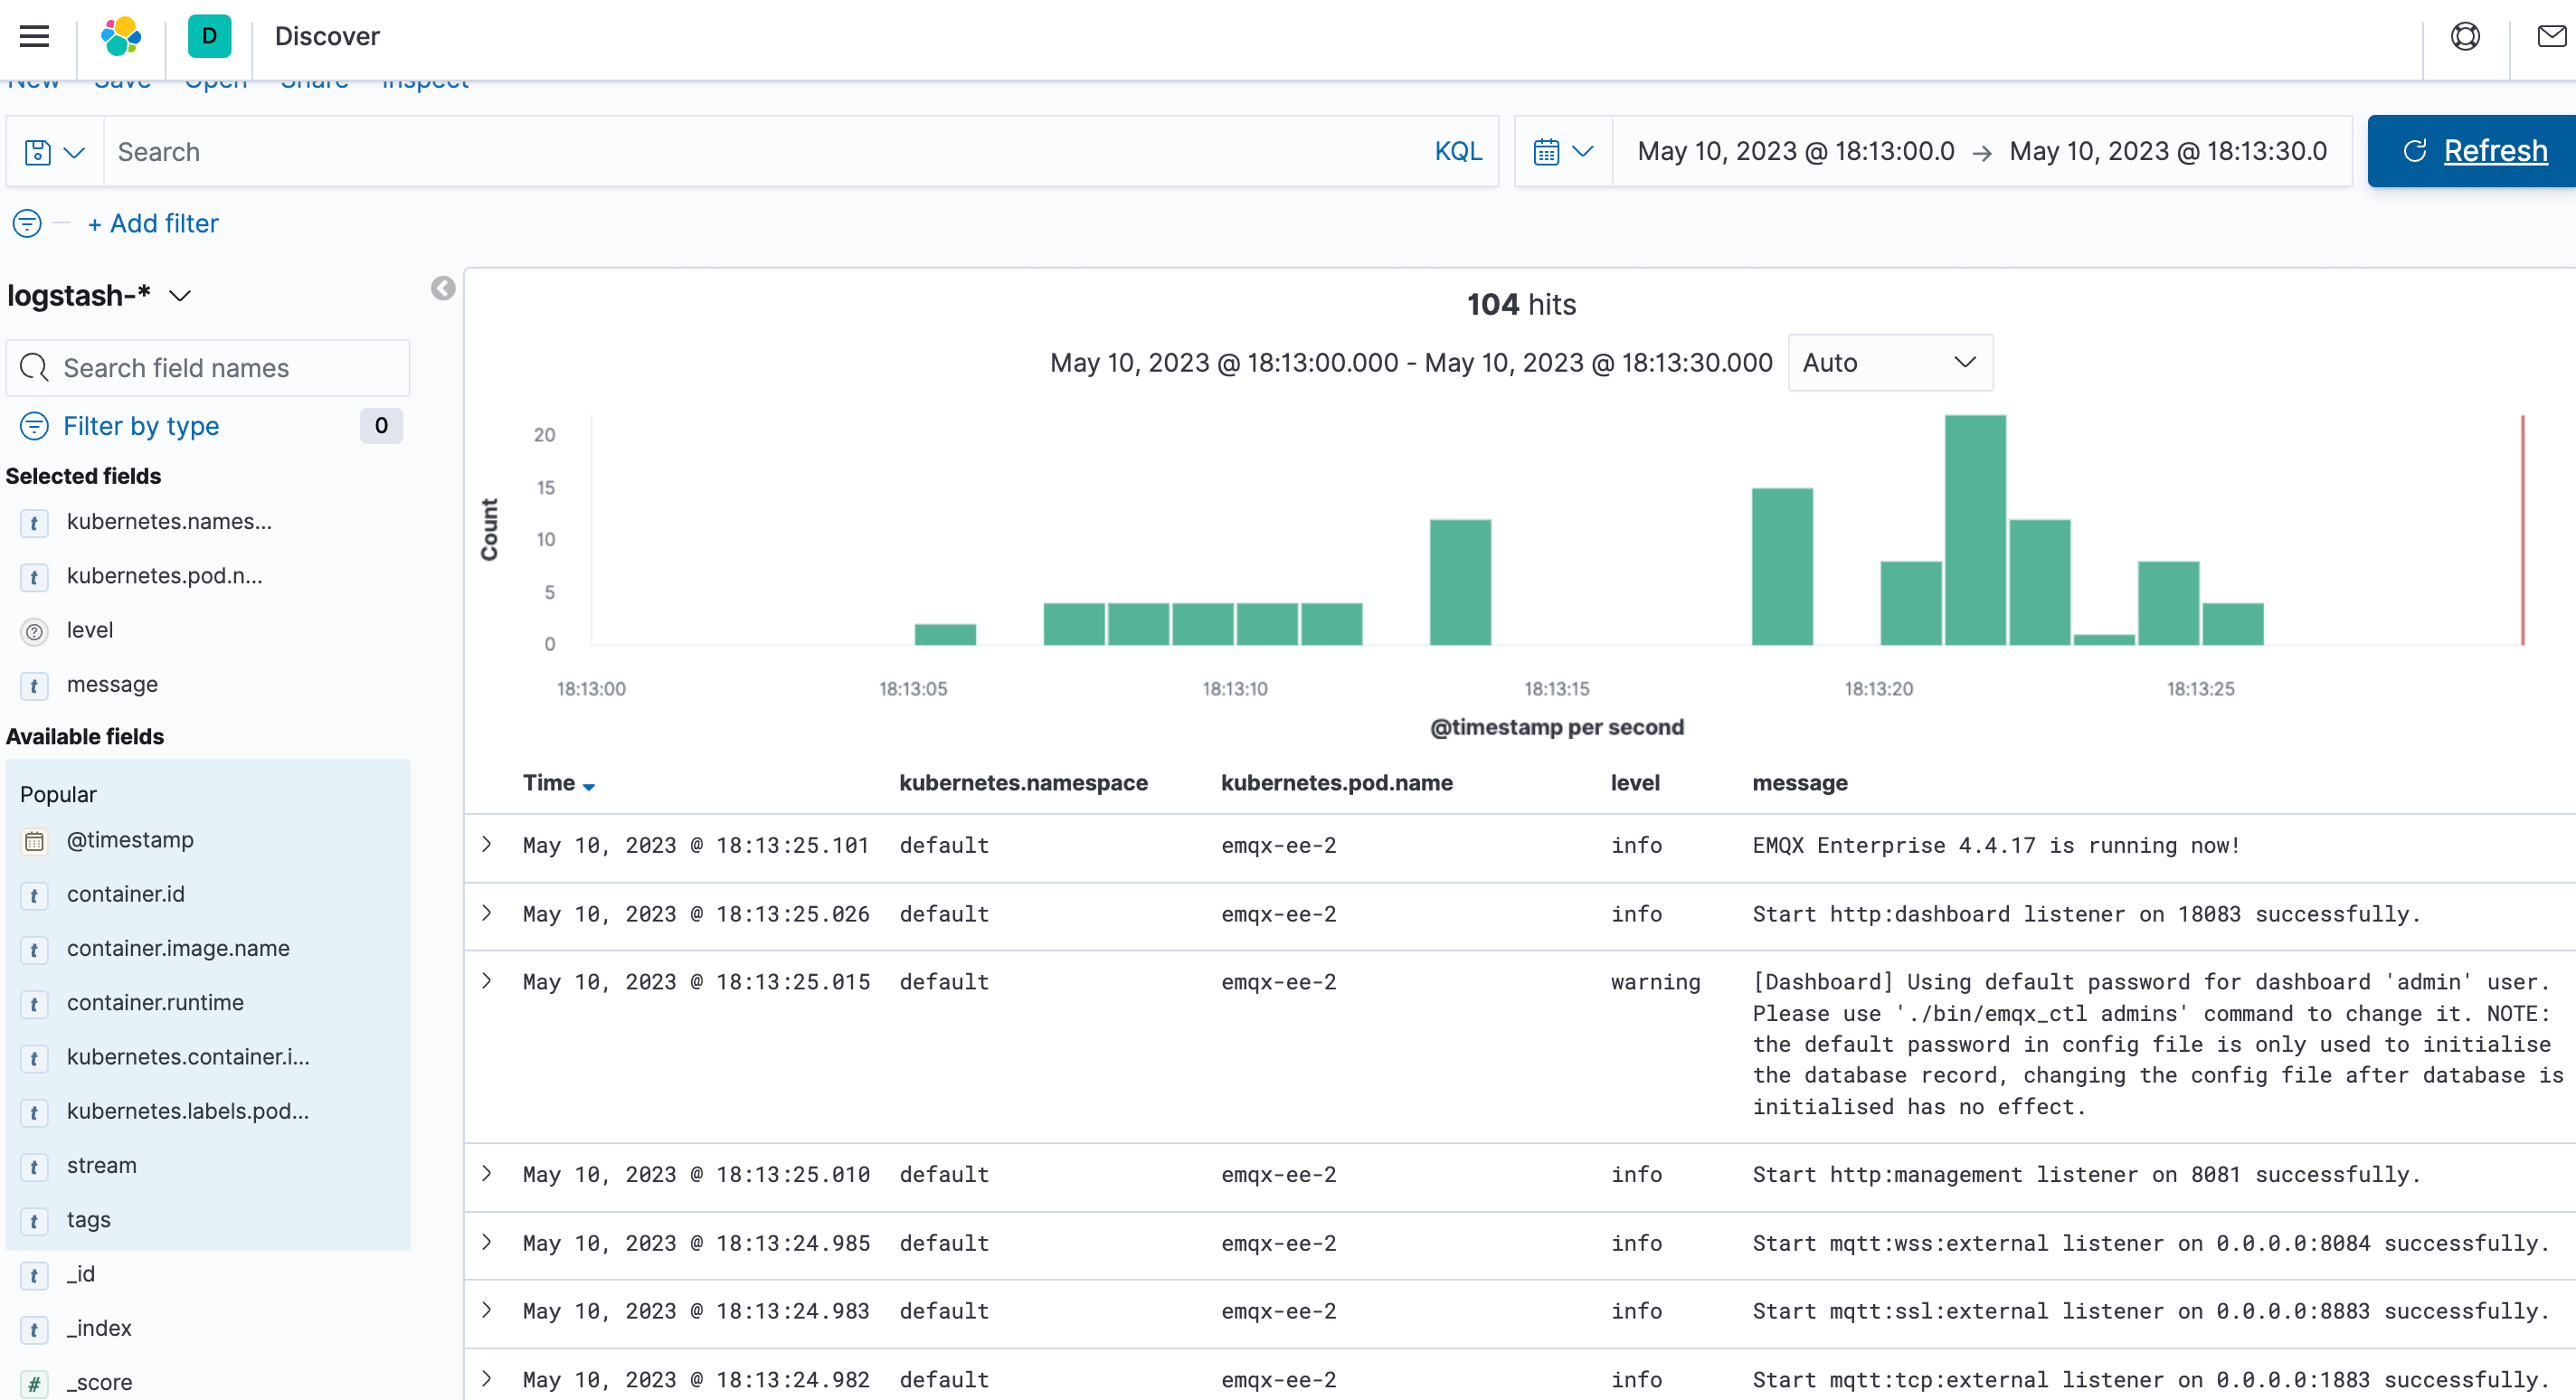
EMQXクラスターのログが収集されていることを確認します。