Prometheus と Grafana による EMQX クラスターの監視
目的
EMQX Exporter をデプロイし、Prometheus と Grafana を使って EMQX クラスターを監視します。
Prometheus と Grafana のデプロイ
- Prometheus のデプロイ方法については、Prometheus のドキュメントを参照してください。
- Grafana のデプロイ方法については、Grafana のドキュメントを参照してください。
EMQX クラスターのデプロイ
EMQX は Prometheus 互換の HTTP API を通じて様々なメトリクスを公開します。
apiVersion: apps.emqx.io/v2
kind: EMQX
metadata:
  name: emqx
spec:
  image: emqx/emqx:6.2.2
  config:
    data: |
      license {
        key = "..."
      }
上記の内容を emqx.yaml として保存し、以下のコマンドを実行して EMQX クラスターをデプロイします。
$ kubectl apply -f emqx.yaml
emqx.apps.emqx.io/emqx created
EMQX クラスターのステータスを確認し、STATUS が Ready になっていることを確認してください。完了までに時間がかかる場合があります。
$ kubectl get emqx emqx
NAME   STATUS   AGE
emqx   Ready    10m
API シークレットの作成
Prometheus は EMQX ダッシュボード API からメトリクスを取得するため、ダッシュボードにサインインして API シークレットを作成 する必要があります。
EMQX Exporter のデプロイ
emqx-exporter は EMQX の Prometheus API で公開されていない一部のメトリクスを公開するために設計されています。
apiVersion: v1
kind: Service
metadata:
  labels:
    app: emqx-exporter
  name: emqx-exporter-service
spec:
  ports:
    - name: metrics
      port: 8085
      targetPort: metrics
  selector:
    app: emqx-exporter
---
apiVersion: apps/v1
kind: Deployment
metadata:
  name: emqx-exporter
  labels:
    app: emqx-exporter
spec:
  selector:
    matchLabels:
      app: emqx-exporter
  replicas: 1
  template:
    metadata:
      labels:
        app: emqx-exporter
    spec:
      securityContext:
        runAsUser: 1000
      containers:
        - name: exporter
          image: emqx-exporter:latest
          imagePullPolicy: IfNotPresent
          args:
            # "emqx-dashboard-service-name" はオペレーターが 18083 ポート公開用に作成したサービス名です
            - --emqx.nodes=${emqx-dashboard-service-name}:18083
            - --emqx.auth-username=${paste_your_new_api_key_here}
            - --emqx.auth-password=${paste_your_new_secret_here}
          securityContext:
            allowPrivilegeEscalation: false
            runAsNonRoot: true
          ports:
            - containerPort: 8085
              name: metrics
              protocol: TCP
          resources:
            limits:
              cpu: 100m
              memory: 100Mi
            requests:
              cpu: 100m
              memory: 20Mi
引数の
--emqx.nodesはオペレーターが 18083 ポート公開用に作成したサービス名に設定してください。サービス名はkubectl get svcコマンドで確認できます。
上記の内容を emqx-exporter.yaml として保存し、--emqx.auth-username と --emqx.auth-password を新しく作成した API シークレットに置き換えてください。以下のコマンドで emqx-exporter をデプロイします。
kubectl apply -f emqx-exporter.yamlemqx-exporter の Pod のステータスを確認します。
$ kubectl get po -l="app=emqx-exporter"
NAME                            STATUS   AGE
emqx-exporter-856564c95-j4q5v   Running  8m33s
Prometheus 監視の設定
Prometheus Operator は PodMonitor と ServiceMonitor CRD を使って、Pod やサービスの監視方法を動的に定義します。
apiVersion: monitoring.coreos.com/v1
kind: PodMonitor
metadata:
  name: emqx
  labels:
    app.kubernetes.io/name: emqx
spec:
  podMetricsEndpoints:
    - interval: 5s
      path: /api/v5/prometheus/stats
      # emqx ダッシュボードの containerPort 名
      port: dashboard
      relabelings:
        - action: replace
          # ユーザー定義のクラスター名、一意である必要があります
          replacement: emqx5
          targetLabel: cluster
        - action: replace
          # 固定値、変更しないでください
          replacement: emqx
          targetLabel: from
        - action: replace
          # 固定値、変更しないでください
          sourceLabels: ['pod']
          targetLabel: "instance"
  selector:
    matchLabels:
      # emqx Pod のラベルと同じにしてください
      apps.emqx.io/instance: emqx
      apps.emqx.io/managed-by: emqx-operator
  namespaceSelector:
    matchNames:
      # EMQX クラスターを他のネームスペースにデプロイしている場合は修正してください
      #- default
---
apiVersion: monitoring.coreos.com/v1
kind: ServiceMonitor
metadata:
  name: emqx-exporter
  labels:
    app: emqx-exporter
spec:
  selector:
    matchLabels:
      # emqx-exporter サービスのラベルと同じにしてください
      app: emqx-exporter
  endpoints:
    - port: metrics
      interval: 5s
      path: /metrics
      relabelings:
        - action: replace
          # ユーザー定義のクラスター名、一意である必要があります
          replacement: emqx5
          targetLabel: cluster
        - action: replace
          # 固定値、変更しないでください
          replacement: exporter
          targetLabel: from
        - action: replace
          # 固定値、変更しないでください
          sourceLabels: ['pod']
          regex: '(.*)-.*-.*'
          replacement: $1
          targetLabel: "instance"
        - action: labeldrop
          # 固定値、変更しないでください
          regex: 'pod'
  namespaceSelector:
    matchNames:
      # exporter を他のネームスペースにデプロイしている場合は修正してください
      #- default
path は指標収集インターフェースのパスを示します。EMQX 5 では /api/v5/prometheus/stats です。selector.matchLabels はマッチする Pod のラベルを示し、apps.emqx.io/instance: emqx となっています。
targetLabel の cluster は現在のクラスター名を表し、一意である必要があります。
上記の内容を monitor.yaml として保存し、以下のコマンドを実行してください。
$ kubectl apply -f monitor.yamlPrometheus での EMQX 指標の確認
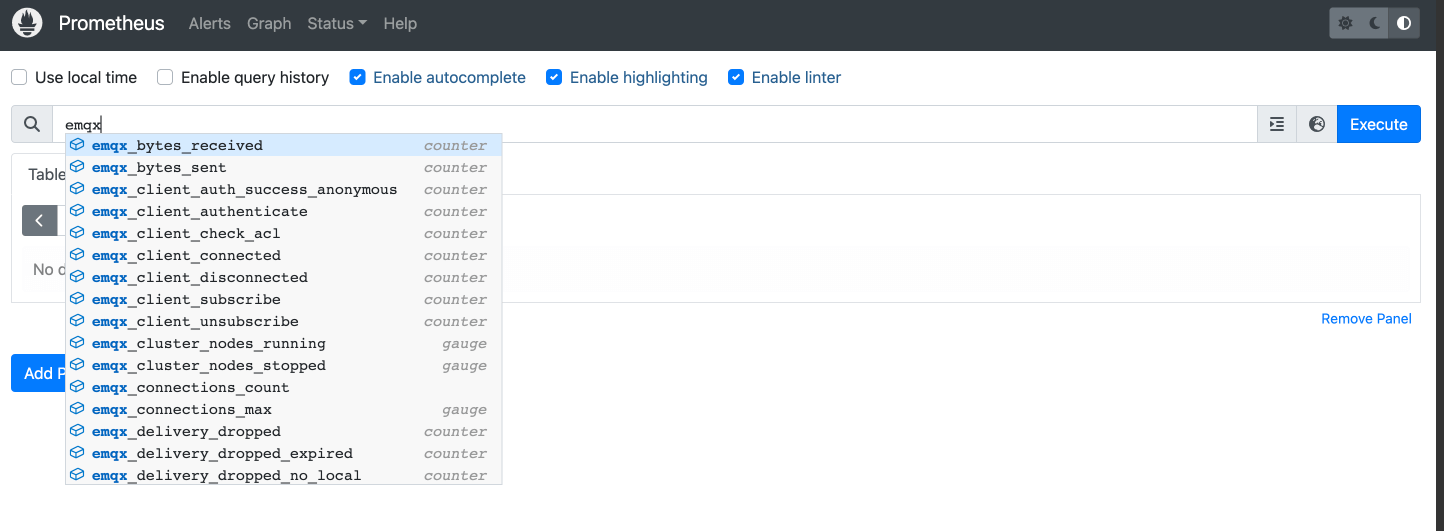
Prometheus インターフェースを開き、Graph ページに切り替えて emqx と入力すると、以下のように表示されます。
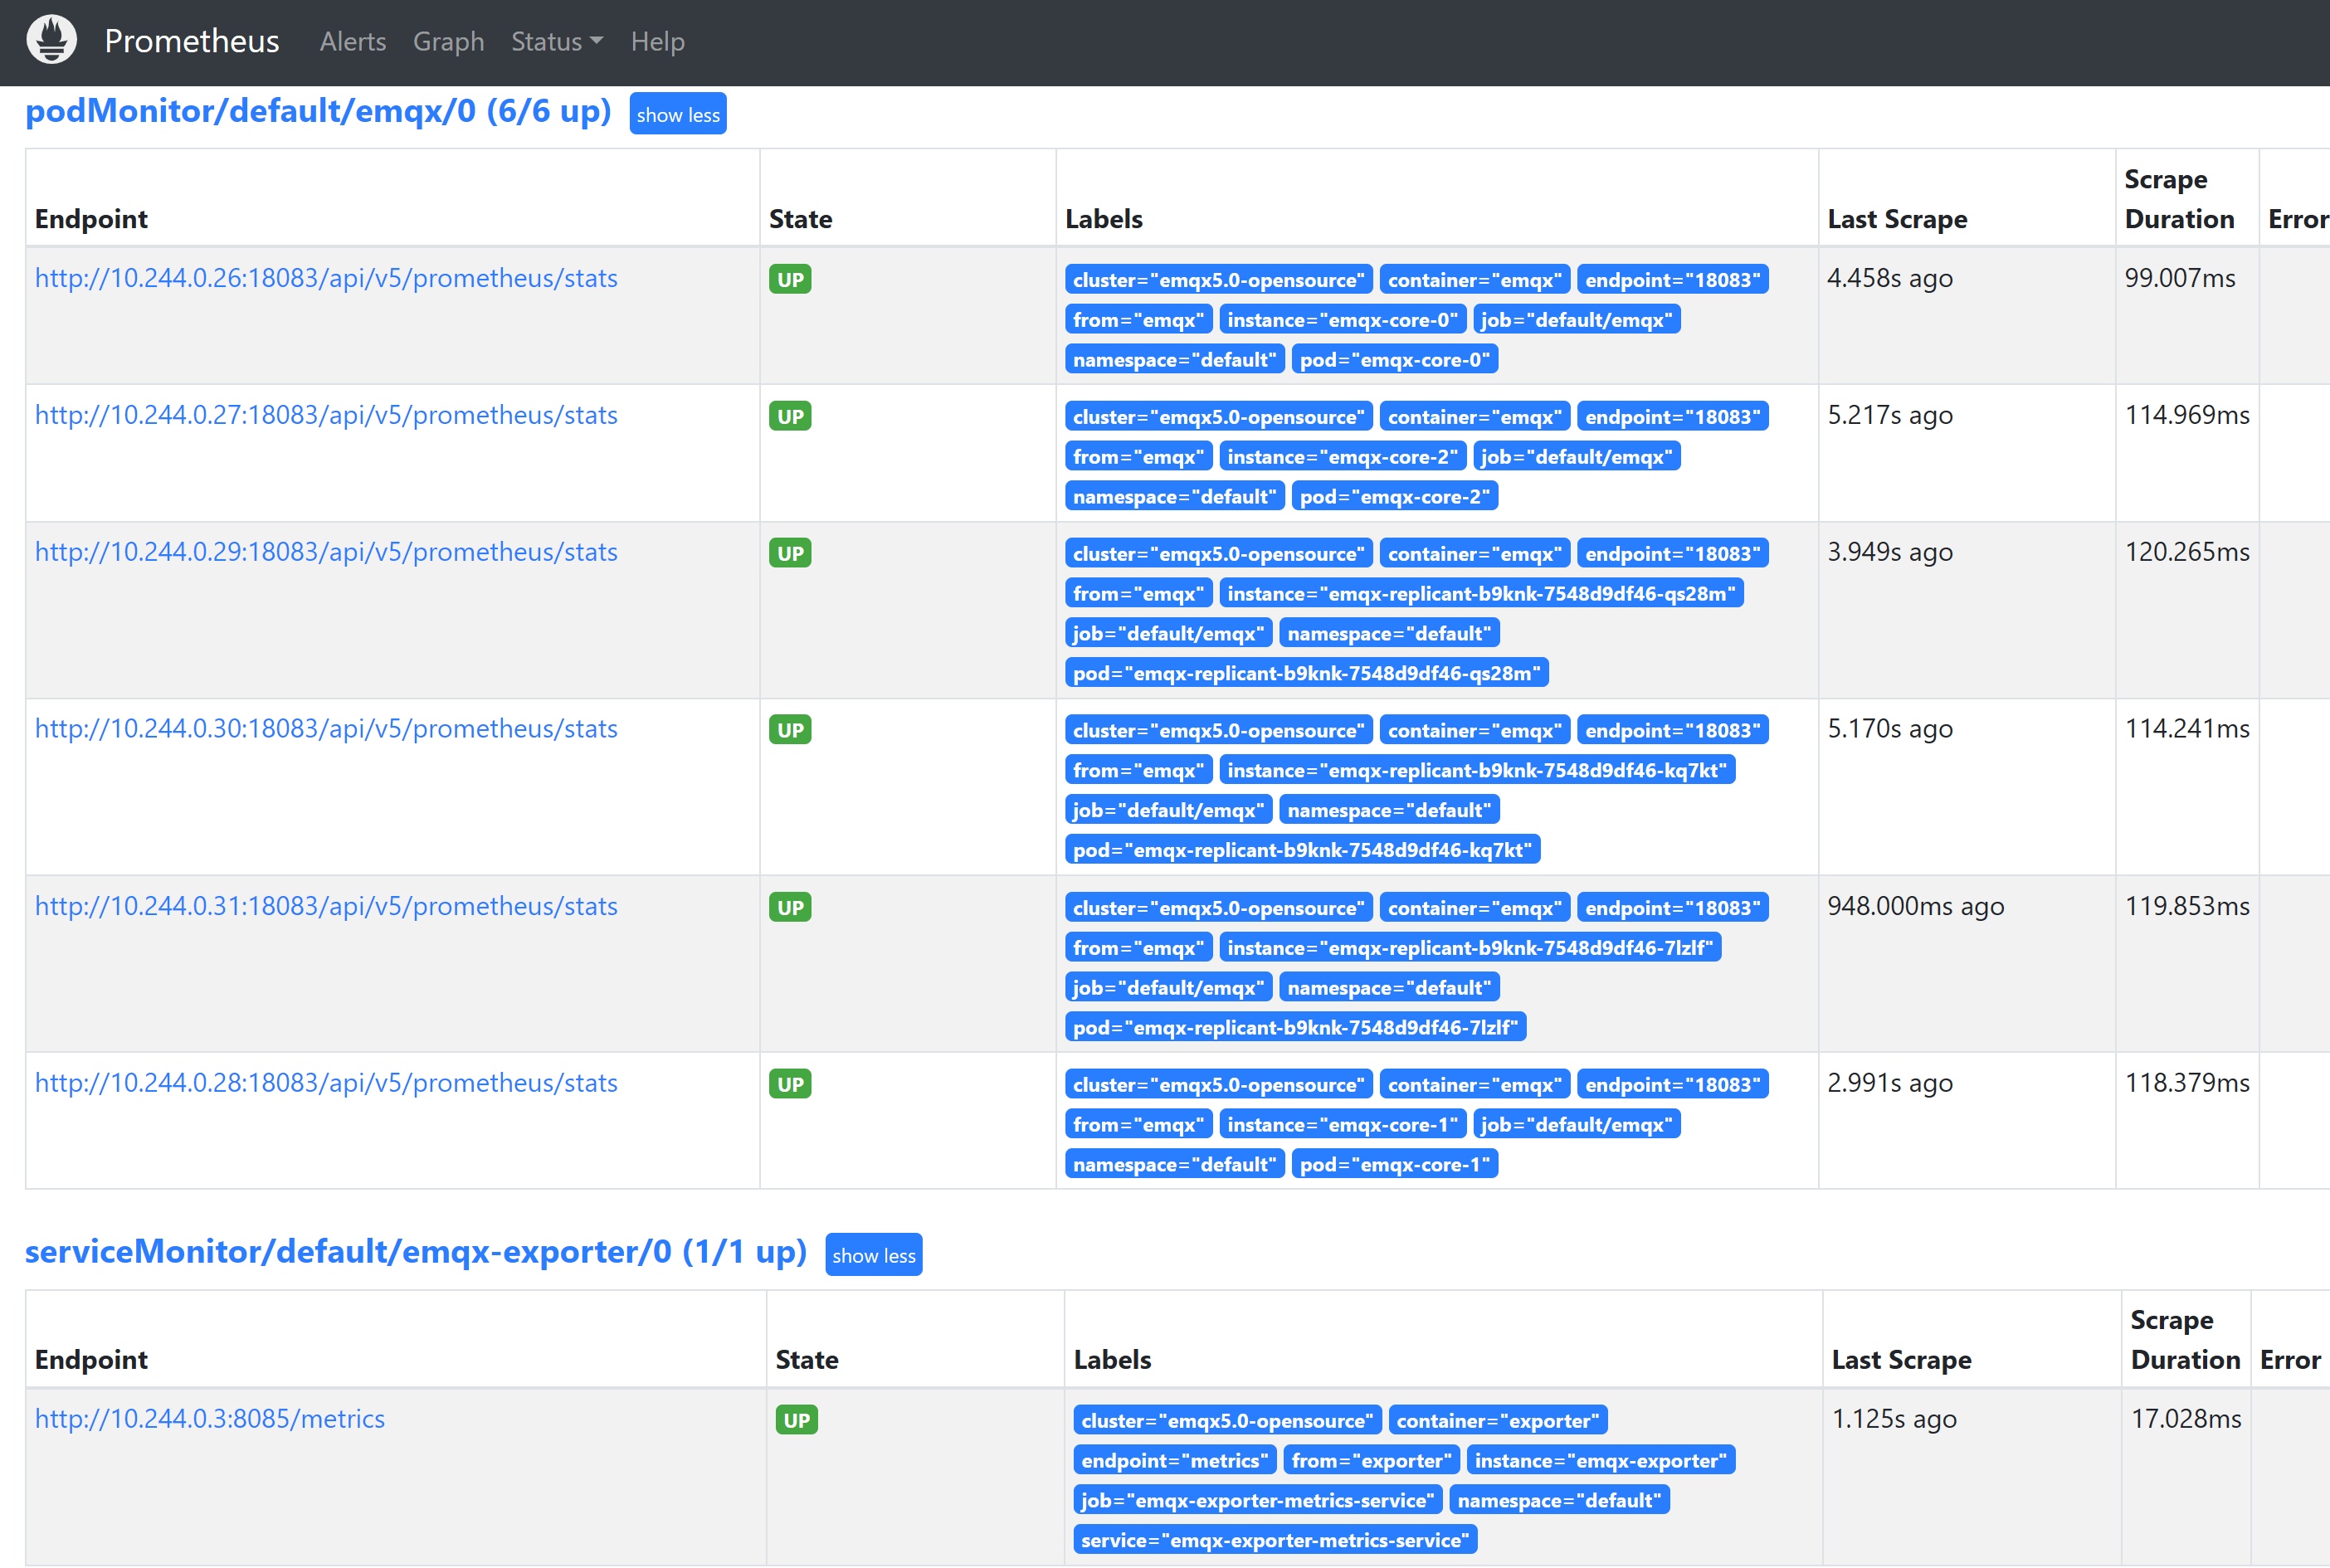
Status -> Targets ページに切り替えると、以下の画面が表示され、クラスター内の監視対象の EMQX Pod 情報を確認できます。
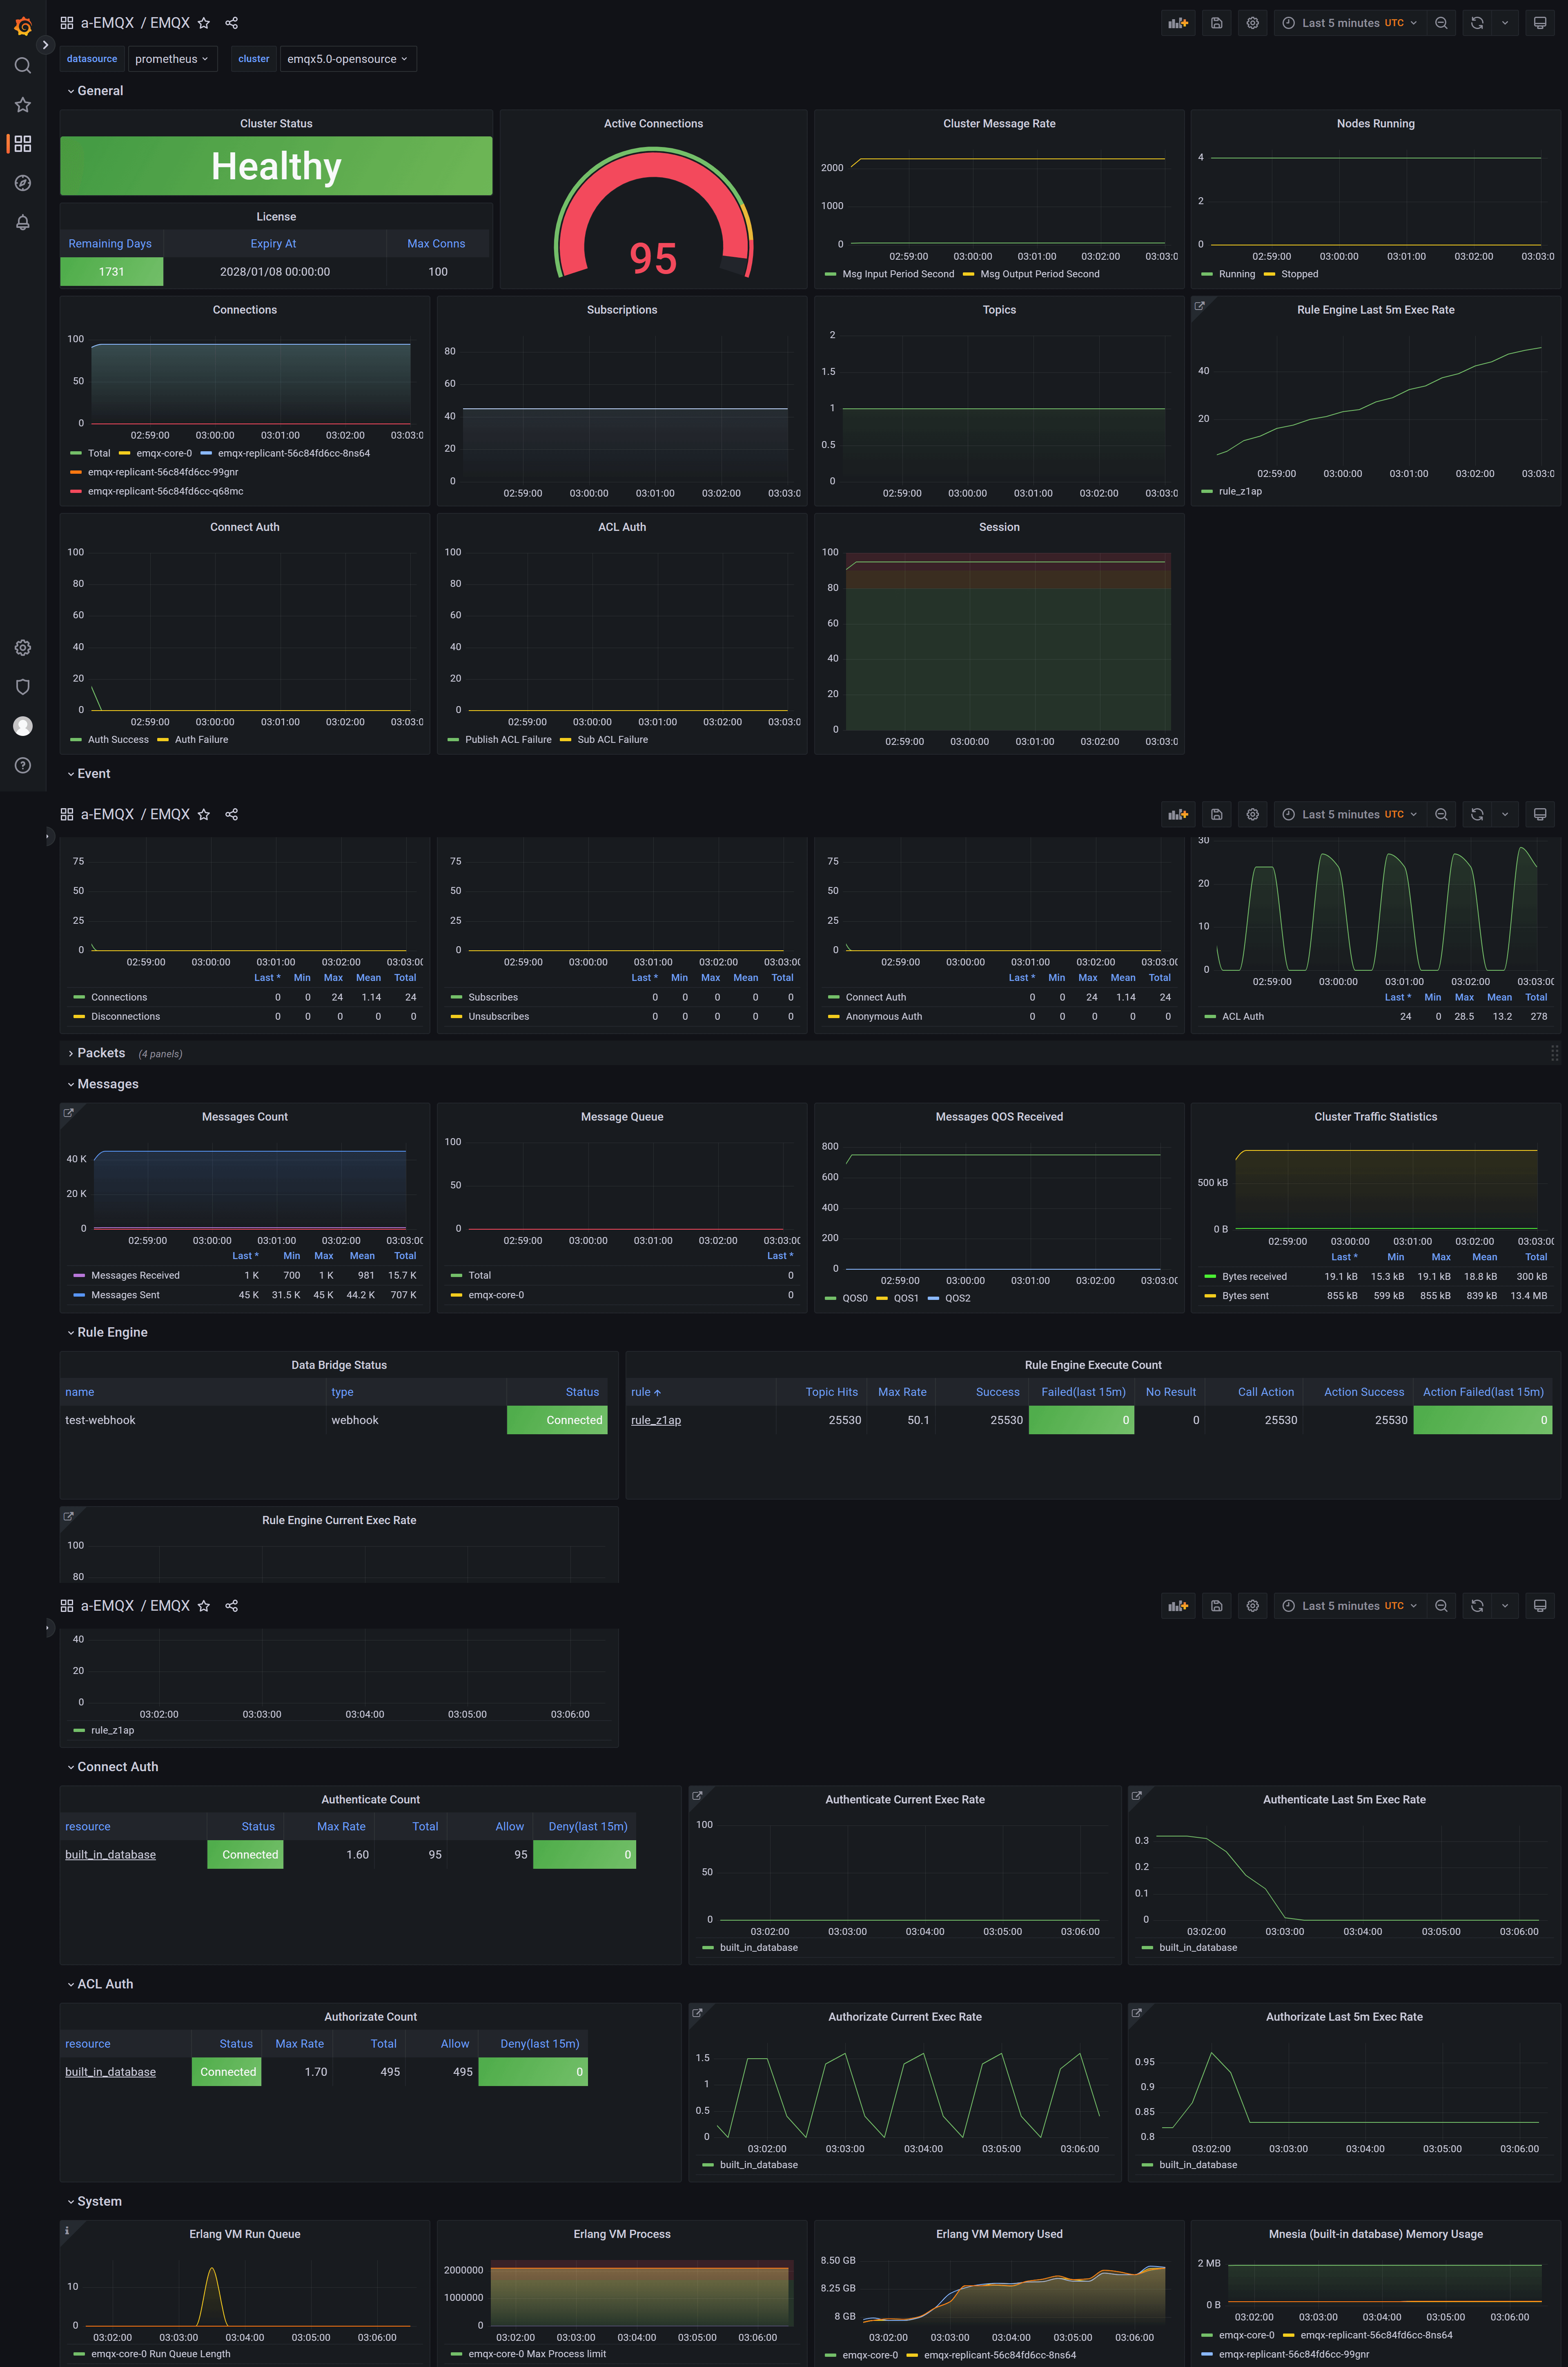
Grafana テンプレートのインポート
すべてのダッシュボード テンプレート をインポートしてください。メインダッシュボードの EMQX を開いてお楽しみください。