Collect EMQX Logs in Kubernetes
Objective
Use ELK to collect EMQX cluster logs.
Deploy ELK
ELK stands for Elasticsearch, Logstash, and Kibana (also known as the Elastic Stack):
- Elasticsearch: Distributed, near-real-time search and analytics engine based on Lucene providing REST APIs to interact with data.
- Logstash: Primary data flow engine for collecting, transforming, and forwarding logs from various sources to different destinations.
- Kibana: Web interface for visualizing and analyzing Elasticsearch data in real time.
Deploy Single Node Elasticsearch
Deploying a single-node Elasticsearch cluster is relatively simple. You can use the following YAML configuration file to quickly deploy an Elasticsearch cluster.
Save the following content as a YAML file and deploy it using
kubectl apply.yaml--- apiVersion: v1 kind: Service metadata: name: elasticsearch-logging namespace: kube-logging labels: k8s-app: elasticsearch kubernetes.io/cluster-service: "true" addonmanager.kubernetes.io/mode: Reconcile spec: ports: - port: 9200 protocol: TCP targetPort: db selector: k8s-app: elasticsearch --- apiVersion: v1 kind: ServiceAccount metadata: name: elasticsearch-logging namespace: kube-logging labels: k8s-app: elasticsearch kubernetes.io/cluster-service: "true" addonmanager.kubernetes.io/mode: Reconcile --- kind: ClusterRole apiVersion: rbac.authorization.k8s.io/v1 metadata: name: elasticsearch-logging labels: k8s-app: elasticsearch kubernetes.io/cluster-service: "true" addonmanager.kubernetes.io/mode: Reconcile rules: - apiGroups: - "" resources: - "services" - "namespaces" - "endpoints" verbs: - "get" --- kind: ClusterRoleBinding apiVersion: rbac.authorization.k8s.io/v1 metadata: namespace: kube-logging name: elasticsearch-logging labels: k8s-app: elasticsearch kubernetes.io/cluster-service: "true" addonmanager.kubernetes.io/mode: Reconcile subjects: - kind: ServiceAccount name: elasticsearch-logging namespace: kube-logging apiGroup: "" roleRef: kind: ClusterRole name: elasticsearch apiGroup: "" --- apiVersion: apps/v1 kind: StatefulSet metadata: name: elasticsearch-logging namespace: kube-logging labels: k8s-app: elasticsearch kubernetes.io/cluster-service: "true" addonmanager.kubernetes.io/mode: Reconcile spec: serviceName: elasticsearch-logging replicas: 1 selector: matchLabels: k8s-app: elasticsearch template: metadata: labels: k8s-app: elasticsearch spec: serviceAccountName: elasticsearch-logging containers: - image: docker.io/library/elasticsearch:7.9.3 name: elasticsearch-logging resources: limits: cpu: 1000m memory: 1Gi requests: cpu: 100m memory: 500Mi ports: - containerPort: 9200 name: db protocol: TCP - containerPort: 9300 name: transport protocol: TCP volumeMounts: - name: elasticsearch-logging mountPath: /usr/share/elasticsearch/data/ env: - name: "NAMESPACE" valueFrom: fieldRef: fieldPath: metadata.namespace - name: "discovery.type" value: "single-node" - name: ES_JAVA_OPTS value: "-Xms512m -Xmx2g" # Elasticsearch requires vm.max_map_count to be at least 262144. # If your OS already sets up this number to a higher value, feel free # to remove this init container. initContainers: - name: elasticsearch-logging-init image: alpine:3.6 command: ["/sbin/sysctl", "-w", "vm.max_map_count=262144"] securityContext: privileged: true - name: increase-fd-ulimit image: busybox imagePullPolicy: IfNotPresent command: ["sh", "-c", "ulimit -n 65536"] securityContext: privileged: true - name: elasticsearch-volume-init image: alpine:3.6 command: -chmod - -R - "777" - /usr/share/elasticsearch/data/ volumeMounts: - name: elasticsearch-logging mountPath: /usr/share/elasticsearch/data/ volumeClaimTemplates: - metadata: name: elasticsearch-logging spec: storageClassName: ${storageClassName} accessModes: [ "ReadWriteOnce" ] resources: requests: storage: 10GiTIP
Use the
storageClassNamefield to choose the appropriate StorageClass. Runkubectl get storageclassto list the StorageClasses that already exist in the Kubernetes cluster, or create a StorageClass according to your needs.Wait for Elasticsearch to be ready.
Check the status of the Elasticsearch pod using the
kubectl getcommand and ensure thatSTATUSisRunning.bash$ kubectl get pod -n kube-logging -l "k8s-app=elasticsearch" NAME READY STATUS RESTARTS AGE elasticsearch-0 1/1 Running 0 16m
Deploy Kibana
This walkthrough uses a Deployment to deploy Kibana for visualizing the collected logs, and a Service of type NodePort to expose Kibana externally.
Save the following content as a YAML file and deploy it using
kubectl apply.yaml--- apiVersion: v1 kind: Service metadata: name: kibana namespace: kube-logging labels: k8s-app: kibana spec: type: NodePort ports: - port: 5601 nodePort: 35601 protocol: TCP targetPort: ui selector: k8s-app: kibana --- apiVersion: apps/v1 kind: Deployment metadata: name: kibana namespace: kube-logging labels: k8s-app: kibana kubernetes.io/cluster-service: "true" addonmanager.kubernetes.io/mode: Reconcile spec: replicas: 1 selector: matchLabels: k8s-app: kibana template: metadata: labels: k8s-app: kibana annotations: seccomp.security.alpha.kubernetes.io/pod: 'docker/default' spec: containers: - name: kibana image: docker.io/kubeimages/kibana:7.9.3 resources: limits: cpu: 1000m requests: cpu: 100m env: # The access address of ES - name: ELASTICSEARCH_HOSTS value: http://elasticsearch-logging:9200 ports: - containerPort: 5601 name: ui protocol: TCPWait for Kibana to be ready.
Check the status of the Kibana pod using the
kubectl getcommand and ensure thatSTATUSisRunning.bash$ kubectl get pod -n kube-logging -l "k8s-app=kibana" NAME READY STATUS RESTARTS AGE kibana-b7d98644-48gtm 1/1 Running 0 17mIn your browser, navigate to
http://{node_ip}:35601to access the Kibana web interface.
Deploy Filebeat
Filebeat is a lightweight log collection component that is part of the Elastic Stack and works seamlessly with Logstash, Elasticsearch, and Kibana.
Save the following content as a YAML file and deploy it using
kubectl apply.yaml--- apiVersion: v1 kind: ConfigMap metadata: name: filebeat-config namespace: kube-logging labels: k8s-app: filebeat data: filebeat.yml: |- filebeat.inputs: - type: container paths: # The log path of the EMQX container on the host - /var/log/containers/^emqx.*.log processors: - add_kubernetes_metadata: host: ${NODE_NAME} matchers: - logs_path: logs_path: "/var/log/containers/" output.logstash: hosts: ["logstash:5044"] enabled: true --- apiVersion: v1 kind: ServiceAccount metadata: name: filebeat namespace: kube-logging labels: k8s-app: filebeat --- apiVersion: rbac.authorization.k8s.io/v1beta1 kind: ClusterRole metadata: name: filebeat labels: k8s-app: filebeat rules: - apiGroups: [""] resources: - namespaces - pods verbs: - get - watch - list --- apiVersion: rbac.authorization.k8s.io/v1beta1 kind: ClusterRoleBinding metadata: name: filebeat subjects: - kind: ServiceAccount name: filebeat namespace: kube-logging roleRef: kind: ClusterRole name: filebeat apiGroup: rbac.authorization.k8s.io --- apiVersion: apps/v1 kind: DaemonSet metadata: name: filebeat namespace: kube-logging labels: k8s-app: filebeat spec: selector: matchLabels: k8s-app: filebeat template: metadata: labels: k8s-app: filebeat spec: serviceAccountName: filebeat terminationGracePeriodSeconds: 30 containers: - name: filebeat image: docker.io/kubeimages/filebeat:7.9.3 args: [ "-c", "/etc/filebeat.yml", "-e","-httpprof","0.0.0.0:6060" ] env: - name: NODE_NAME valueFrom: fieldRef: fieldPath: spec.nodeName - name: ELASTICSEARCH_HOST value: elasticsearch - name: ELASTICSEARCH_PORT value: "9200" securityContext: runAsUser: 0 resources: limits: memory: 1000Mi cpu: 1000m requests: memory: 100Mi cpu: 100m volumeMounts: - name: config mountPath: /etc/filebeat.yml readOnly: true subPath: filebeat.yml - name: data mountPath: /usr/share/filebeat/data - name: varlibdockercontainers mountPath: /data/var/ readOnly: true - name: varlog mountPath: /var/log/ readOnly: true - name: timezone mountPath: /etc/localtime volumes: - name: config configMap: defaultMode: 0600 name: filebeat-config - name: varlibdockercontainers hostPath: path: /data/var/ - name: varlog hostPath: path: /var/log/ - name: inputs configMap: defaultMode: 0600 name: filebeat-inputs - name: data hostPath: path: /data/filebeat-data type: DirectoryOrCreate - name: timezone hostPath: path: /etc/localtimeWait for Filebeat to become ready.
Check the status of Filebeat pods using the
kubectl getcommand and ensure thatSTATUSisRunning.bash$ kubectl get pod -n kube-logging -l "k8s-app=filebeat" NAME READY STATUS RESTARTS AGE filebeat-82d2b 1/1 Running 0 45m filebeat-vwrjn 1/1 Running 0 45m
Deploy Logstash
Logstash is used for log processing and cleaning.
In this walkthrough, we use the Beats Input plugin of Logstash to collect logs and the Ruby filter plugin to filter logs. Logstash also provides many other input and filtering plugins that you can configure according to your business needs.
Save the following content as a YAML file and deploy it using
kubectl apply.yaml--- apiVersion: v1 kind: Service metadata: name: logstash namespace: kube-logging spec: ports: - port: 5044 targetPort: beats selector: k8s-app: logstash clusterIP: None --- apiVersion: apps/v1 kind: Deployment metadata: name: logstash namespace: kube-logging spec: selector: matchLabels: k8s-app: logstash template: metadata: labels: k8s-app: logstash spec: containers: - image: docker.io/kubeimages/logstash:7.9.3 name: logstash ports: - containerPort: 5044 name: beats command: - logstash - '-f' - '/etc/logstash_c/logstash.conf' env: - name: "XPACK_MONITORING_ELASTICSEARCH_HOSTS" value: "http://elasticsearch-logging:9200" volumeMounts: - name: config-volume mountPath: /etc/logstash_c/ - name: config-yml-volume mountPath: /usr/share/logstash/config/ - name: timezone mountPath: /etc/localtime resources: limits: cpu: 1000m memory: 2048Mi requests: cpu: 512m memory: 512Mi volumes: - name: config-volume configMap: name: logstash-conf items: - key: logstash.conf path: logstash.conf - name: timezone hostPath: path: /etc/localtime - name: config-yml-volume configMap: name: logstash-yml items: - key: logstash.yml path: logstash.yml --- apiVersion: v1 kind: ConfigMap metadata: name: logstash-conf namespace: kube-logging labels: k8s-app: logstash data: logstash.conf: |- input { beats { port => 5044 } } filter { ruby { code => " ss = event.get('message').split(' ') len = ss.length() level = '' index = '' msg = '' if len == 0 || len < 2 event.set('level','invalid') return end if ss[1][0] == '[' l = ss[1].length() level = ss[1][1..l-2] index = 2 else level = 'info' index = 0 end event.set('level',level) for i in ss[index..len] msg = msg + i msg = msg + ' ' end event.set('message',msg) " } if [level] == "invalid" { drop {} } } output { elasticsearch { hosts => ["http://elasticsearch-logging:9200"] codec => json index => "logstash-%{+YYYY.MM.dd}" } } --- apiVersion: v1 kind: ConfigMap metadata: name: logstash-yml namespace: kube-logging labels: k8s-app: logstash data: logstash.yml: |- http.host: "0.0.0.0" xpack.monitoring.elasticsearch.hosts: http://elasticsearch-logging:9200Wait for Logstash to be ready.
Check the status of Logstash pods using the
kubectl getcommand and ensure thatSTATUSisRunning.bash$ kubectl get pod -n kube-logging -l "k8s-app=logstash" NAME READY STATUS RESTARTS AGE filebeat-82d2b 1/1 Running 0 45m filebeat-vwrjn 1/1 Running 0 45m
Deploy EMQX Cluster
To deploy an EMQX cluster, please refer to the document Deploy EMQX.
Verify Log Collection
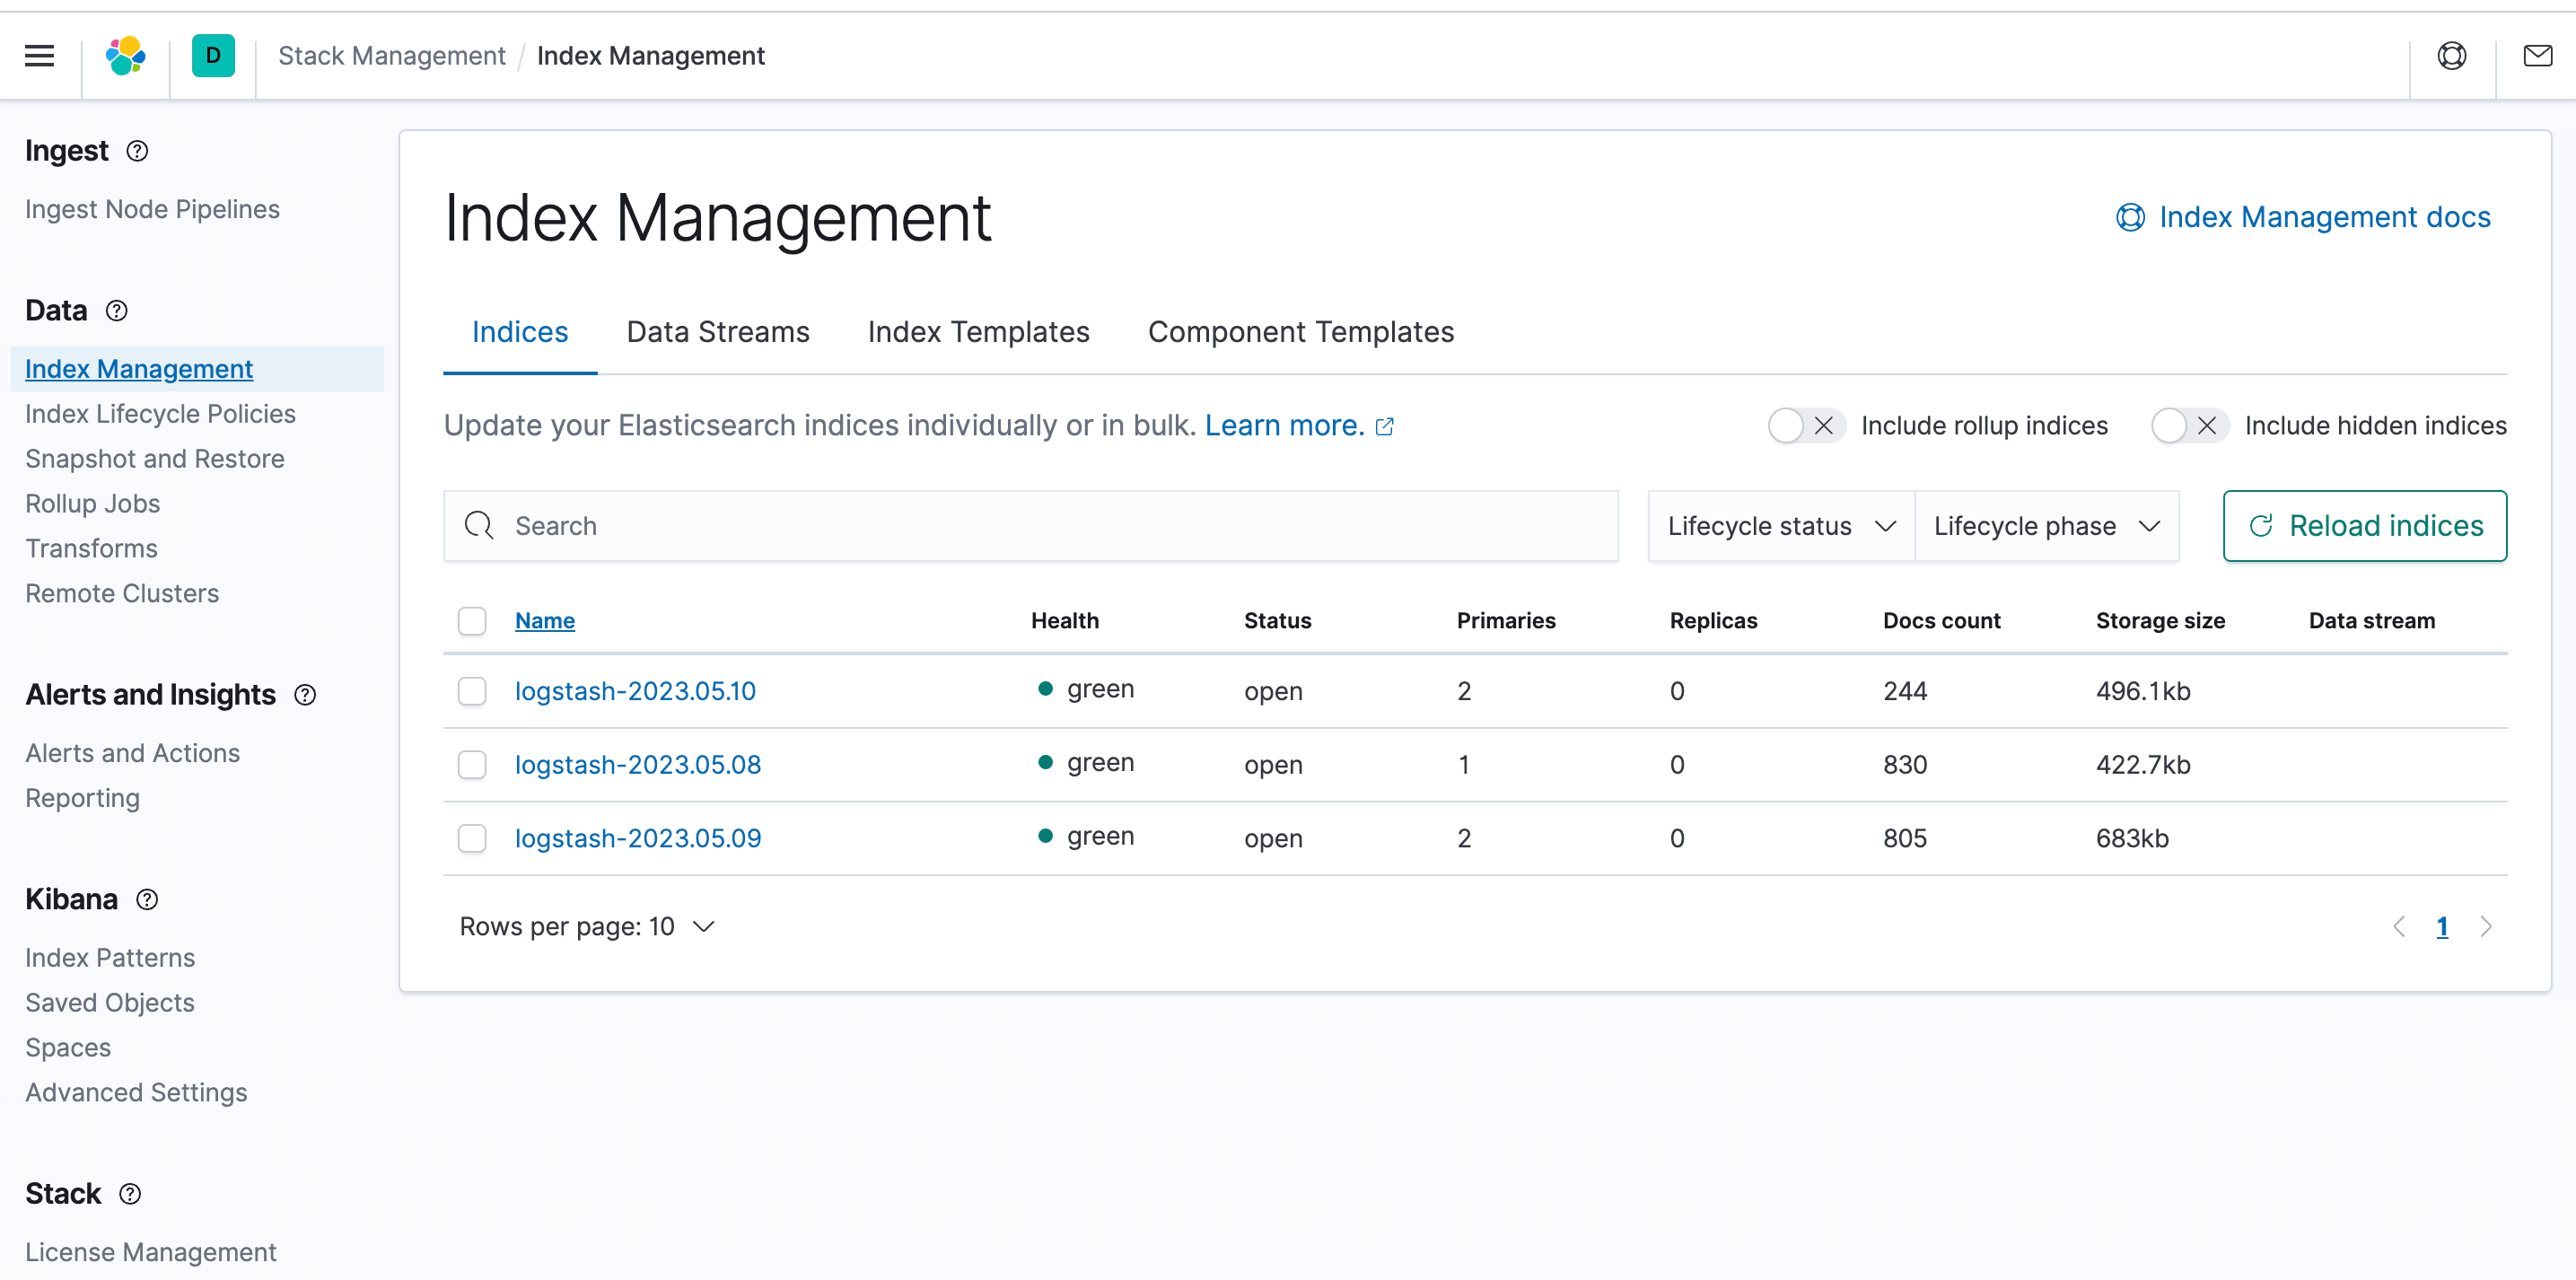
Log in to the Kibana interface, open the stack management module in the menu, and click on Index Management. You can see that log indices have already been collected.
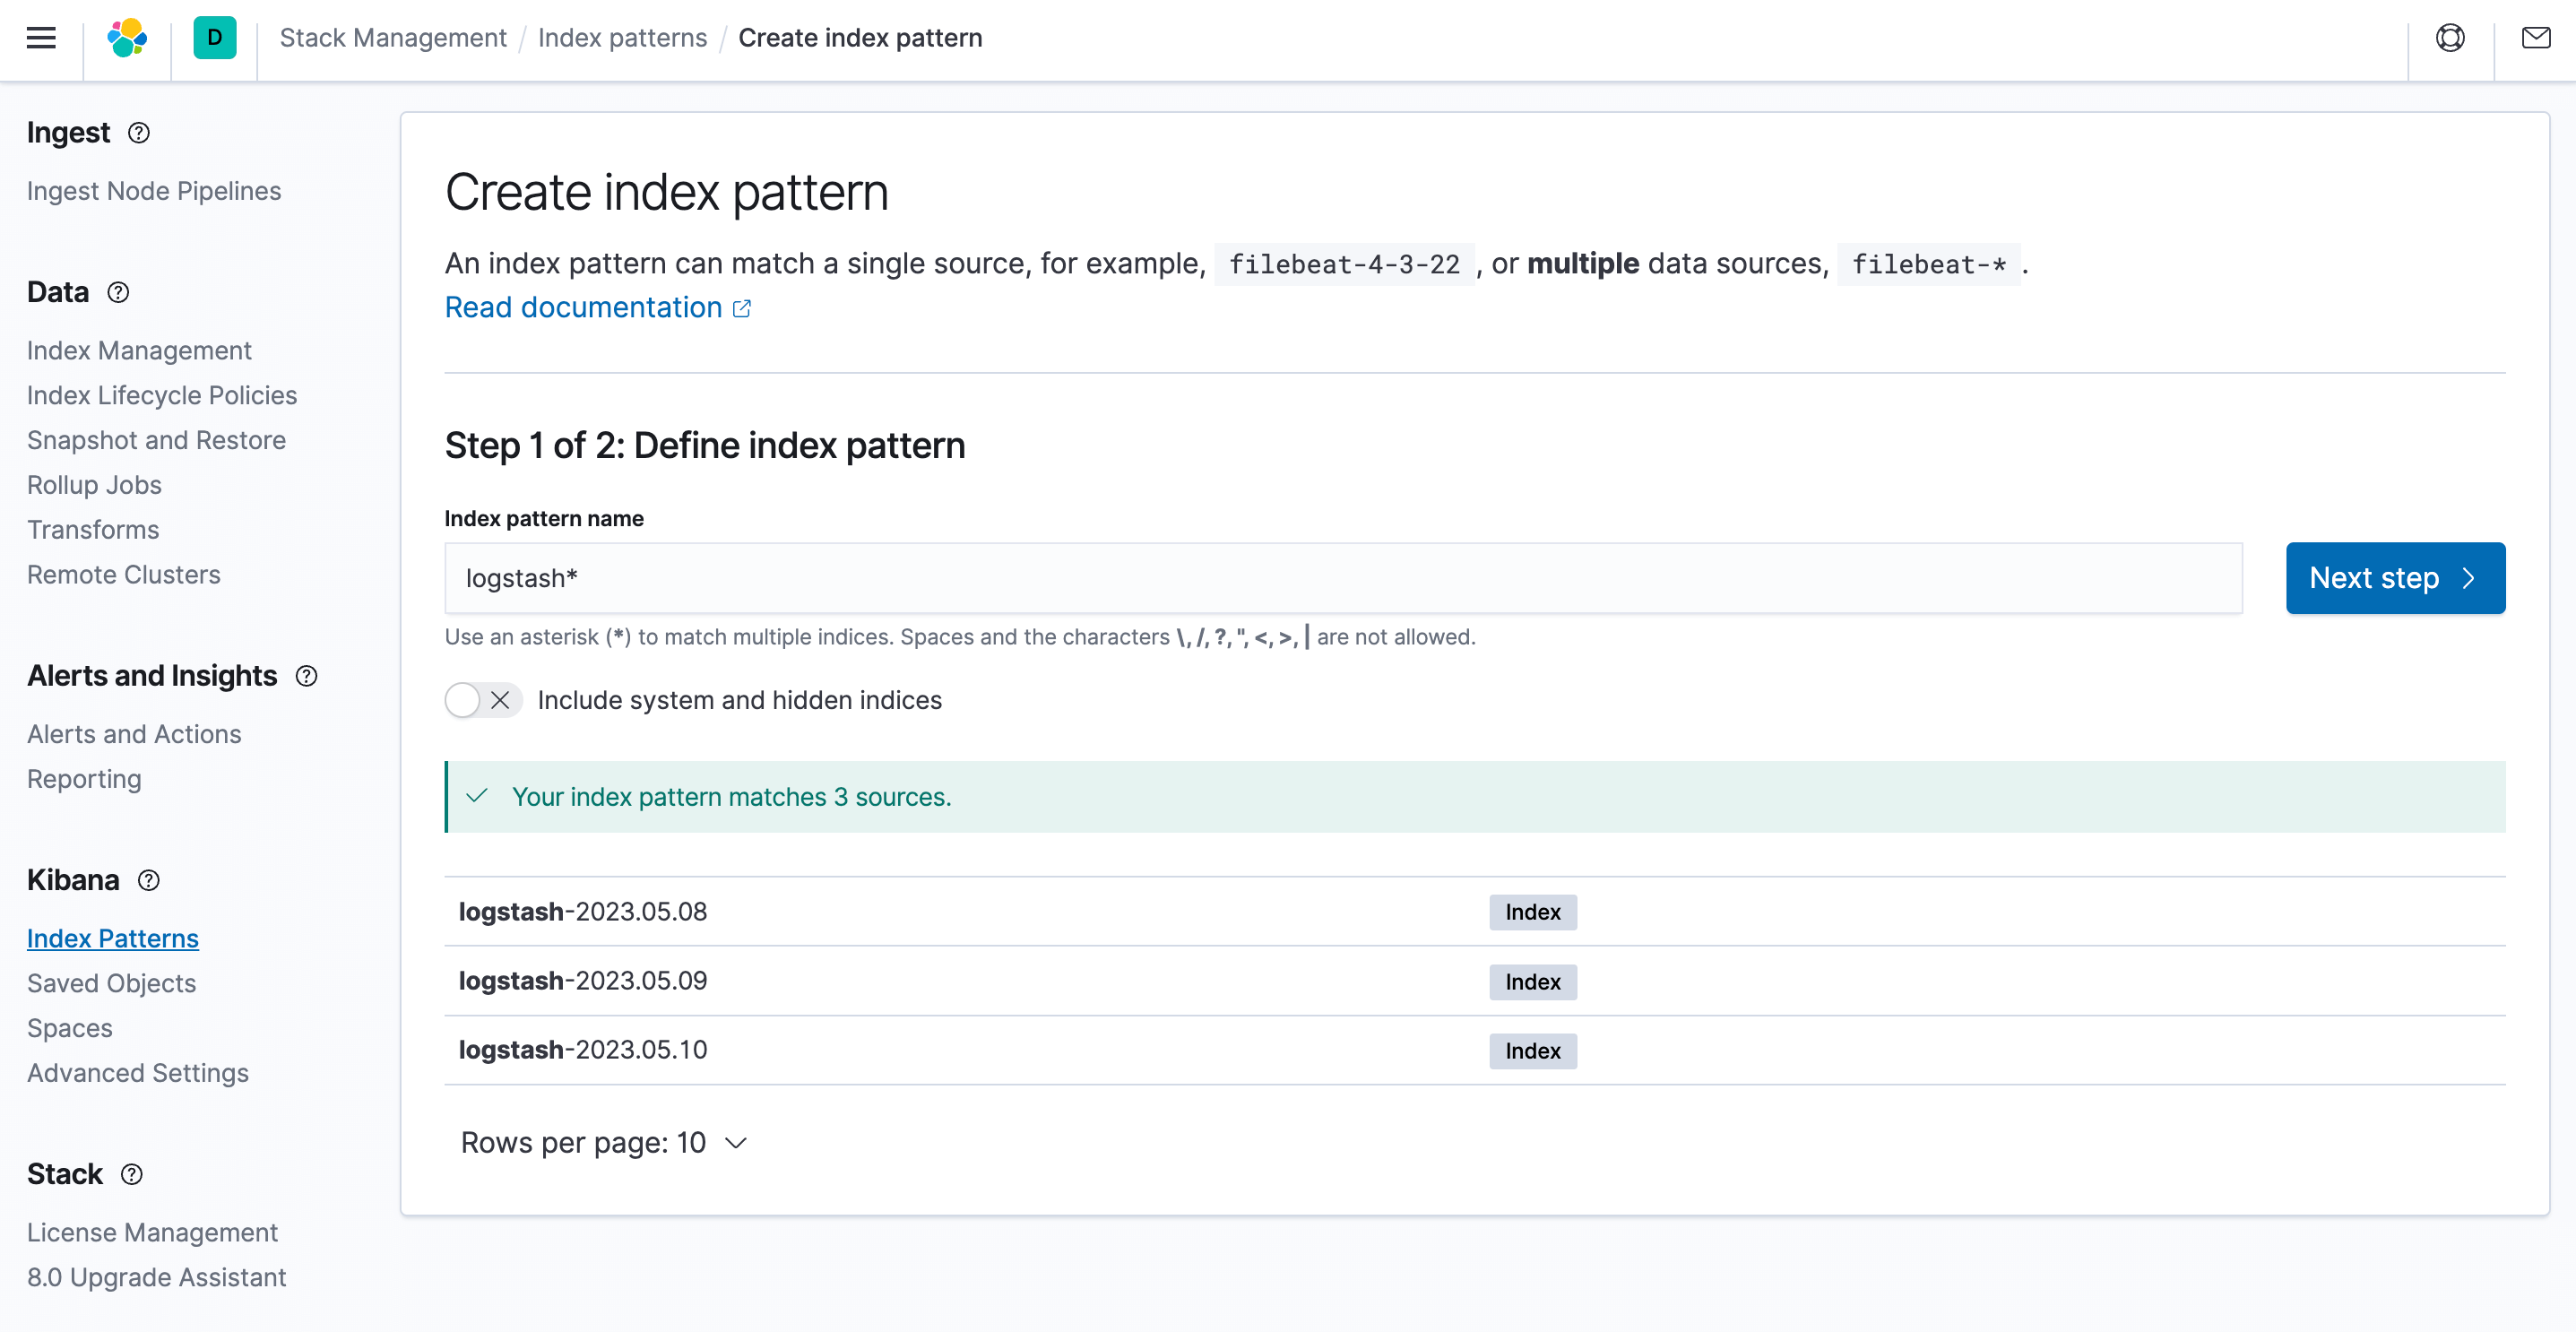
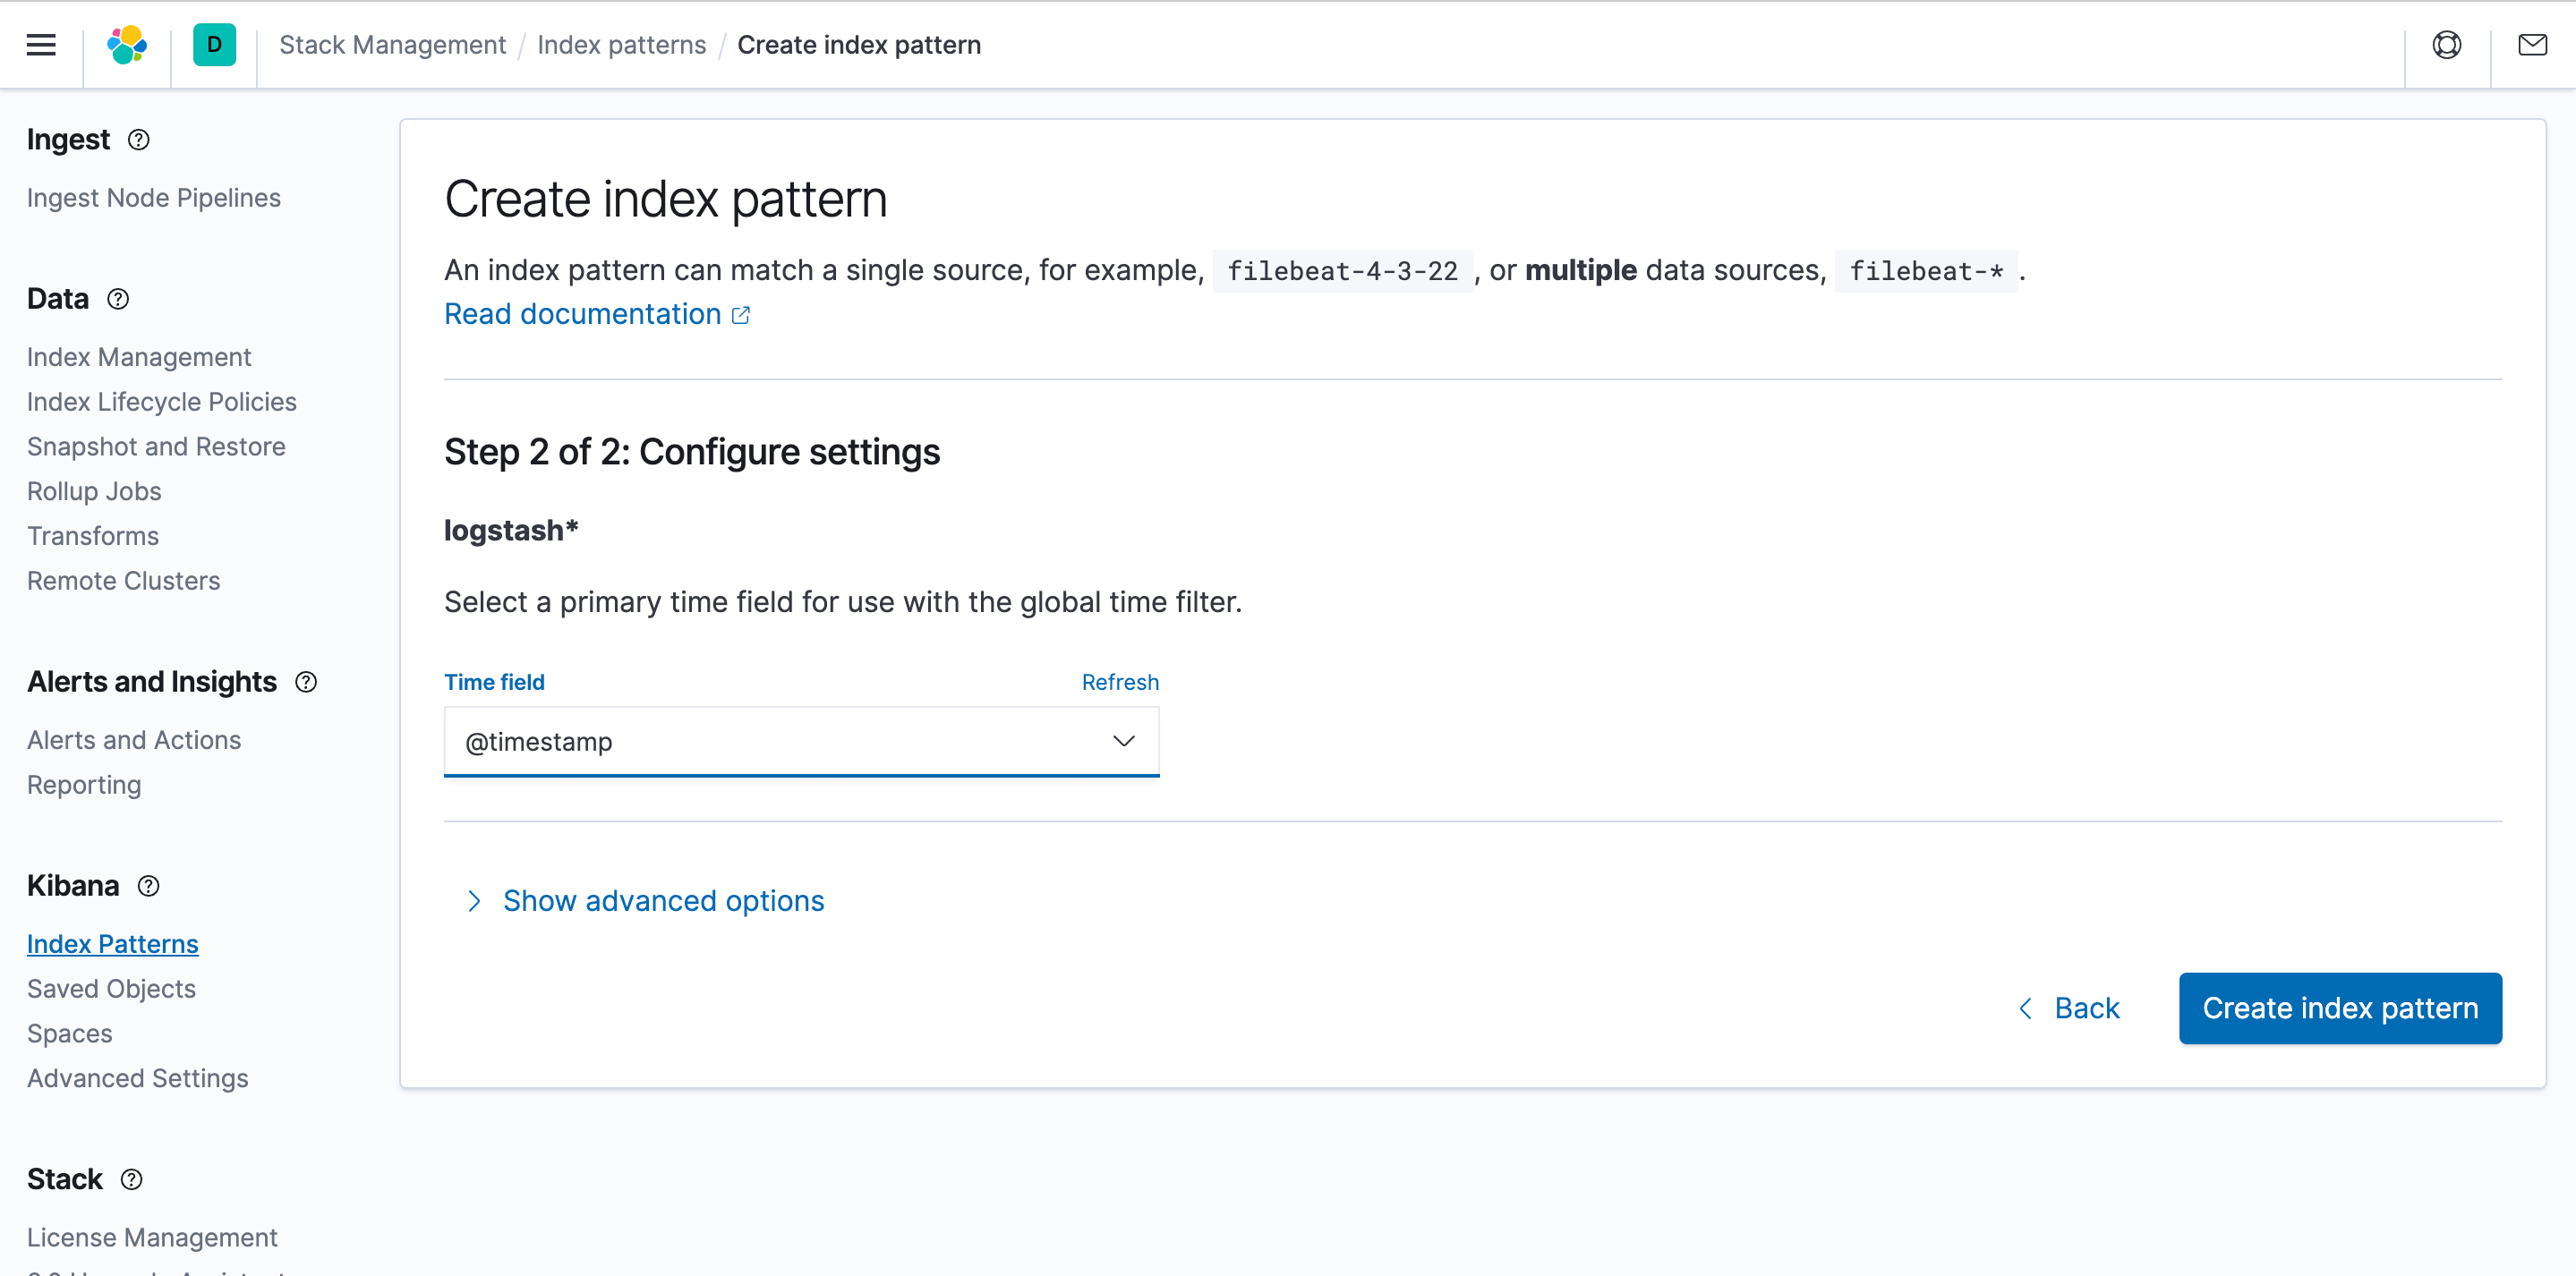
To discover and view logs in Kibana, you need to create an index pattern. Select index patterns and click Create.
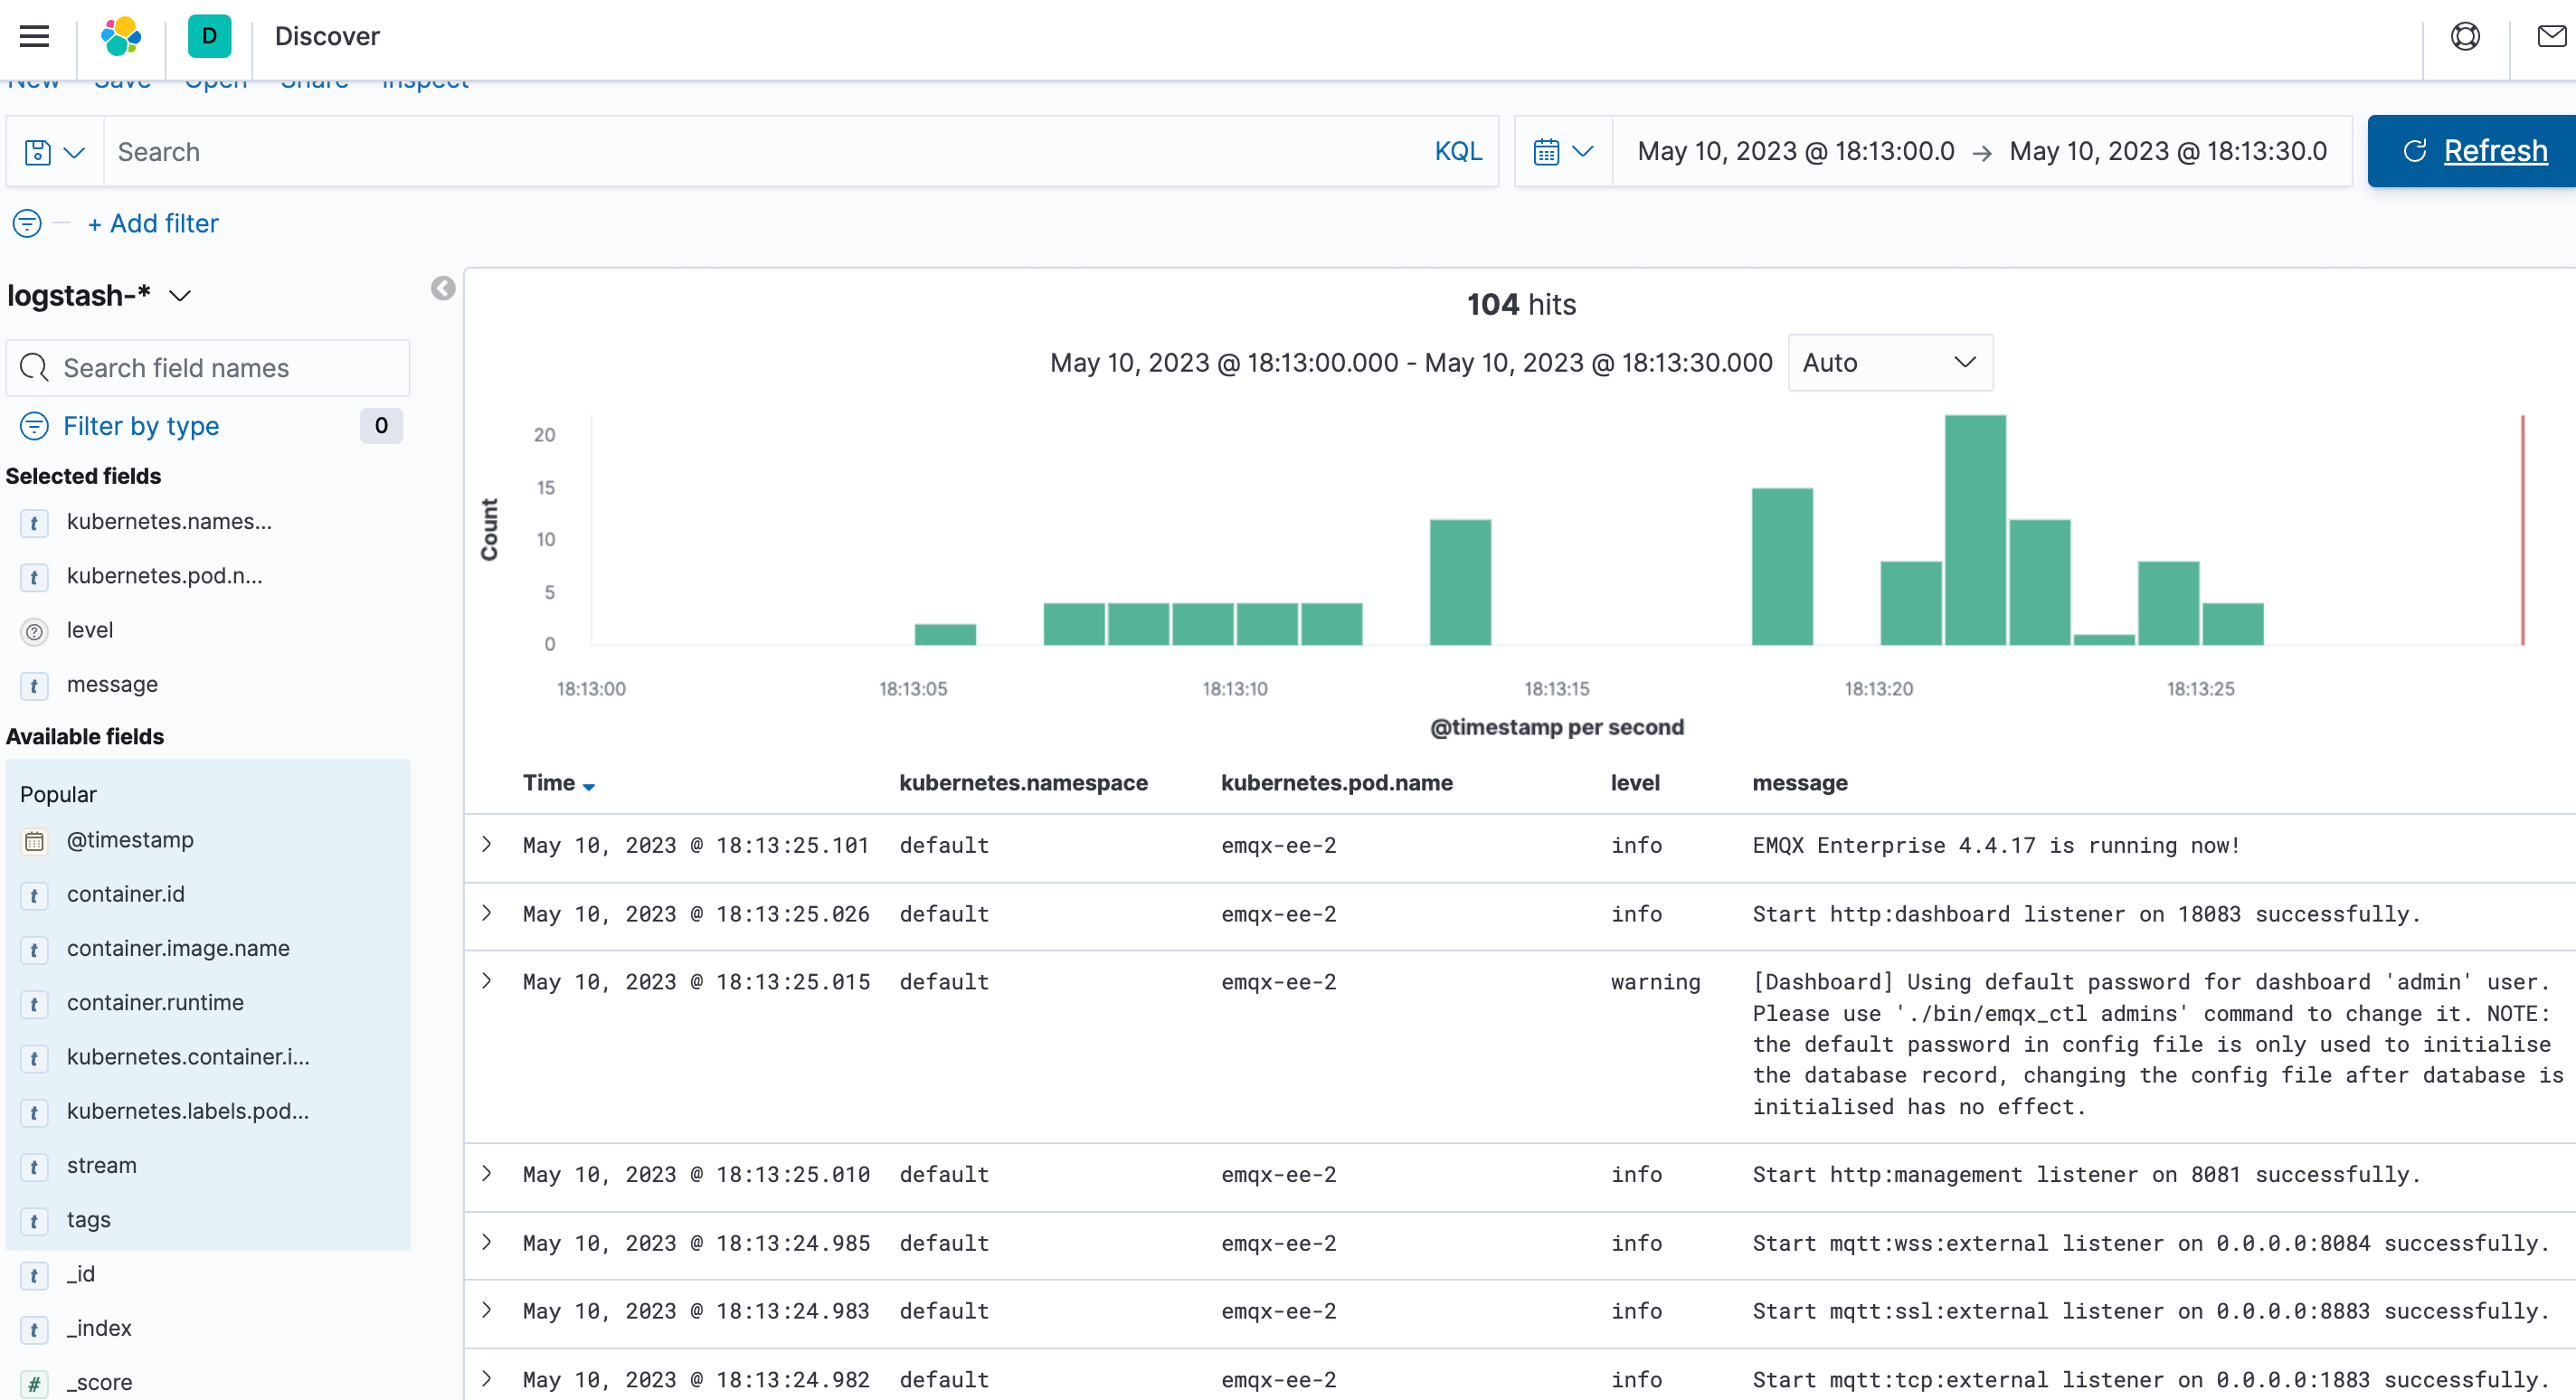
Verify that the EMQX cluster logs are collected.