Alarms
The Alarms page in the EMQX Dashboard displays both currently active alarms and historical (cleared) alarms. This allows administrators to monitor and manage system anomalies in real time.
Each alarm record contains the following details:
- Name: Identifier of the resource or component raising the alarm (e.g., connector, plugin, etc.)
- Message: The specific error message or description (e.g.,
resource down: timeout) - Trigger Node: The EMQX node that reported the alarm
- Level: The severity level (e.g., Warning, Critical)
- Activate At: Timestamp when the alarm was triggered
- Duration: How long the alarm has remained active
Active Alarms
On the Active tab, you can view all alarms that are currently active in the system.
Available Actions
- Refresh: Click the Refresh button to update the list with the latest alarm data.
- Settings: Click Settings to navigate to the Monitoring settings page, where you can configure alarm trigger thresholds and check intervals.
- Set Up Webhook: Click Set Up Webhook to enable webhook-based notification for alarm events. For setup details, refer to Integrate Webhook to Send Alarm Events.
- Deactivate (Manual): In some cases, alarms (e.g., from client disconnections or resource timeouts) may not automatically resolve. Click the Deactivate button in the Actions column to manually clear the alarm.
Tip: Manual deactivation should only be used when automatic recovery is not triggered, such as after a disconnected client or a failed connector that no longer exists.
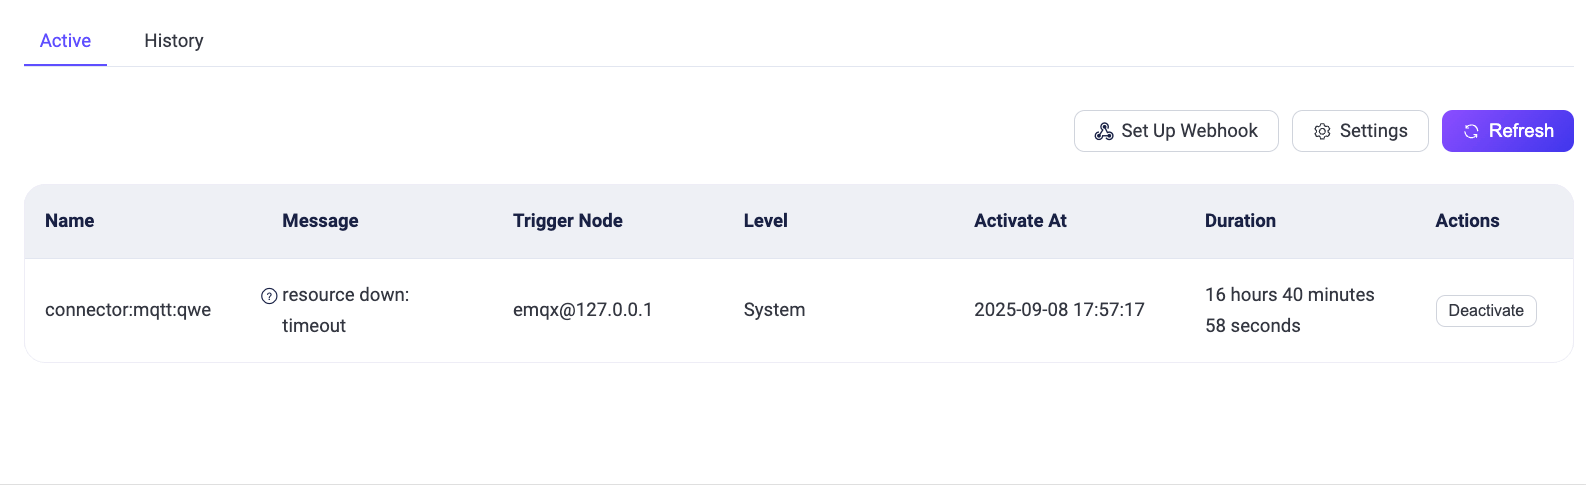
Example
The image below shows an active system alarm triggered by a failed MQTT connector (connector:mqtt:qwe) due to a resource timeout. The Deactivate button is available to manually resolve this alarm if necessary.
Note
Currently, alerts are node-based. You can only clear alerts that were triggered on the node you are logged into. For example, if you are logged into emqx@10.50.0.12, you cannot clear alerts triggered on emqx@127.0.0.1.
This limitation only applies to cluster mode and does not affect single-node deployments.
Historical Alarms
Navigate to the History tab to view past alarms that have been cleared or deactivated. Click Clear History Alarms to remove historical alarm records from the Dashboard.
Additional Information
For a comprehensive list of supported alarm types, how alarms are triggered, and webhook payload structure, refer to the Alarms Documentation.