Logs
Logs provide a reliable source of information for troubleshooting and system performance optimization. You can find the record about the access, operating, or network issues from EMQX logs.
EMQX supports both console logs and file logs. There are two different ways of outputting log data. You can choose the output method as needed or keep both. Console log refers to outputting log data to the console or command line interface. It is typically used during development and debugging, as it allows developers to quickly view log data in real-time as EMQX runs. File log refers to outputting log data to a file. This is typically used in production environments, where it is important to persist log data over time for analysis and troubleshooting.
The system's default log handling behavior can be configured via the environment variable EMQX_DEFAULT_LOG_HANDLER, which accepts the following settings:
file: Directs log output to files.console: Channels log output to the console.
Environment variable EMQX_DEFAULT_LOG_HANDLER defaults console, but explicitly set to file when EMQX is initiated via systemd's emqx.service file.
To minimize the impact of logs on system operation, for example, when the log data is too much or the log writing is too slow, EMQX activates the overload protection mechanism by default to better serve our users.
Log Level
EMQX log has 6 out of the 8 levels (RFC 5424), with warning as the default level, from low to high these levels are:
debug < info < notice < warning < error < criticalThe table below describes the meaning and output contents for each log level.
| Log Level | Meaning | Output Examples |
|---|---|---|
| debug | Detailed information about the internal workings of a program, helping to debug and diagnose issues in the code. It is not recommended to output this level of logging directly to the production environment. Instead, enable Log Trace for a specific client. | Variable values, function call stacks, and other detailed debugging data. |
| info | Useful information that is more general than debug-level logs. | Minor abnormalities such as authorization denial, and management operation results, such as a successful configuration change. |
| notice | Important system information indicating that an event has occurred, but no action is required. | Component restarted per request from dashboard or CLI |
| warning | Potential issues or errors that require action; typically used for proactive monitoring and detecting potential problems before they become critical issues. | Disconnections, connection timeouts, authentication failures, and other similar events. |
| error | The occurrence of an error that requires error handling; typically used to flag errors so that administrators can quickly detect and resolve issues. | Fails to connect to an external database, to subscribe to a non-existent topic, or to parse a configuration file, or other similar events. |
| critical | Critical error that results in system crashes or prevents it from functioning; typically used to flag severe problems so that administrators can take immediate action. | A component is unable to start or function normally due to incorrect configuration. |
Configure Logging via Dashboard
This section mainly describes how to configure logging with EMQX Dashboard. Changes take effect immediately without restarting the node.
Go to EMQX Dashboard. Click Management -> Logging on the left navigation menu. Select the corresponding tab for configurations on the console log or file log.
Configure Console Log
On the Logging page, select the Console Log tab.
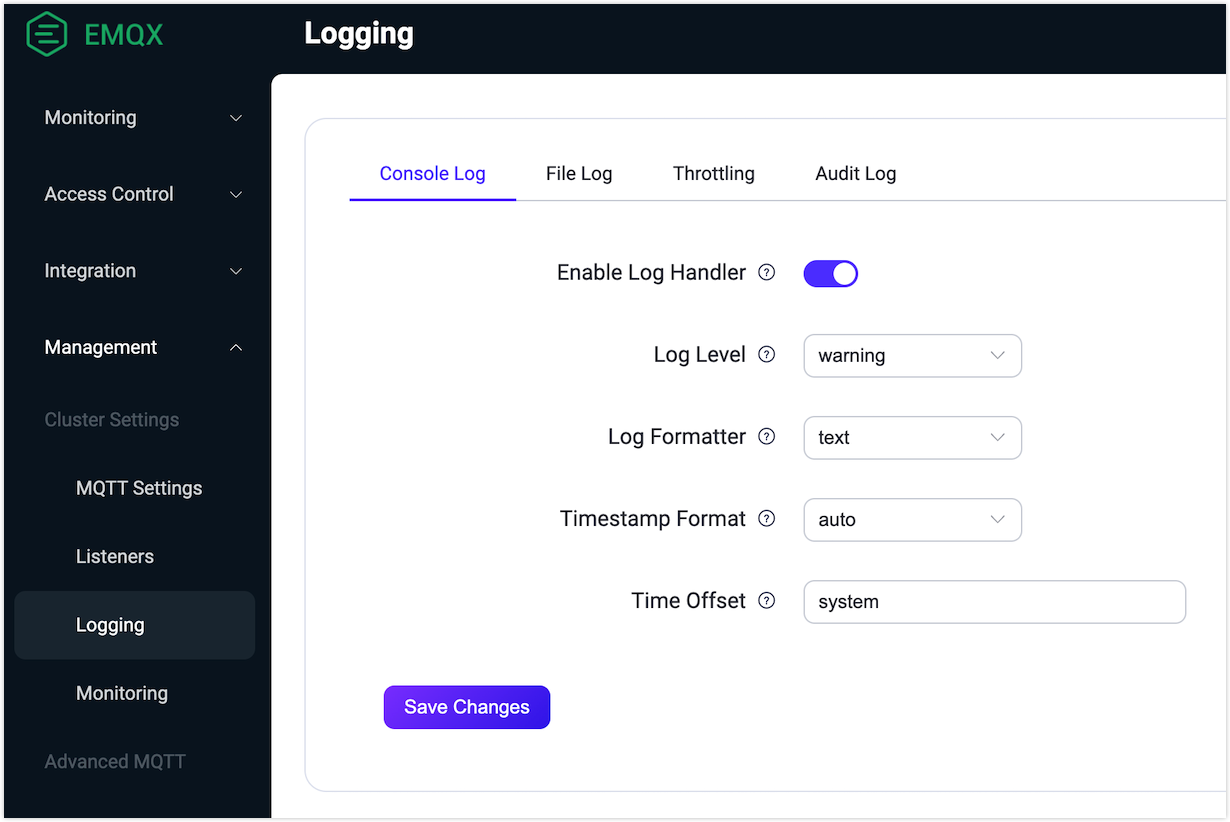
Configure the following settings for the console log handler:
Enable Log Handler: Click the toggle switch to enable the console log handler.
Log Level: Select the log level to use from the drop-down list. The default value is
warning.Log Formatter: Select the log format from the drop-down list. Optional values are
textandJSON. The default value istext.Timestamp Format: Select the format of the timestamp in the log. Optional values are:
auto: Automatically determines the timestamp format based on the log formatter being used. Utilizesrfc3339format for text formatters, andepochformat for JSON formatters.epoch: Represents timestamps in microseconds precision Unix epoch format.rfc3339: Uses RFC3339 compliant format for date-time strings. For example,2024-03-26T11:52:19.777087+00:00.
Time Offset: Define the time offset relative to UTC in the log. By default, it follows the system, with a default value of
system.
After you finish the configurations, click Save Changes.
Configure File Log
On the Logging page, select the File Log tab.
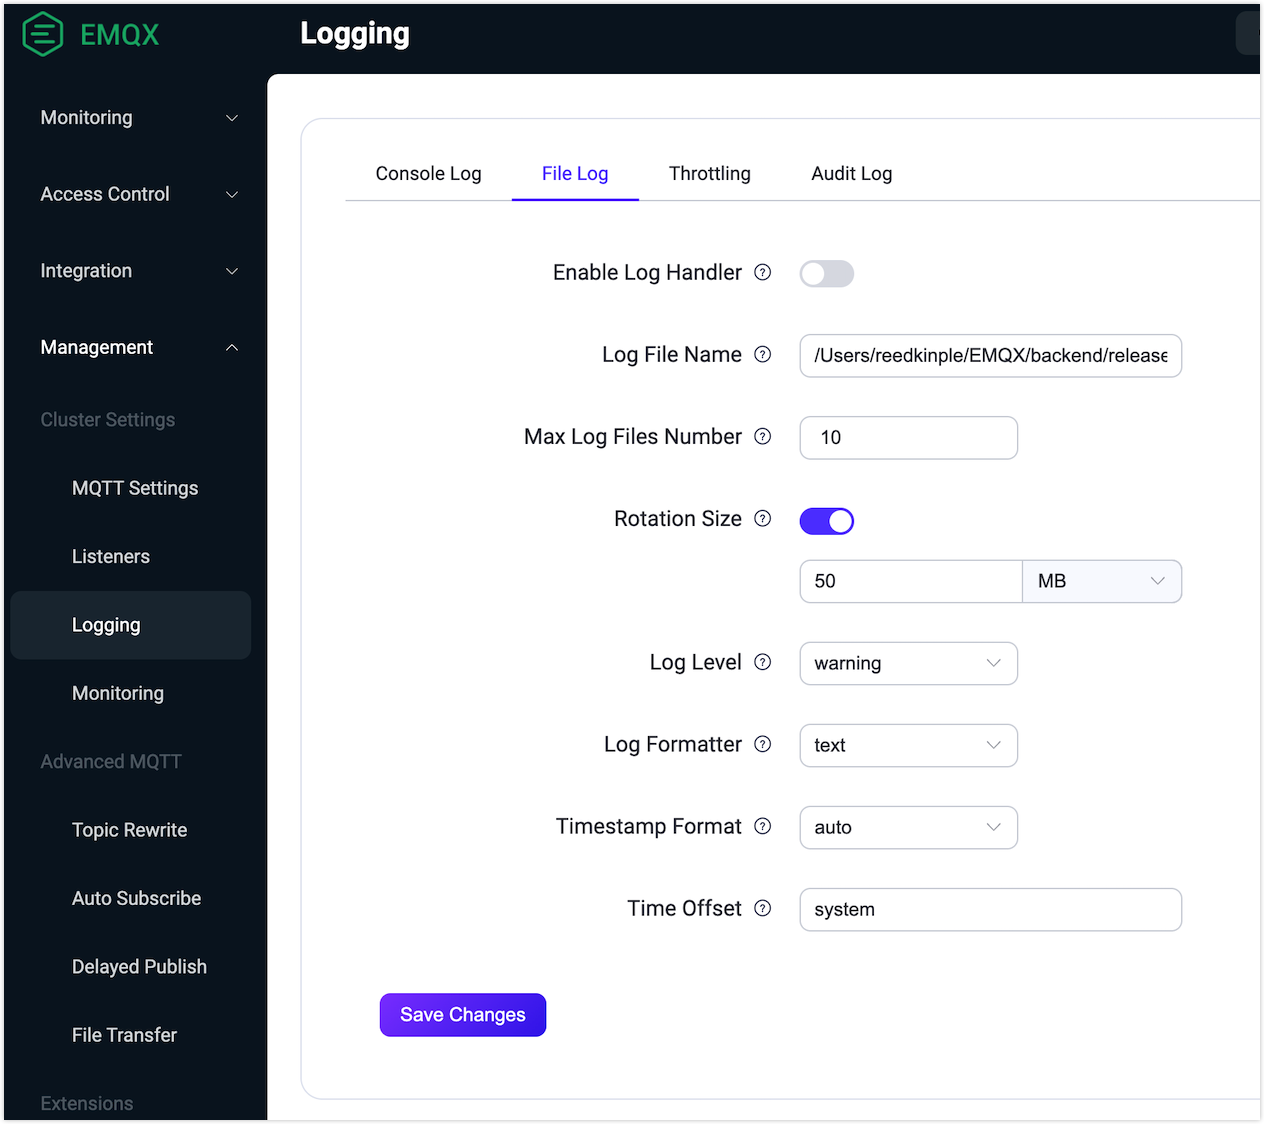
Configure the following settings for file log handler:
Enable Log Handler: Click the toggle switch to enable the file log handler.
Log File Name: Type the name of the log file. The default name is
log/emqx.log.Max Log Files Number: Specify the maximum number of rotated log files. The default value is
10.Rotation Size: Log file will be rotated once it reaches the specified size. It is by default enabled. You can type the specific value in the text box below. If you disable it, the value will be
infinity, which means the log file will grow indefinitely.Log Level: Select the log level to use from the drop-down list. Optional values are:
debug,info,notice,warning,error,critical. Default value is:warning.Log Formatter: Select the log format from the drop-down list. Optional values are
textandJSON. The default value istext.Timestamp Format: Select the format of the timestamp in the log. Optional values are:
auto: Automatically determines the timestamp format based on the log formatter being used. Utilizesrfc3339format for text formatters, andepochformat for JSON formatters.epoch: Represents timestamps in microseconds precision Unix epoch format.rfc3339: Uses RFC3339 compliant format for date-time strings. For example,2024-03-26T11:52:19.777087+00:00.
Time Offset: Define the time offset relative to UTC in the log. By default, it follows the system, with a default value of
system.
After you finish the configurations, click Save Changes.
When file logging is enabled (log.to = file or both), the following files will appear in the log directory:
- emqx.log.N: Log file prefixed with emqx.log, that contains all the log messages of EMQX, such as
emqx.log.1,emqx.log.2... - emqx.log.siz and emqx.log.idx: System files used to record log rotation information. Do not change manually.
Configure Logging via Configuration File
You can also configure EMQX logging through configuration files. For example, if you want to export the warning-level logs to a file or output with a console, you can modify the configuration items under log in base.hocon as shown below. The configuration takes effect after the node restarts. For more information on configuring logging with configuration files, see Configuration - Logs.
log {
  file {
    default {
      enable = true
      formatter = text
      level = warning
      path = "/Users/emqx/Downloads/emqx-560/log/emqx.log"
      rotation_count = 10
      rotation_size = 50MB
      time_offset = system
      timestamp_format = auto
  }
  console {
    formatter = json
    level = debug
    time_offset = system
    timestamp_format = auto
  }
}
Log Format
The format of the log message (with different fields separated by spaces) is as follows:
**timestamp level tag clientid msg peername username ...**where,
- timestamp: An RFC-3339 formatted timestamp indicating when the log entry was created.
- level: The severity level of the log, enclosed in brackets. Format: [level], which can be standard log levels such as
info,warning,error, etc. - tag: All-uppercase single word used for categorizing logs for easier searching and analysis, e.g., MQTT, AUTHN, AUTHZ
- clientid: Included only when the log is about a specific client. Identifies the client related to the log entry.
- msg: The content of the log message. To enhance searchability and readability, most messages adopt a
snake_caseformatting style, such asmqtt_packet_received. Note: Not all messages follow this format; some may vary. - peername: The client's source IP address and port number in
IP:portformat, indicating the connection origin. - username: Present only for logs associated with a client having a specified non-empty username. Indicates the username of the client involved.
- ...: Additional arbitrary fields may follow the msg field, providing more context or details as needed.
Log Message Example
2024-03-20T11:08:39.568980+01:00 [warning] tag: AUTHZ, clientid: client1, msg: cannot_publish_to_topic_due_to_not_authorized, peername: 127.0.0.1:47860, username: user1, topic: republish-event/1, reason: not_authorizedLog Throttling
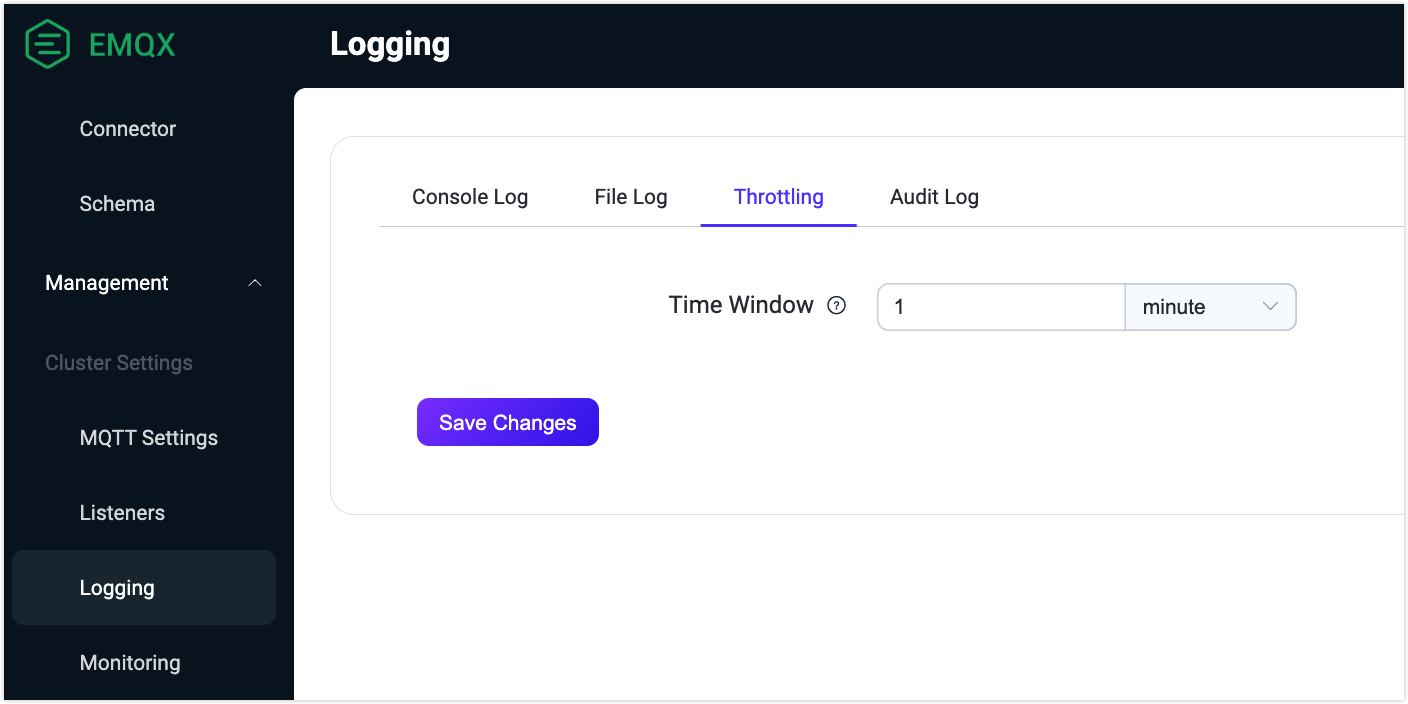
Log Throttling is a feature designed to mitigate the risk of log flooding by limiting the logging of repeated events within a specified time window. By only logging the first event and suppressing subsequent identical events within this window, log management becomes more efficient without sacrificing observability.
You can configure the throttling time window through the Dashboard by selecting Management -> Logging and clicking the Throttling tab. The default time window is set to 1 minute, with a minimum allowable value of 1 second.
You can also directly configure the time window in the configuration file as follows:
log {
  throttling {
    time_window = "5m"
  }
}
Log throttling is enabled by default and applies to selected log events such as authorization failures or message queue overflows. However, when the log level for console or file is set to debug, throttling is disabled to ensure detailed logging for troubleshooting.
Throttling is applied only to the following log events:
- "authentication_failure"
- "authorization_permission_denied"
- "cannot_publish_to_topic_due_to_not_authorized"
- "cannot_publish_to_topic_due_to_quota_exceeded"
- "connection_rejected_due_to_license_limit_reached"
- "data_bridge_buffer_overflow"
- "dropped_msg_due_to_mqueue_is_full"
- "dropped_qos0_msg"
- "external_broker_crashed"
- "failed_to_fetch_crl"
- "failed_to_retain_message"
- "handle_resource_metrics_failed"
- "retain_failed_for_payload_size_exceeded_limit"
- "retain_failed_for_rate_exceeded_limit"
- "retained_delete_failed_for_rate_exceeded_limit"
- "socket_receive_paused_by_rate_limit"
- "transformation_failed"
- "unrecoverable_resource_error"
- "validation_failed"
Note
The list of throttled events is subject to updates.
If any events are throttled within a time window, a summary warning message will log the count of dropped events for each type. For example, if 5 unauthorized subscription attempts occur within a window, the following events will be logged:
2024-03-13T15:45:11.707574+02:00 [warning] clientid: test, msg: authorization_permission_denied, peername: 127.0.0.1:54870, username: test, topic: t/#, action: SUBSCRIBE(Q0), source: file
2024-03-13T15:45:53.634909+02:00 [warning] msg: log_events_throttled_during_last_period, period: 1 minutes, 0 seconds, dropped: #{authorization_permission_denied => 4}
As you can see, the first "authorization_permission_denied" event is fully logged. The next 4 similar events are dropped but their number is recorded in "log_events_throttled_during_last_period" statistics.