Ingest MQTT Data into Elasticsearch
Elasticsearch is a distributed search and data analysis engine that offers full-text search, structured search, and analysis capabilities for diverse data types. By integrating with Elasticsearch, EMQX Cloud enables seamless incorporation of MQTT data into Elasticsearch for storage. This integration leverages the powerful scalability and analysis capabilities of Elasticsearch, providing efficient and scalable data storage and analysis solutions for IoT applications.
This page details the data integration between EMQX Cloud and Elasticsearch and provides practical guidance on rule and action creation.
How It Works
Data integration with Elasticsearch is an out-of-the-box feature in EMQX Cloud, combining EMQX Cloud's device access and message transmission capabilities with Elasticsearch’s data storage and analysis capabilities. Seamless integration of MQTT data can be achieved through simple configuration.
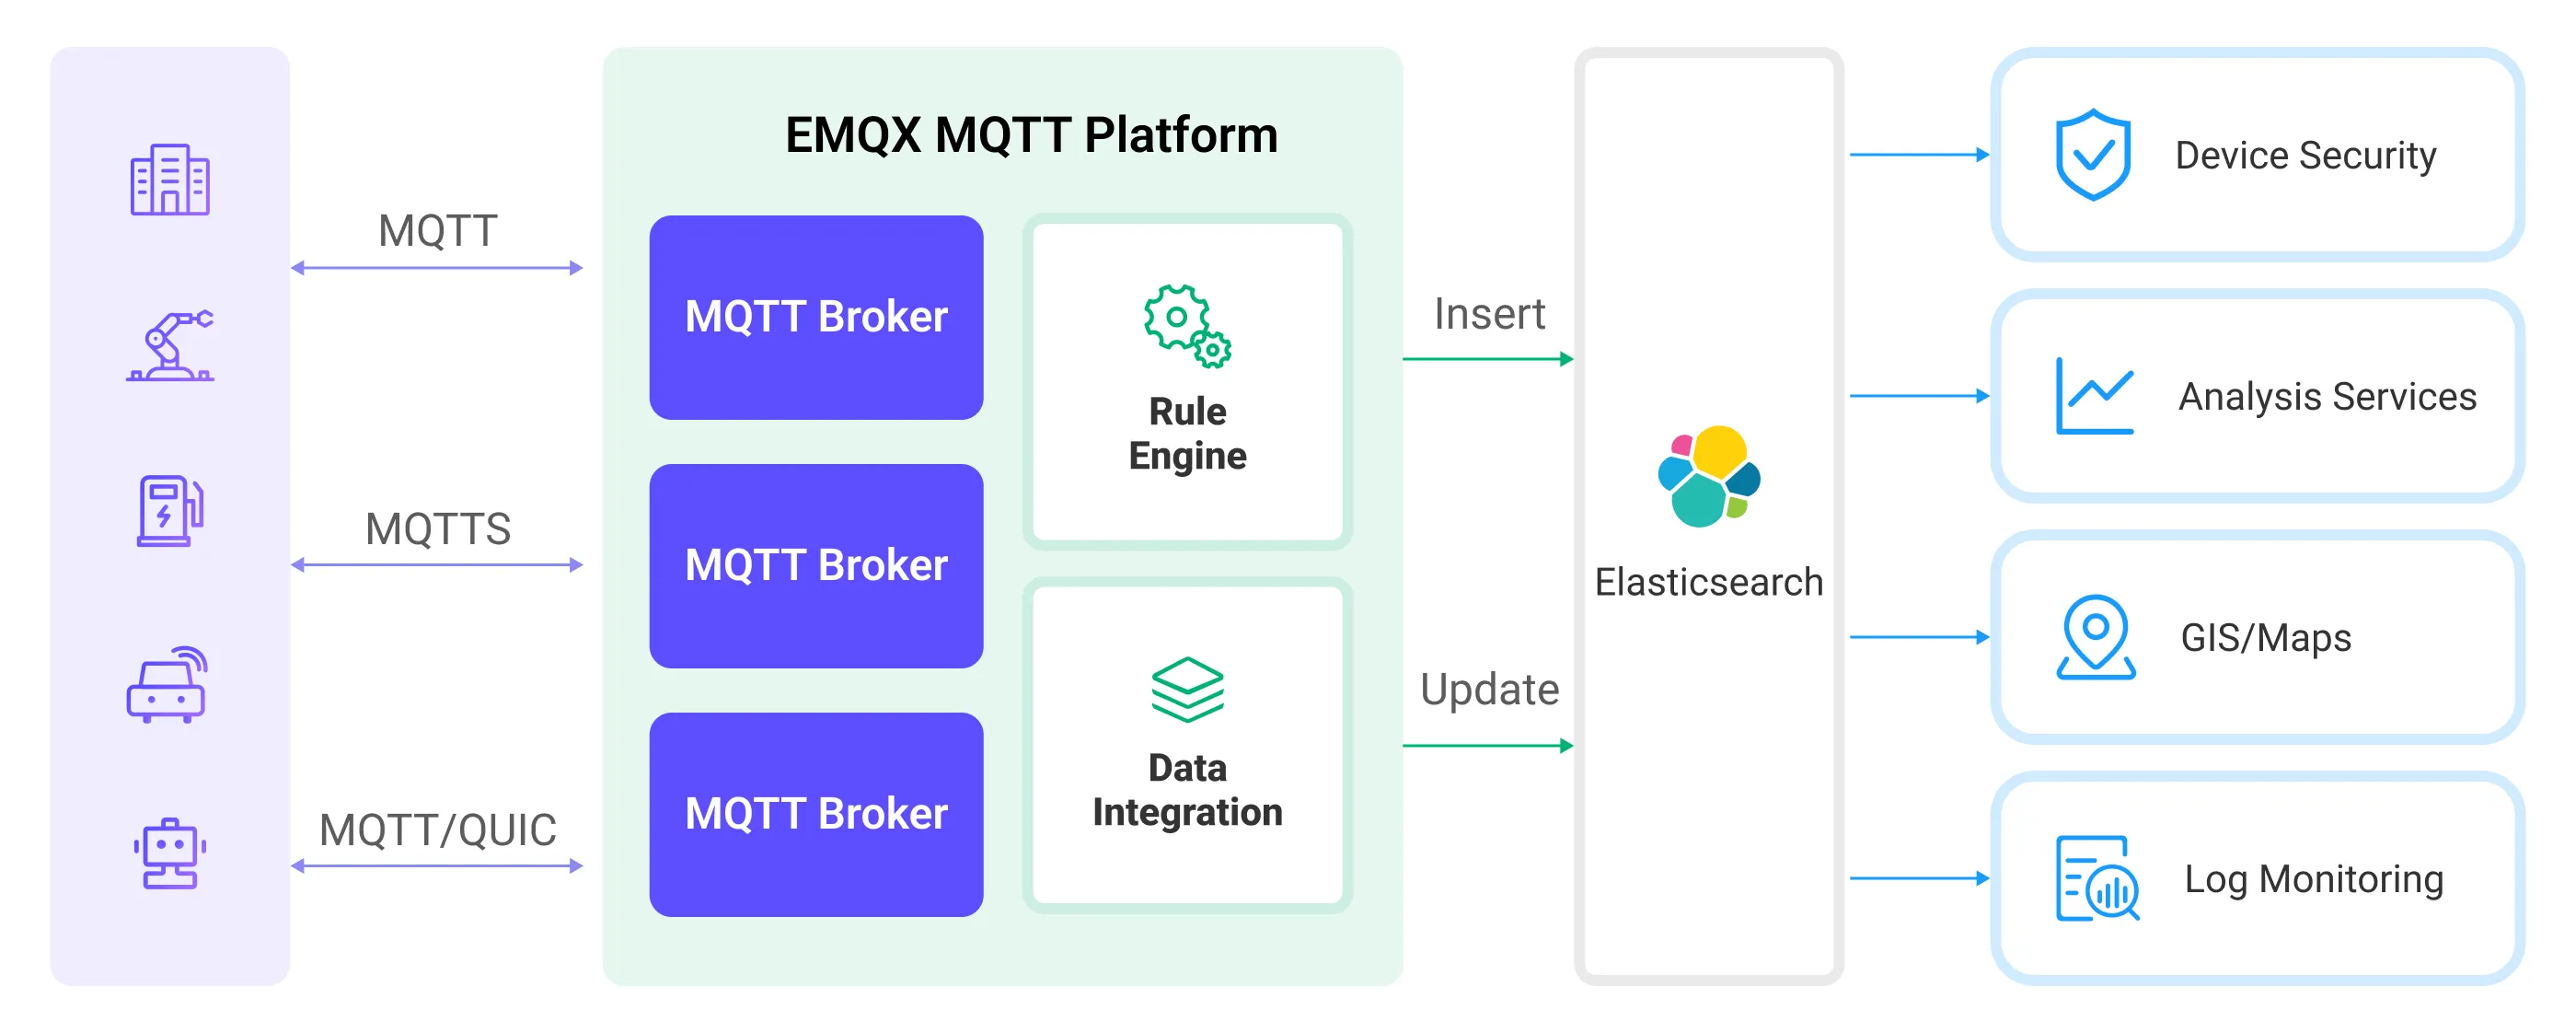
EMQX Cloud and Elasticsearch provide a scalable IoT platform for efficiently collecting and analyzing real-time device data. In this architecture, EMQX Cloud acts as the IoT platform, responsible for device access, message transmission, and data routing, while Elasticsearch serves as the data storage and analysis platform, handling data storage, data search, and analysis.
EMQX Cloud forwards device data to Elasticsearch through its rule engine and action, where Elasticsearch utilizes its powerful search and analysis capabilities to generate reports, charts, and other data analysis results, displayed to users through Kibana’s visualization tools. The workflow is as follows:
- Device Message Publishing and Receiving: IoT devices connect via the MQTT protocol and publish telemetry and status data to specific topics, which EMQX Cloud receives and compares in the rule engine.
- Rule Engine Processes Messages: Using the built-in rule engine, MQTT messages from specific sources can be processed based on topic matching. The rule engine matches corresponding rules and processes messages, such as transforming data formats, filtering out specific information, or enriching messages with context information.
- Writing to Elasticsearch: Rules defined in the rule engine trigger the operation of writing messages to Elasticsearch. Elasticsearch action provides flexible operation methods and document templates to construct documents in the desired format, writing specific fields from messages into corresponding indices in Elasticsearch.
Once device data is written to Elasticsearch, you can flexibly use Elasticsearch's search and analysis capabilities to process data, such as:
- Log Monitoring: IoT devices generate a large amount of log data, which can be sent to Elasticsearch for storage and analysis. By connecting to visualization tools, such as Kibana, charts can be generated based on these log data, displaying real-time information on device status, operation records, and error messages. This helps developers or operators quickly locate and resolve potential issues.
- Geographical Data (Maps): IoT devices often generate geographic location data, which can be stored in Elasticsearch. Using Kibana’s Maps feature, device location information can be visualized on a map for tracking and analysis.
- Endpoint Security: Security log data from IoT devices can be sent to Elasticsearch. By connecting to Elastic Security, security reports can be generated, monitoring the security status of devices in real time, detecting potential security threats, and responding accordingly.
Features and Advantages
The Elasticsearch data integration offers the following features and advantages to your business:
- Efficient Data Indexing and Search: Elasticsearch can easily handle large-scale real-time message data from EMQX Cloud. Its powerful full-text search and indexing capabilities enable IoT message data to be quickly and efficiently retrieved and queried.
- Data Visualization: Through integration with Kibana (part of the Elastic Stack), powerful data visualization of IoT data is possible, aiding in understanding and analyzing the data.
- Flexible Data Manipulation: EMQX Cloud's Elasticsearch integration supports dynamic setting of indices, document IDs, and document templates, allowing for the creation, update, and deletion of documents, suitable for a wider range of IoT data integration scenarios.
- Scalability: Both Elasticsearch and EMQX Cloud support clustering and can easily expand their processing capabilities by adding more nodes, facilitating uninterrupted business expansion.
Before you Start
This section introduces the preparatory work needed before creating Elasticsearch data integration in EMQX Cloud, including installing Elasticsearch and creating indices.
Prerequisites
- Knowledge about data integration
- Knowledge about data integration rules
Set up Network
Before configuring data integration, you must create an EMQX Cloud deployment and ensure network connectivity between EMQX Cloud and the target service.
For Dedicated Flex deployments:
Create a VPC Peering Connection between the EMQX Cloud VPC and the target service VPC. After the peering connection is established, EMQX Cloud can access the target service through its private IP address.
If access through a public IP is required, configure a NAT Gateway to enable outbound connectivity.
For BYOC (Bring Your Own Cloud) deployments:
Create a VPC peering connection between the VPC where the BYOC deployment is running and the VPC hosting the target service. Once peering is in place, the target service can be accessed via its private IP address.
If the target service must be accessed through a public IP, configure a NAT Gateway in the BYOC VPC using your cloud provider’s console.
Deploy Elasticsearch and Create an Index
EMQX Cloud supports integration with privately deployed Elasticsearch or with Elastic in the cloud. You can use Docker or Elastic Cloud to deploy an Elasticsearch instance.
Deploy Elasticsearch with Docker
If you don't have a Docker environment, install Docker.
Start an Elasticsearch container with X-Pack security authentication enabled. Set the default username
elasticwith the passwordpublic.bashdocker run -d --name elasticsearch \ -p 9200:9200 \ -p 9300:9300 \ -e "discovery.type=single-node" \ -e "xpack.security.enabled=true" \ -e "ELASTIC_PASSWORD=public" \ docker.elastic.co/elasticsearch/elasticsearch:7.10.1Create the
device_dataindex for storing messages published by devices. Make sure to replace Elasticsearch username and password.bashcurl -u elastic:public -X PUT "localhost:9200/device_data?pretty" -H 'Content-Type: application/json' -d' { "mappings": { "properties": { "ts": { "type": "date" }, "clientid": { "type": "keyword" }, "payload": { "type": "object", "dynamic": true } } } }'
Deploy Elastic in Cloud
For tutorials on using Elastic Cloud, please refer to their official guides.
- Elastic Cloud offers a 14-day free trial, where you can create your own deployment. After registration, you'll see the Elastic Cloud console.
- To initiate a deployment, click Create deployment.
- Note down the Elasticsearch endpoint information and relevant authentication details for future connections.
- Create an index named
device_datafor storing messages published by devices, ensuring to replace Elasticsearch username and password.
  curl -u elastic:xxxx -X PUT "{Elasticsearch endpoint}/device_data?pretty" -H 'Content-Type: application/json' -d'
  {
    "mappings": {
      "properties": {
        "ts": { "type": "date" },
        "clientid": { "type": "keyword" },
        "payload": {
          "type": "object",
          "dynamic": true
        }
      }
    }
  }'
Create a Connector
Before creating data integration rules, you need to first create an Elasticsearch connector to access the Elasticsearch server.
Go to your deployment. Click Data Integration from the left-navigation menu. If it is the first time for you to create a connector, select Elasticsearch under the Data Forward category. If you have already created connectors, select New Connector and then select Elasticsearch under the Data Forward category.
Connector Name: The system will automatically generate a connector name.
Enter the connection information:
- Server: Enter the REST interface URL of the Elasticsearch service as
http://{host}:9200or as appropriate. - Username: Specify the Elasticsearch service username as
elastic. - Password: Provide the Elasticsearch service password
- Enable TLS: If you want to establish an encrypted connection, click the toggle switch.
- Configure advanced settings according to your business needs (optional).
- Server: Enter the REST interface URL of the Elasticsearch service as
Click the Test button. If Elasticsearch is accessible, a prompt indicating connector available will be returned.
Click the New button to complete the creation.
Next, you can create data bridge rules based on this Connector.
Create a Rule
This section demonstrates how to create an Elasticsearch Rule and add action to the rule via the EMQX Cloud Console.
Click New Rule in the Rules area or click the New Rule icon in the Actions column of the connector you just created.
Set the rules in the SQL Editor based on the feature to use, Our goal is to trigger the engine when the client sends a temperature and humidity message to the
temp_hum/emqxtopic. Here you need a certain process of SQL:sqlSELECT timestamp as up_timestamp, clientid as client_id, payload FROM "temp_hum/emqx"TIP
If you are a beginner user, click SQL Examples and Try It Out to learn and test the SQL rule.
Click Next to add an action.
Select the connector you just created from the Connector dropdown box.
Configure the information for publishing messages from the EMQX Cloud to the Elasticsearch service:
Action: Optional actions
Create,Update, andDelete.Index Name: The name of the index or index alias on which to perform the action. Placeholders in
${var}format are supported.Document ID: Optional for
Createaction, required for other actions. The unique identifier of a document within the index. Placeholders in${var}format are supported. If an ID is not specified, Elasticsearch will generate one automatically.Routing: Specifies which shard of the index the document should be stored in. If left blank, Elasticsearch will decide.
Document Template: Custom document template, must be convertible into a JSON object and supports
${var}format placeholders, e.g.,{ "field": "${payload.field}"}or${payload}.Max Retries: The maximum number of times to retry when writing fails. The default is 3 attempts.
Overwrite Document (Specific to
Createaction): Whether to overwrite the document if it already exists. If “No”, the document write will fail.In this example, the index name is set to
device_data, using a combination of client ID and timestamp${clientid}_${ts}as the document ID. The document stores the client ID, current timestamp, and the entire message body. The document template is as follows:json{ "clientid": "${clientid}", "ts": ${ts}, "payload": ${payload} }
Expand Advanced Settings to configure Sync/Async mode, queue and cache, and other parameters as appropriate Advanced Settings Options (optional)
Click the Confirm button to complete the rule creation.
In the Successful new rule pop-up, click Back to Rules, thus completing the entire data integration configuration chain.
Test the Rule
You are recommended to use MQTTX to simulate temperature and humidity data reporting, but you can also use any other client.
Use MQTTX to connect to the deployment and send messages to the following Topic.
topic:
temp_hum/emqxclient id:
test_clientpayload:
json{ "temp": "27.5", "hum": "41.8" }
Use the
_searchAPI to view the contents of documents in an index to see if data has been written to thedevice_dataindex:bashcurl -u elastic:public -X GET "localhost:9200/device_data/_search?pretty"The correct response results are as follows:
json{ "took": 484, "timed_out": false, "_shards": { "total": 1, "successful": 1, "skipped": 0, "failed": 0 }, "hits": { "total": { "value": 1, "relation": "eq" }, "max_score": 1.0, "hits": [ { "_index": "device_data", "_type": "_doc", "_id": "mqttx_a2acfd19_1711359139238", "_score": 1.0, "_source": { "clientid": "mqttx_a2acfd19", "ts": 1711359139238, "payload": { "temp": "27.5", "hum": "41.8" } } } ] } }