Ingest MQTT Data into EMQX Tables
EMQX Tables is a native, fully managed time-series data storage service built into the EMQX Cloud. It is optimized for high-throughput, low-latency ingestion and analysis of MQTT data, making it ideal for Internet of Things (IoT) use cases.
Powered by GreptimeDB, EMQX Tables integrates seamlessly with EMQX Broker and supports InfluxDB Line Protocol, enabling efficient storage, querying, and visualization of telemetry data.
To learn more, see the EMQX Tables Overview.
This guide walks you through ingesting MQTT data into EMQX Tables by:
- Creating a connector
- Creating a rule with an EMQX Tables action
- Testing data ingestion and querying results
Prerequisites
You have created both of the following deployments:
- An EMQX Broker deployment: Serverless, Dedicated, or Dedicated Flex
- EMQX Tables deployment
You’re familiar with:
Connectivity Between Broker and Tables
The connection method depends on your Broker deployment type and network setup:
| Deployment Type | Condition | Connection | Action Required |
|---|---|---|---|
| Dedicated / Dedicated Flex | Same cloud platform, region, and network as Tables | Private (secure, low-latency) | Set up network sharing via Project-Level Network Management. |
| Dedicated / Dedicated Flex | Different region or network as Tables | Public internet over TLS | Enable NAT Gateway under the Broker deployment's Network Management settings. |
| Serverless | — | Public internet over TLS | No action required. Network Association and NAT Gateway are not applicable. |
Create an EMQX Tables Connector
Before you can write data, create a connector to EMQX Tables.
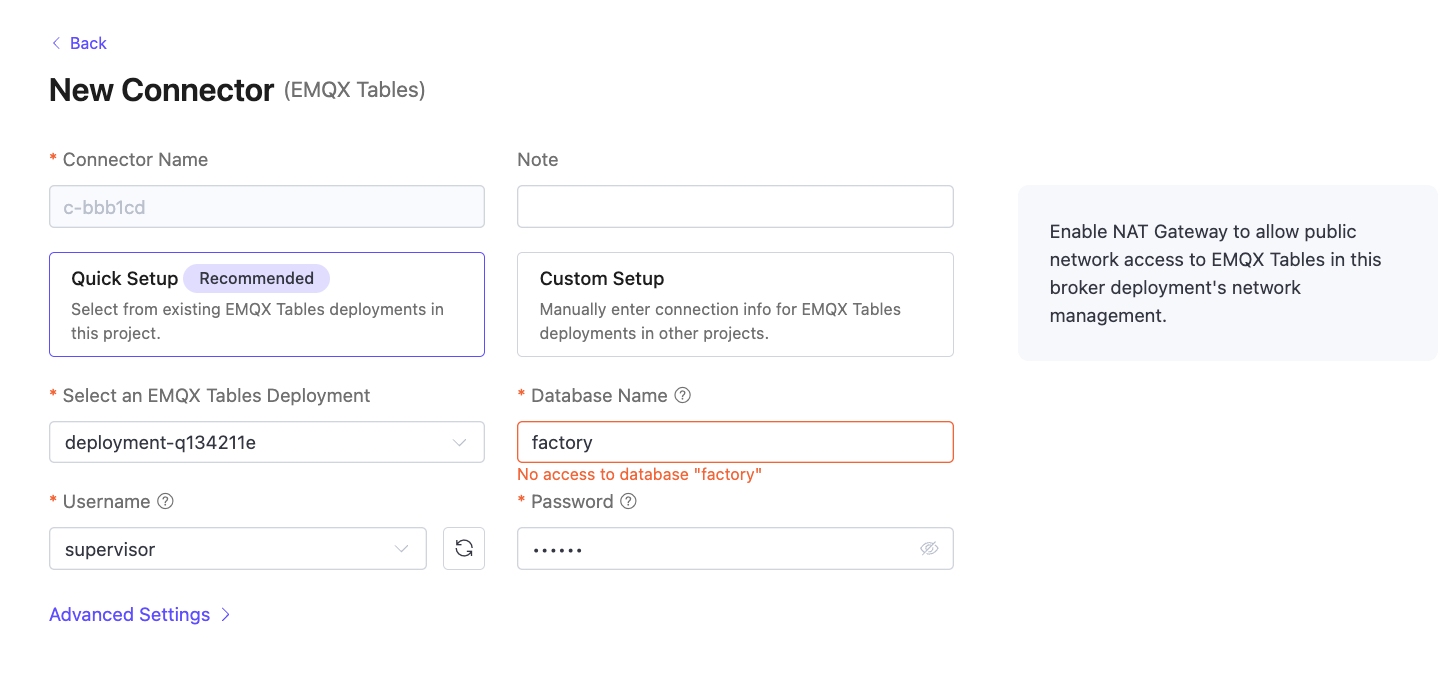
For newer EMQX Tables deployments, create an EMQX Tables user before configuring the connector, because newer deployments do not return a default username or password in the deployment details. Select the Broker Integration preset when creating the user. This grants the required permissions for the connector setup. If permission validation fails during connector setup, update the EMQX Tables user permissions according to the error message. For details, see User Management.
Go to your EMQX Broker deployment. Click Data Integration from the left menu.
If it is the first time for you to create a connector, find EMQX Tables. If you have already created connectors, click + New Connector and then select EMQX Tables.
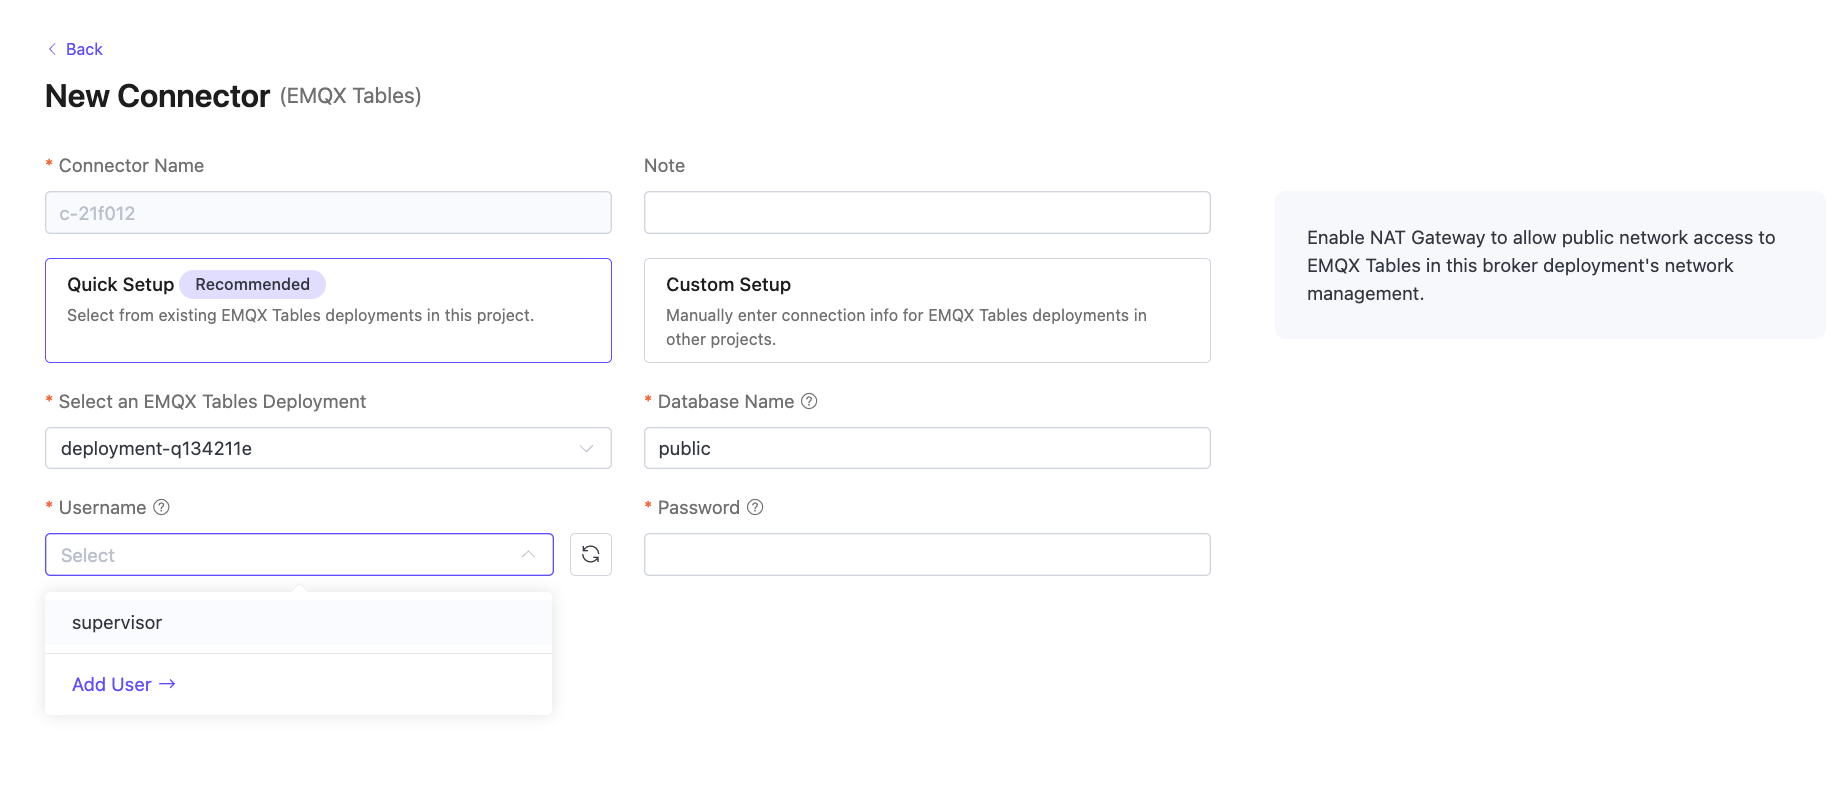
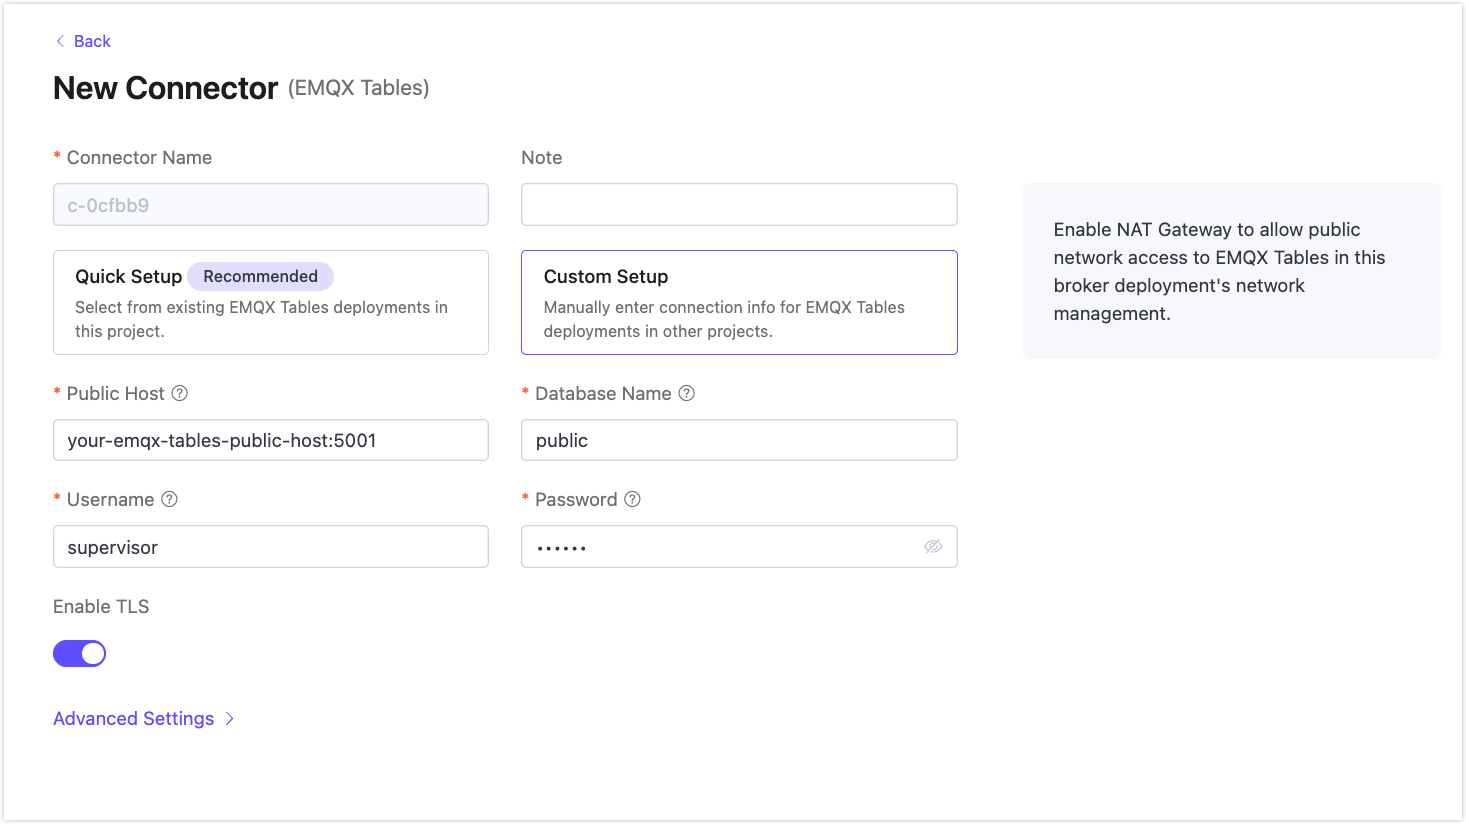
On the New Connector page, the Connector Name is automatically generated. Choose from two setup modes:
Click Test to verify connectivity. If the EMQX Tables service is accessible, the username and password are valid, and the selected user has the required privileges and database access, a success prompt is returned.
Click New to complete the creation. You can now proceed to create a rule using this connector.
Create a Rule for Data Ingestion into EMQX Tables
Next, you need to create a rule to specify the data to be written and add corresponding actions in the rule to write them to EMQX Tables.
In the Rules section, click New Rule, or use the Actions icon next to your connector.
Define the SQL rule in the SQL Editor. In this demonstration, the goal is to trigger the engine when the client sends a temperature and humidity message to the
temp_hum/emqxtopic. Here you can set the SQL as follows:sqlSELECT timestamp, payload.location as location, payload.temp as temp, payload.hum as hum FROM "temp_hum/emqx"TIP
If you are a beginner user, click Try It Out to learn and test the SQL rule.
Click Next to append an action to the rule.
On the New Action (Sink) page, the connector you just created is selected by default in the Connector field.
Set Time Precision to
millisecond(default).Configure Data Format to define how data is parsed and written into EMQX Tables. You can use the default Form format, or select Line Protocol when you want to enter the complete write syntax manually.
Form: Use this default format when you prefer structured configuration fields. EMQX converts the configured measurement, timestamp, tags, and fields into the line protocol format before writing the data to EMQX Tables.
Configure the fields as follows:
Field Description Example Measurement Measurement name to write to. Placeholders are supported. temp_humTimestamp Optional timestamp for the data point. If left empty or set to ${timestamp}, EMQX uses the system time of the host machine in UTC. To use a custom timestamp from the message, make sure its precision matches the selected Time Precision.${timestamp}Tags Optional key-value pairs for indexed columns. Tag columns are indexed by default for fast filtering and are declared as PRIMARY KEYcolumns in SQL.Key: location
Value:${location}Fields Required key-value pairs for the data fields to write. Both keys and values support placeholders. Numeric values are written as floats by default. To specify another type, add a type suffix, for example, ${payload.int_key}i. You can also click Import to import field mappings in batches.Key: temp
Value:${temp}
Key:hum
Value:${hum}Line Protocol: Select this format when you want full control over the final write syntax. In Write Syntax, specify a text-based format that provides the measurement, tag set, field set, timestamp of a data point, and supported placeholders. See also InfluxDB 2.3 Line Protocol and InfluxDB 1.8 Line Protocol.
For example:
temp_hum,location=${location} temp=${temp},hum=${hum} ${timestamp}TIP
- To write a signed integer type value, add
ias the type identifier after the placeholder, for example,${payload.int}i. See InfluxDB 1.8 write integer value. - To write an unsigned integer type value, add
uas the type identifier after the placeholder, for example,${payload.int}u. See InfluxDB 1.8 write integer value.
- To write a signed integer type value, add
Click Confirm to save the rule.
In the Successful new rule pop-up, click Back to Rules to complete the rule creation.
Test the Rule and Query the Data
You are recommended to use MQTTX or other client tools to simulate temperature and humidity data reporting. For quick demonstration, you can just use built-in diagnostic tool inside your broker deployment by clicking the Online Test from the left menu.
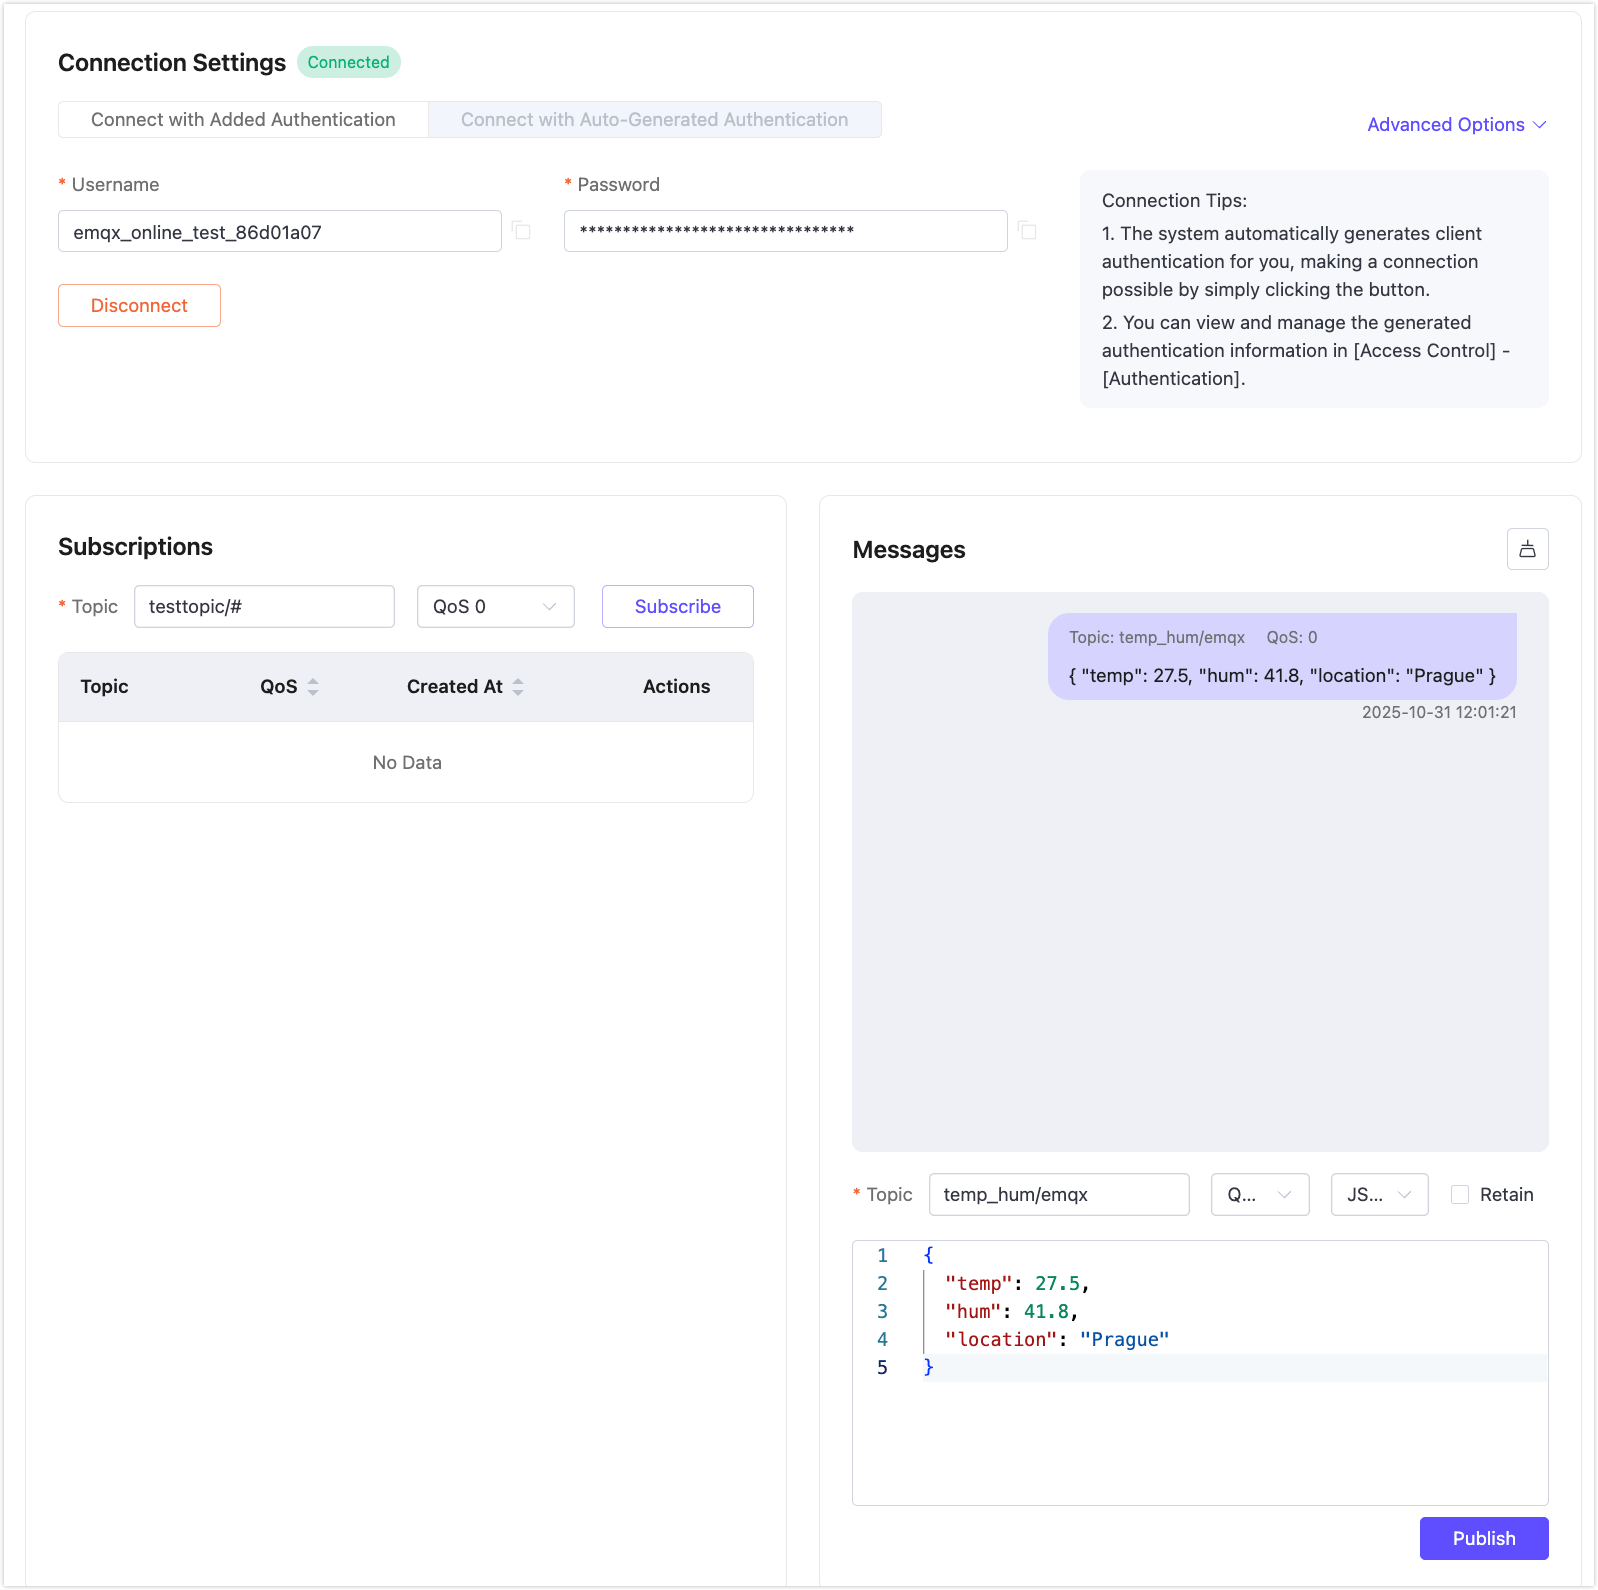
In Online Test, connect to the deployment using username and password or auto-generated authentication.
In the Messages section, send a message:
Topic:
temp_hum/emqxPayload:
json{ "temp": 27.5, "hum": 41.8, "location": "Prague" }
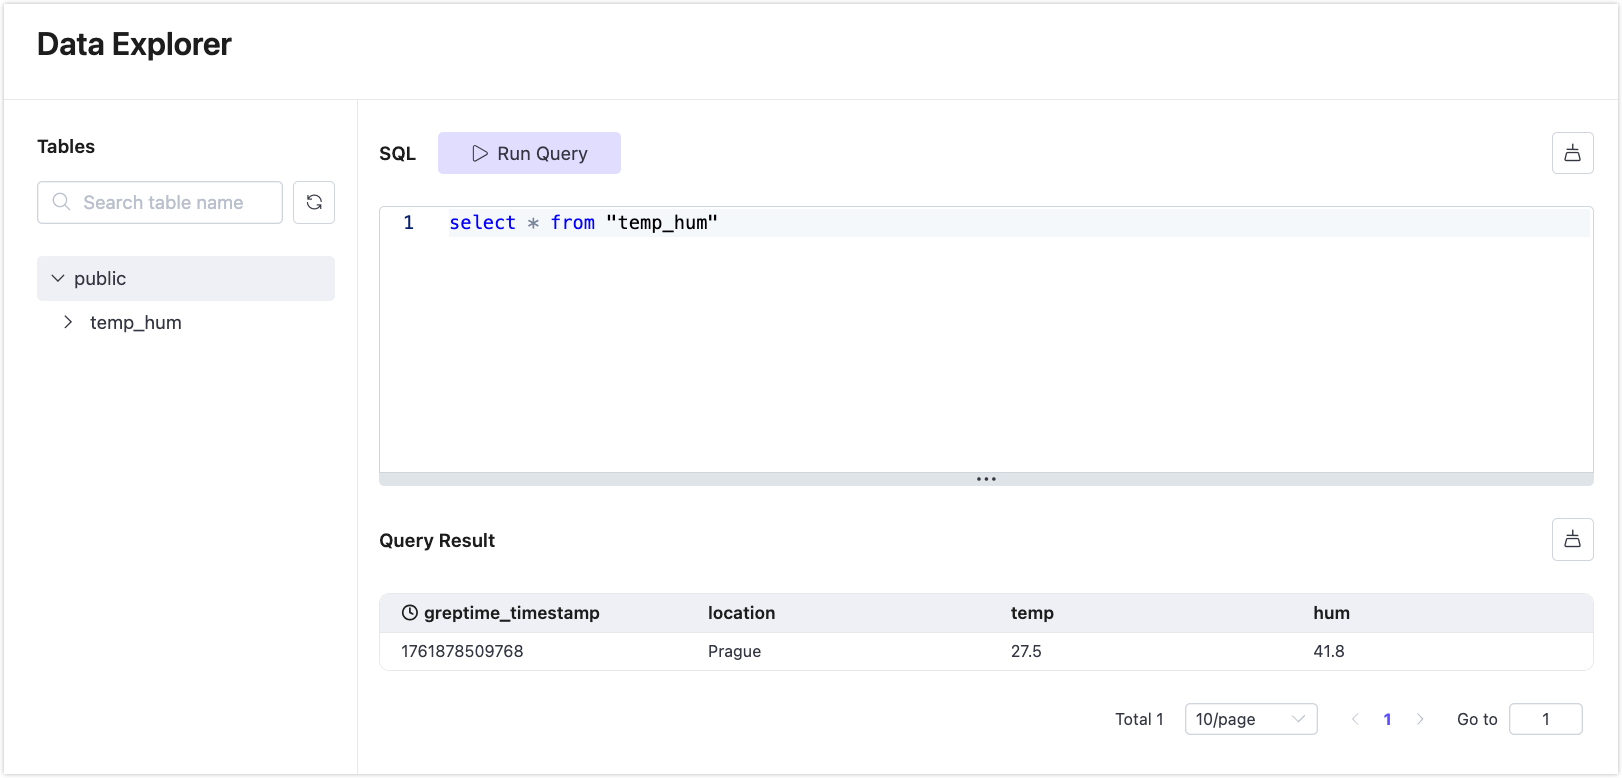
Go to your EMQX Tables deployment. Click Data Explorer from the left menu.
Run the following SQL to query the data ingested into the table
public:sqlselect * from "temp_hum"You should see there is one record in the Query Result table.
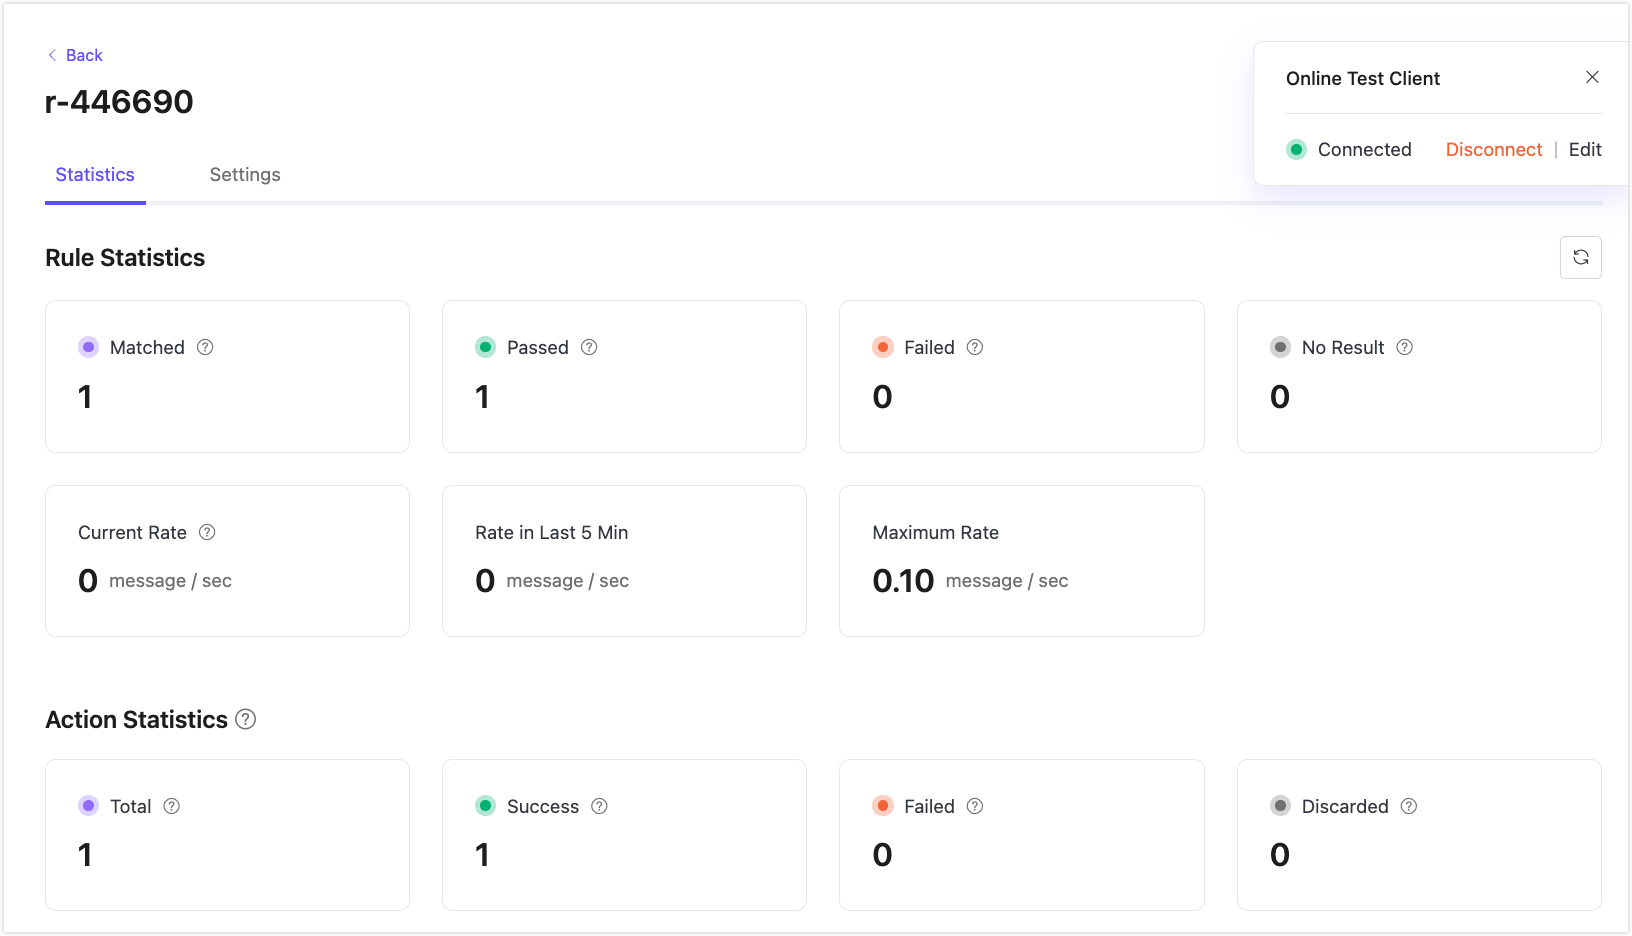
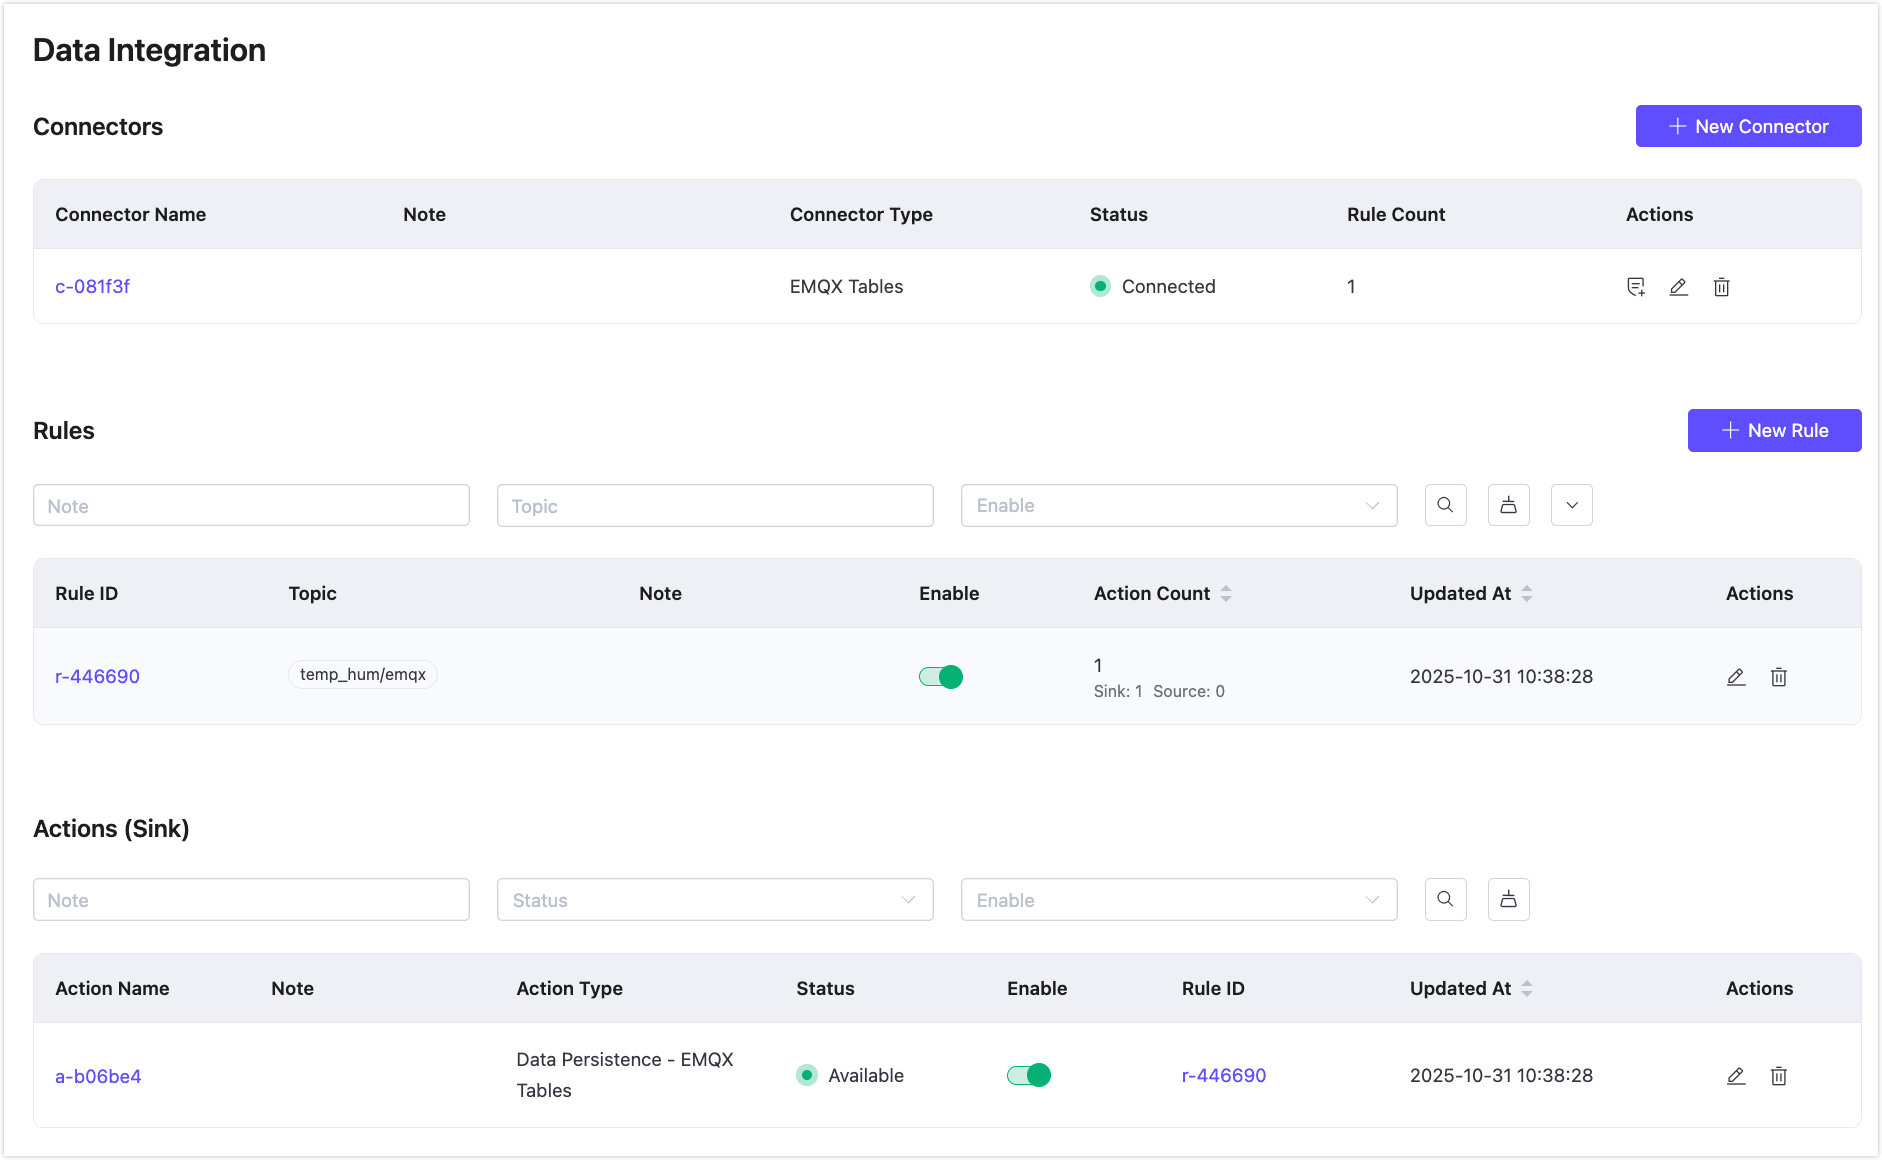
View the rule statistics in your EMQX Broker deployment. Click the rule ID in the rule list, and you can see the statistics of the rule and action associated with this rule.