Quick Start: Ingest MQTT Data into EMQX Tables
This guide walks you through creating a complete MQTT-to-database pipeline using EMQX Broker and EMQX Tables, without relying on external databases. EMQX Tables is a fully managed, native time-series database built into the EMQX Cloud Platform, designed for real-time IoT data processing.
You will learn how to:
- Create EMQX Broker and EMQX Tables deployments
- Create a custom EMQX Tables user
- Ingest MQTT data into EMQX Tables using the data integration
- Query time-series data with SQL using built-in Data Explorer
- Optionally create custom databases and tables
Note
The screenshots in this document are provided for reference only.
As EMQX Cloud continues to evolve, the Console UI may be updated or improved over time, and some screenshots may not exactly reflect the latest interface. The overall workflows and functionality, however, remain consistent.
EMQX Tables Free Trial
EMQX Tables offers a free trial for evaluating native MQTT-to-database ingestion and time-series analytics at no cost.
Quotas and Duration
The EMQX Tables Free Trial includes:
- 14-day free trial period
- 100 GB outbound traffic
- 100 GB storage capacity
Expiration
- Trial deployments that have had no active connections for 3 consecutive days will be stopped automatically.
- Trial deployments stop immediately when the trial ends.
- Instances are deleted 3 days after expiration.
- All data will be permanently removed after deletion.
To continue using EMQX Tables after the trial, upgrade the deployment to a paid plan before the trial expires.
Use Case: Smart Factory Monitoring
Let's look at a concrete example of how you can use EMQX Tables in a real-world scenario. In this example, factory devices regularly report time-series telemetry data, including:
machine_id: Device identifierproduction_line: Associated production linetemperature: Temperature readingvibration: Vibration intensitymachine_status: Operational state (e.g., running, warning, error)ts: Timestamp of the measurement
You want to ingest this data via MQTT and store it natively in EMQX Tables for monitoring, analytics, or alerting.
Note
Serverless deployments also support ingesting data into EMQX Tables. The steps in this guide use Dedicated Flex as the example. If you use a Serverless deployment, the data integration steps are the same, but note that Serverless connects to EMQX Tables over the public internet using TLS. Network Association and NAT Gateway are not applicable for Serverless.
Create EMQX Broker and EMQX Tables Deployments
Log in to the EMQX Cloud Console.
Create or select an existing project.
Under EMQX Brokers, click + New Deployment.
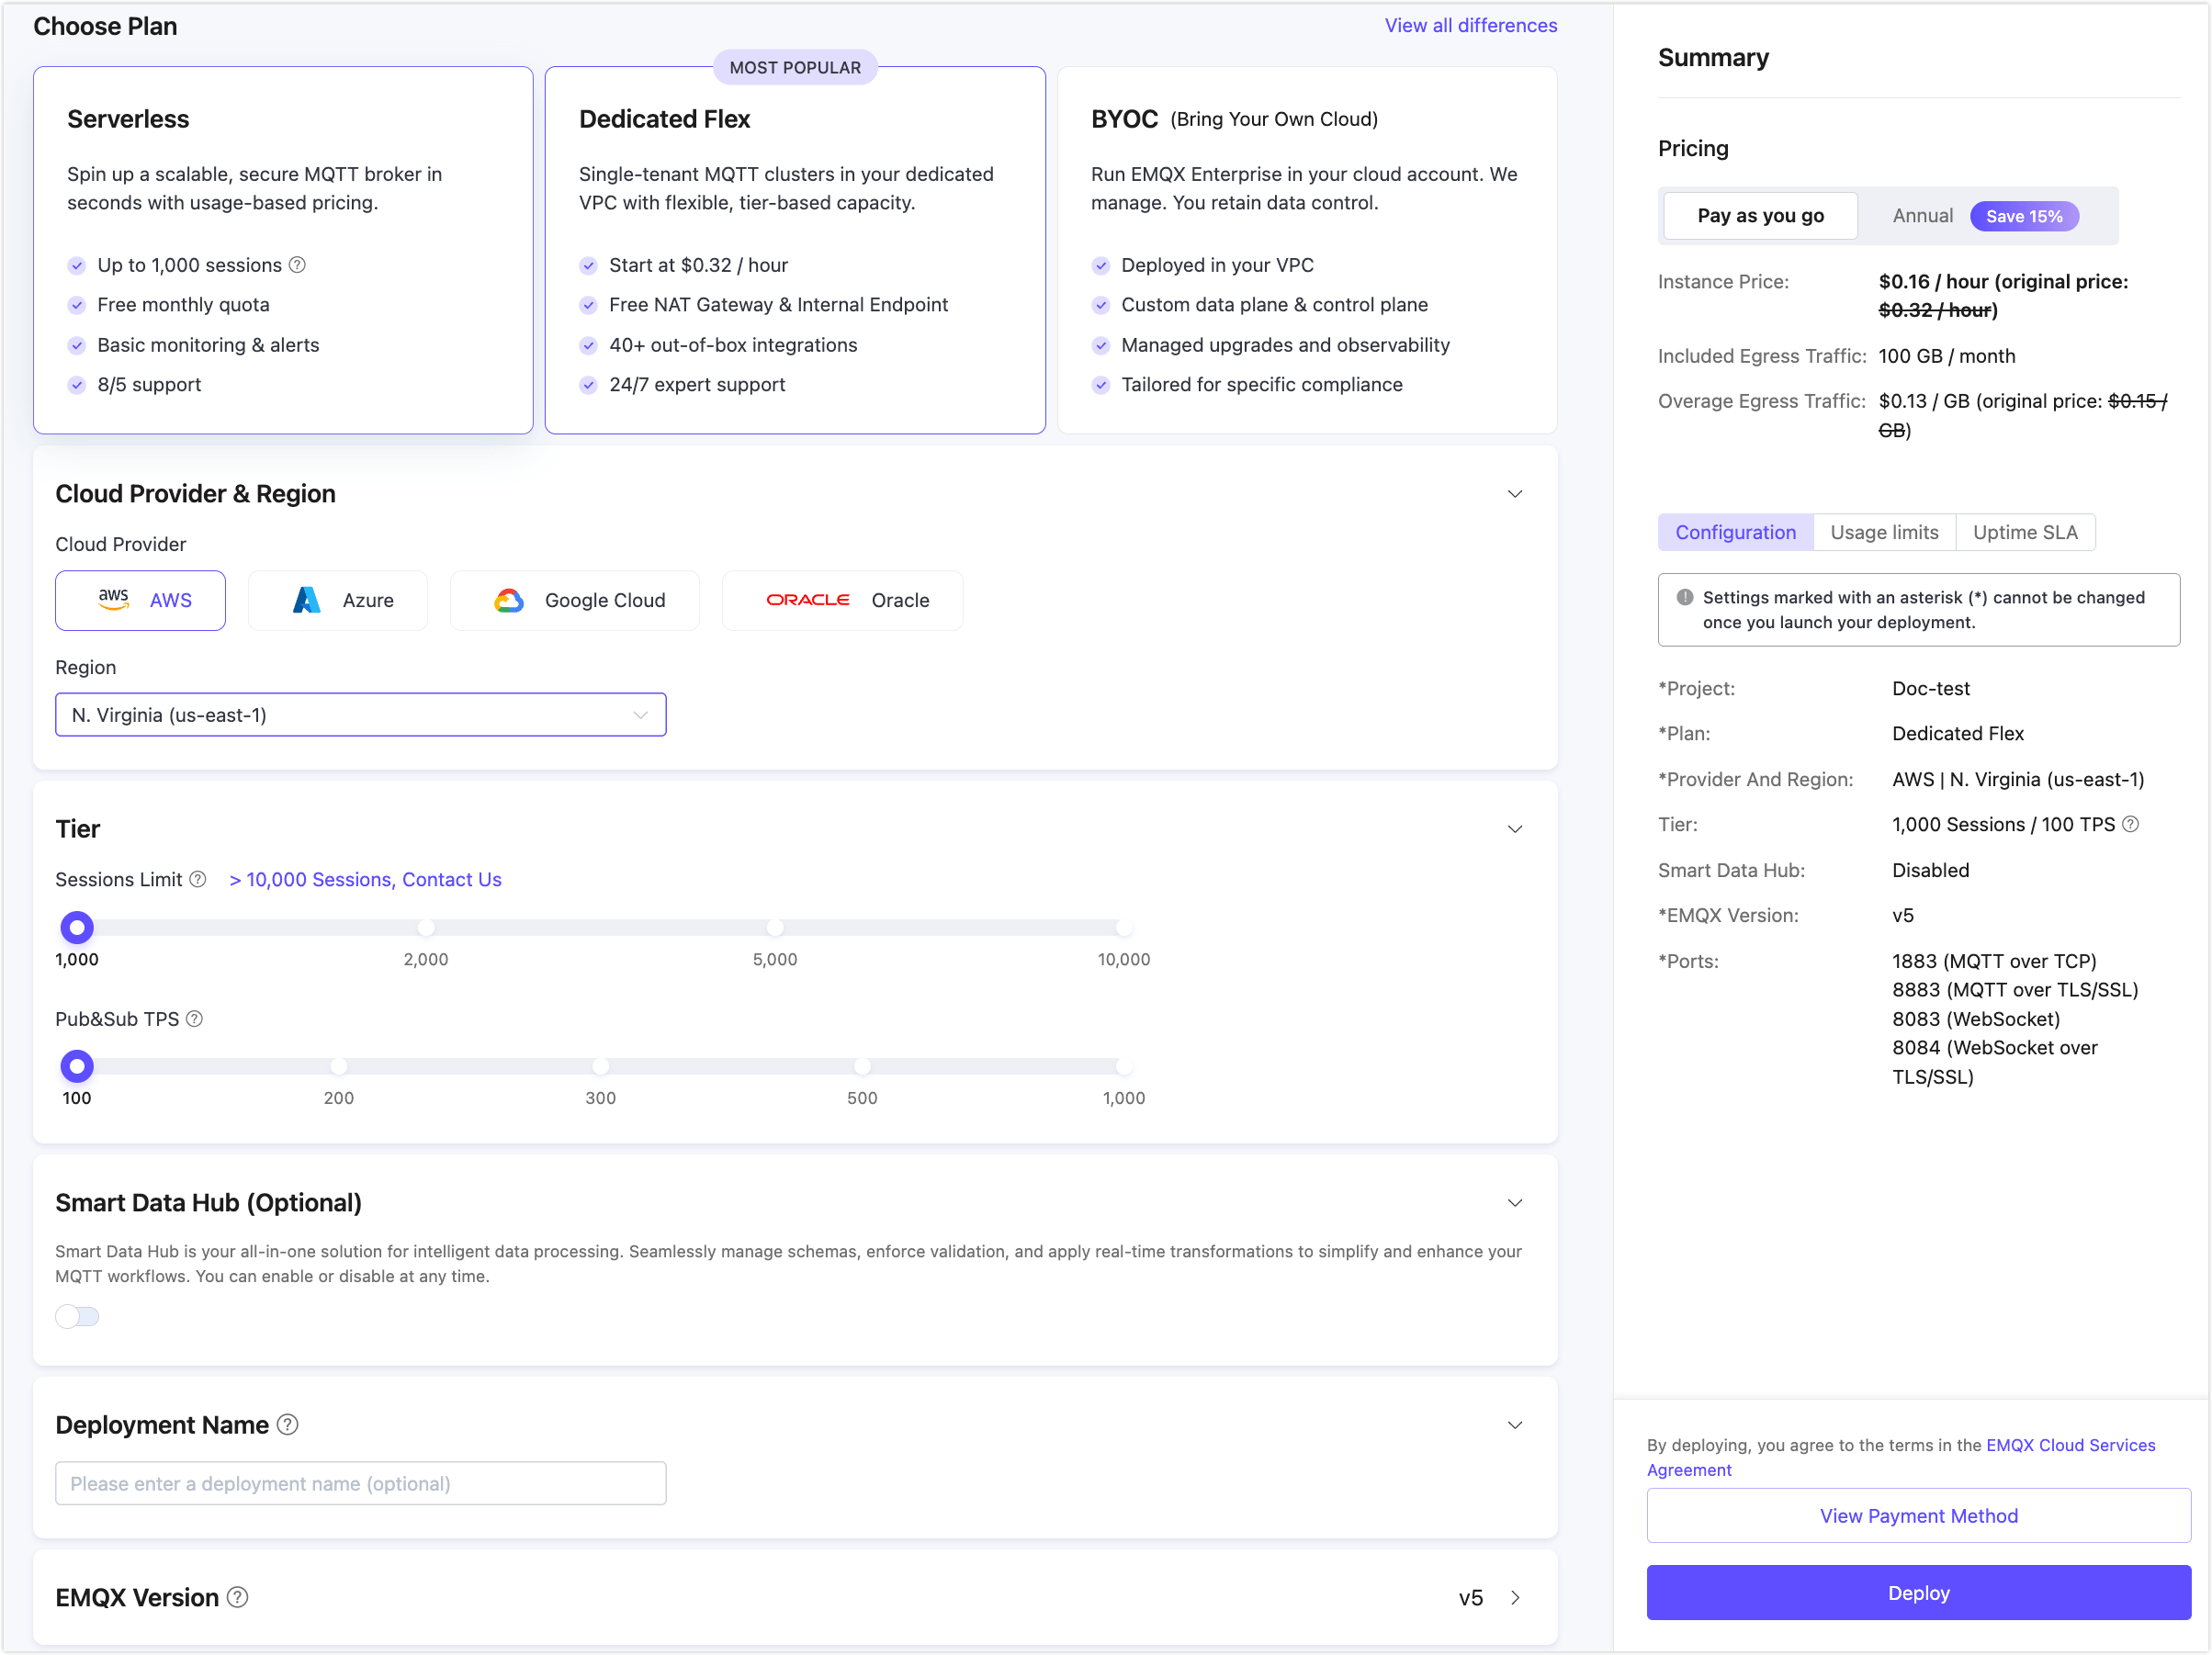
Select the Dedicated Flex plan, and configure the specifications.
- Select Cloud Provider & Region according to your needs.
- Keep the default value for the following options for quick demonstration.
- Tier
- Subscribe to Smart Data Hub (Optional)
- Deployment Name & Project
- EMQX Version
Click Deploy in the lower right corner.
See Create a Dedicated Flex Deployment for more detailed instructions.
Under EMQX Tables, click + New Deployment.
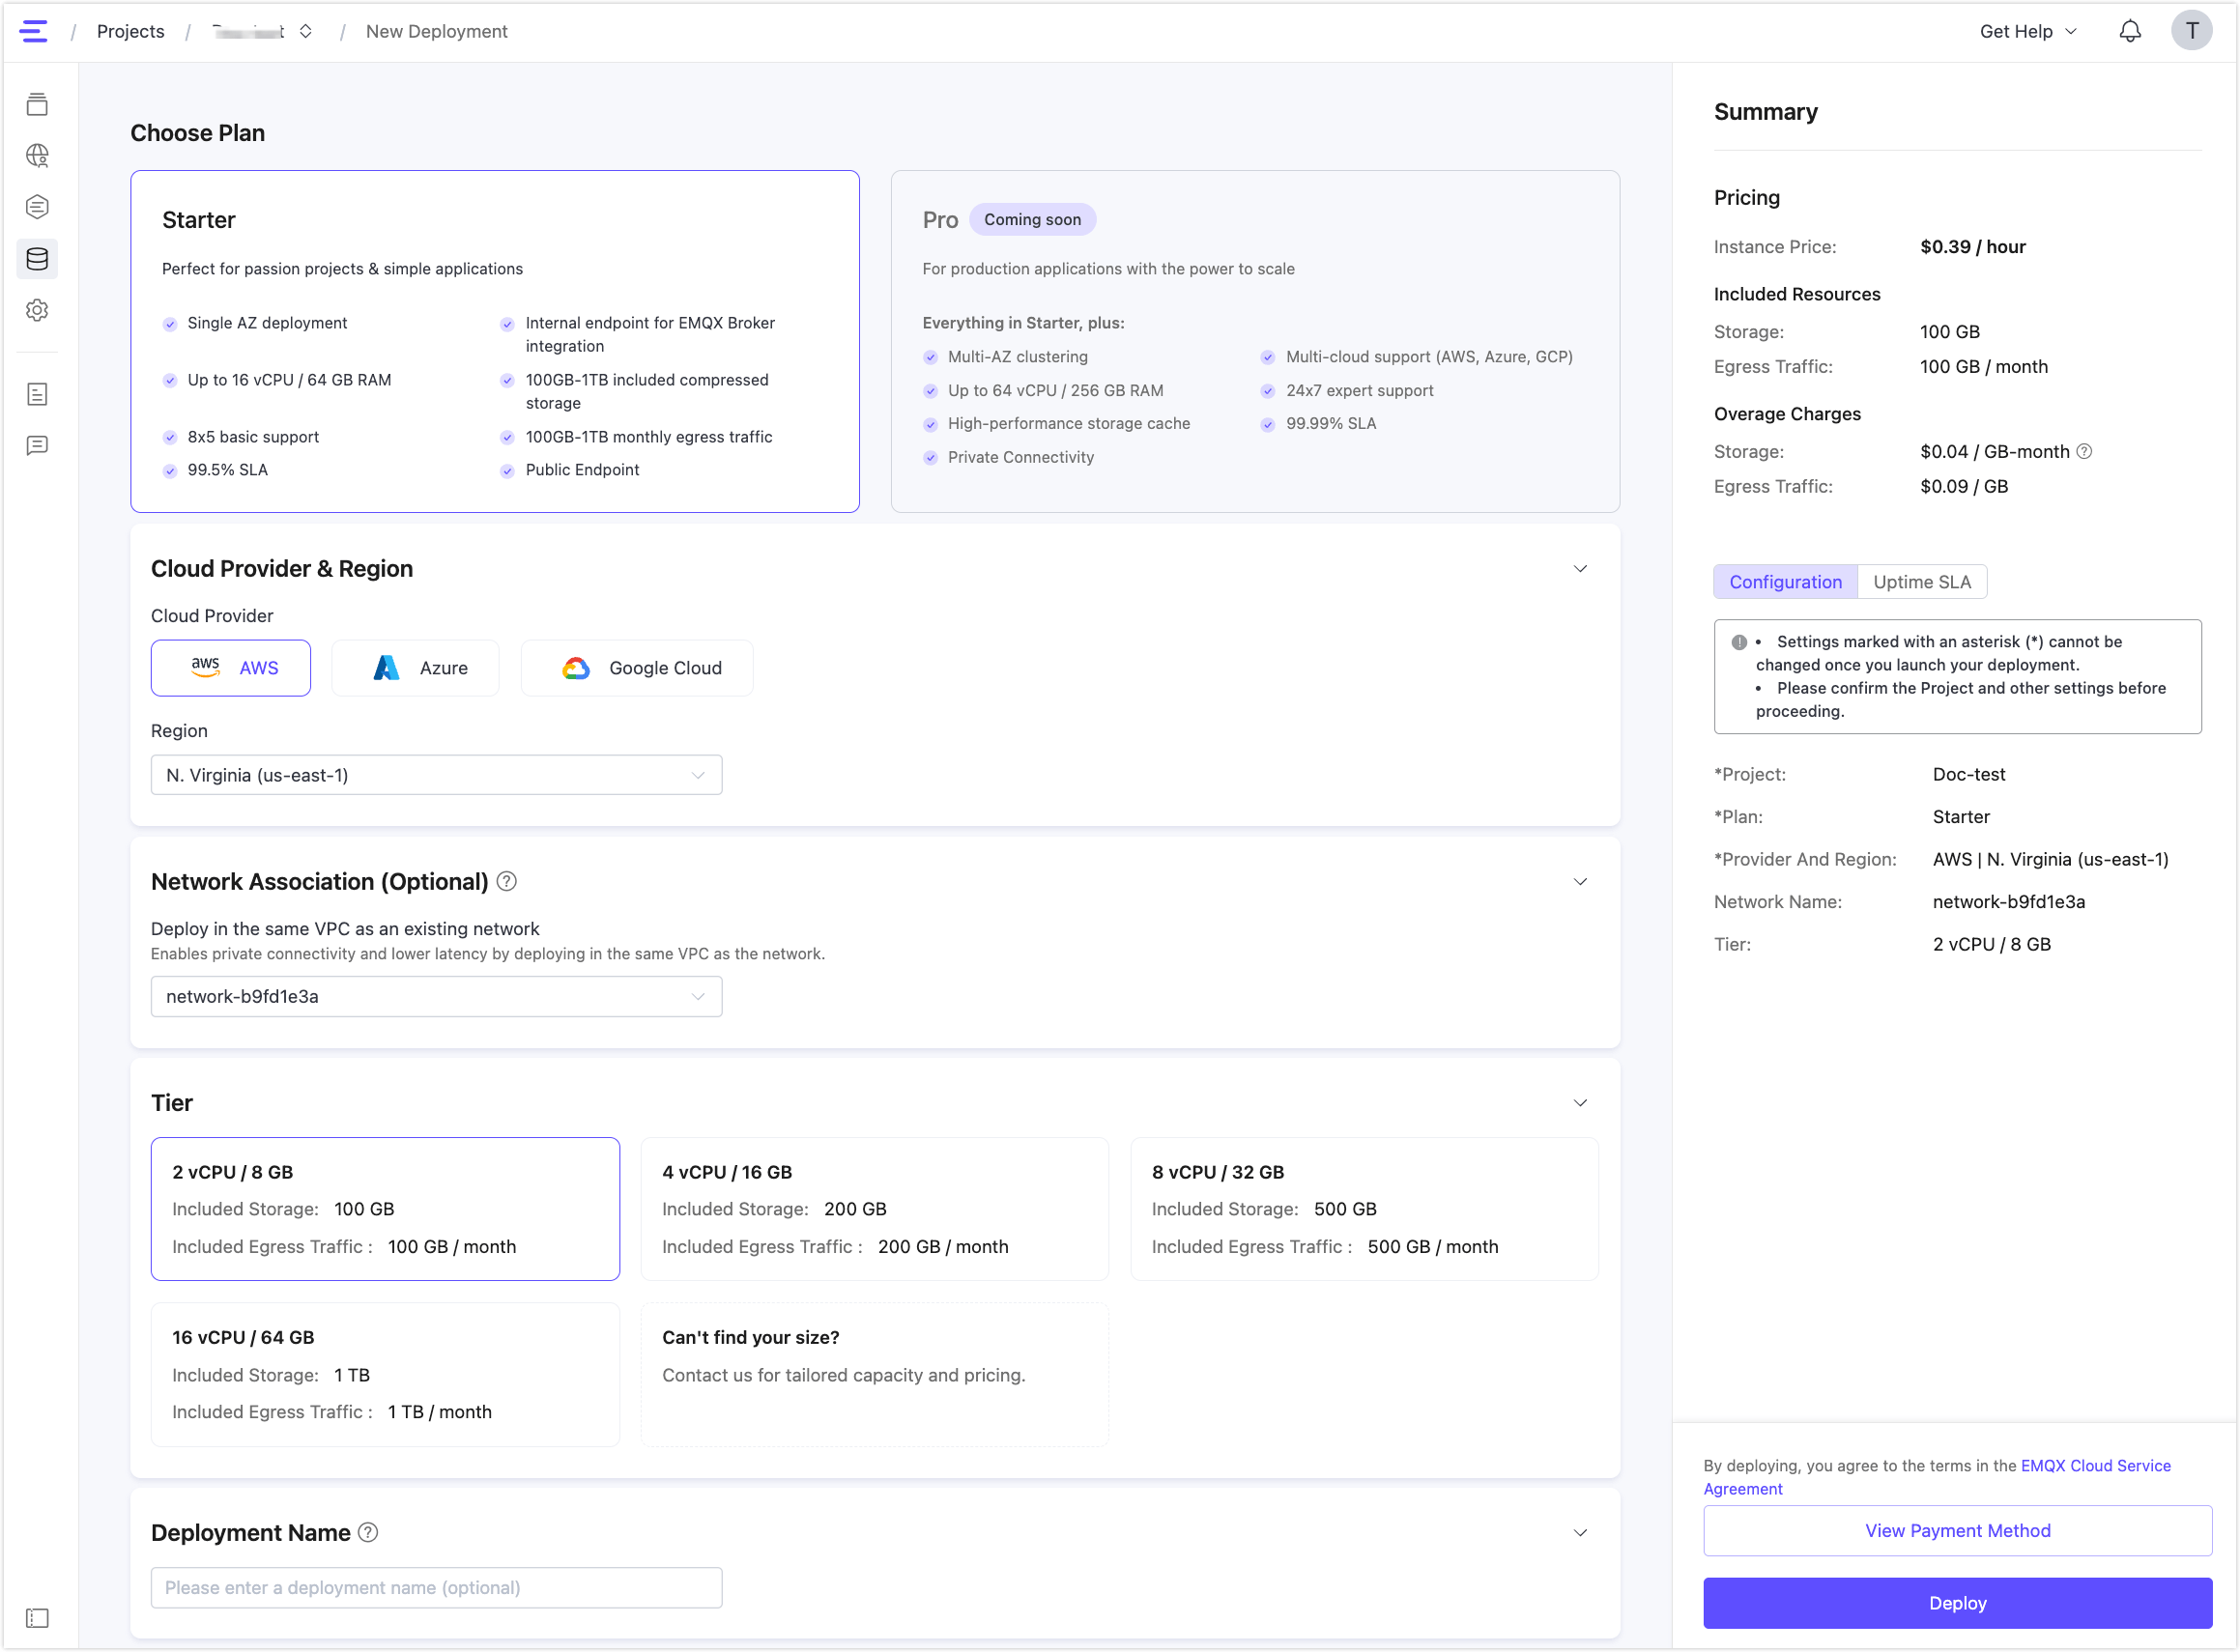
Choose the default Starter plan, and select the same cloud provider and region as your Broker deployment.
(Optional) Under Network Association, select the existing network from the dropdown. Since both deployments are on the same cloud platform and in the same region, the Broker's network should appear in the list. Selecting it ensures both deployments share the same network and can communicate over a private connection.
Choose a Tier.
(Optional) Enter a Deployment Name.
Click Deploy. See Create an EMQX Tables Deployment for more details.
Once the deployments are created, you can enter the deployment by clicking the deployment card in your project.
Enter your EMQX Tables deployment, click Data Explorer from the left menu, and you can see that a default database named public is available.
Create a User for Data Ingestion
Newer EMQX Tables deployments support custom users and permissions. They do not return a default username or password in the deployment details. Before creating the Broker data integration, create a user that can write data into the target database.
Note
Older EMQX Tables deployments do not support custom users or permission configuration. For older deployments, use the default credentials shown in the deployment details if they are available.
In your EMQX Tables deployment, click User Management from the left menu.
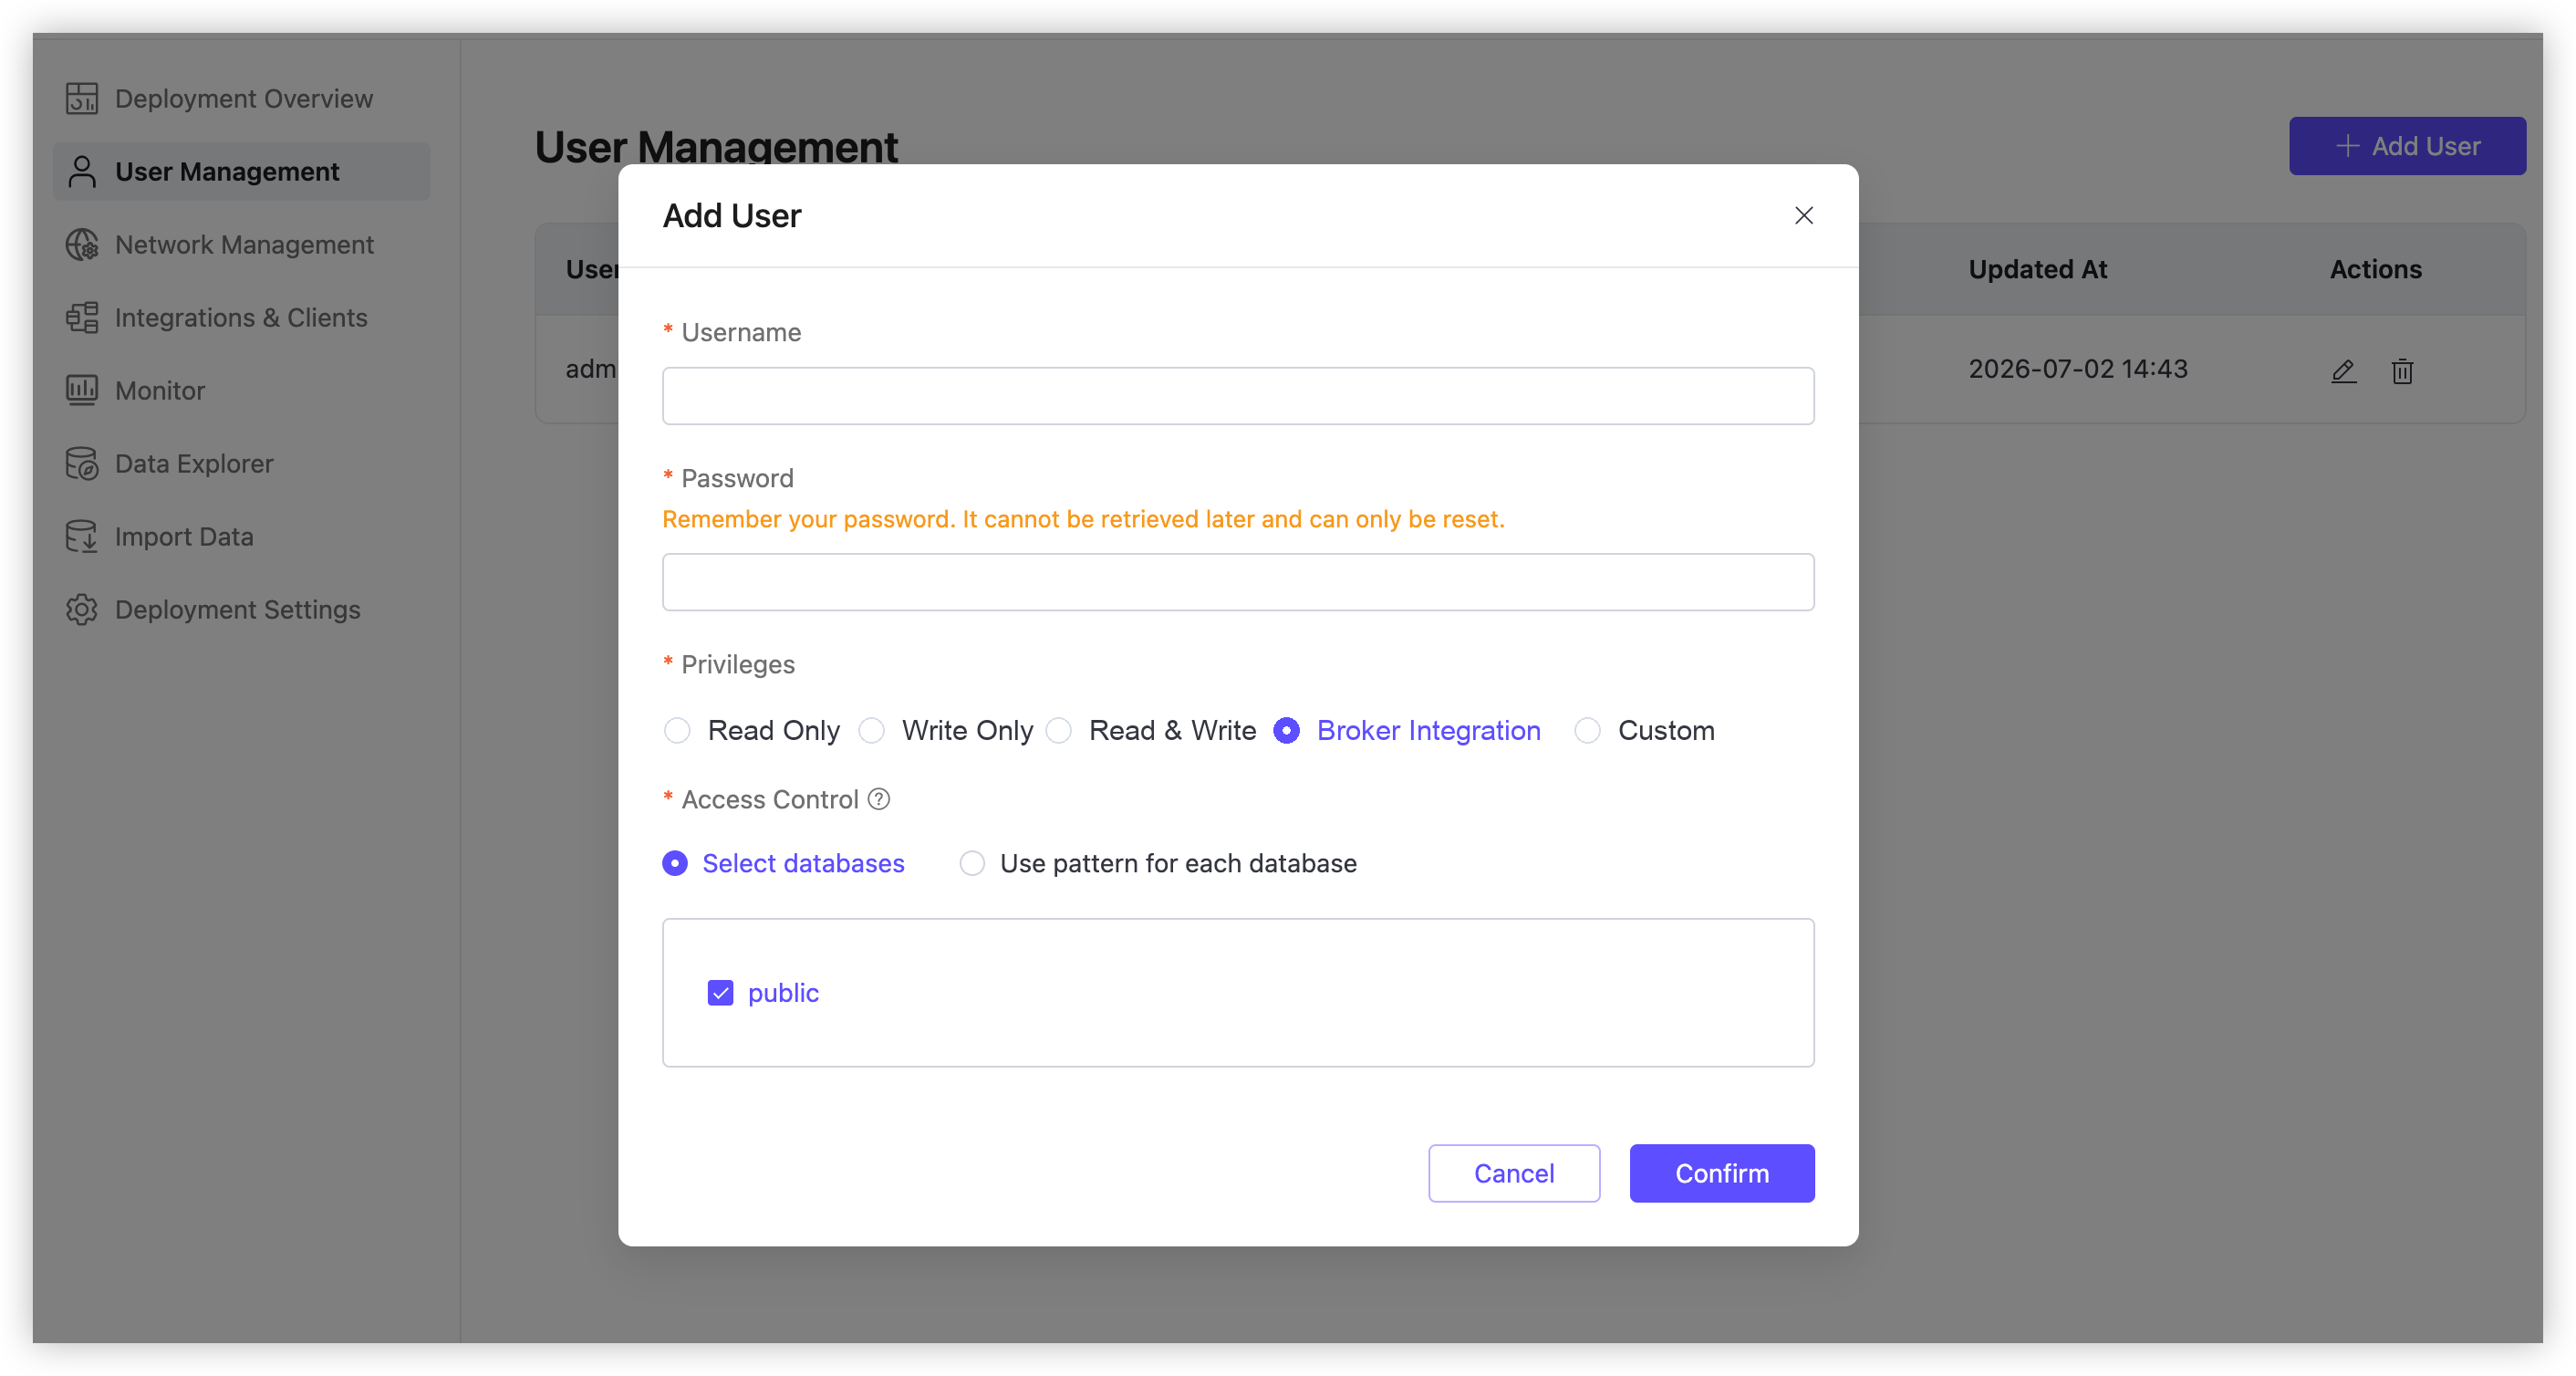
Click + Add User.
Enter a username and password. Remember the password, because it cannot be retrieved later and can only be reset.
In Privileges, select Broker Integration.
This preset grants the permissions required for data ingestion from EMQX Broker.
In Access Control, select the databases this user can access. For this quick start, select the
publicdatabase. If you created a custom database, select that database instead.Click Confirm.
You can manage the created users from the User Management page.
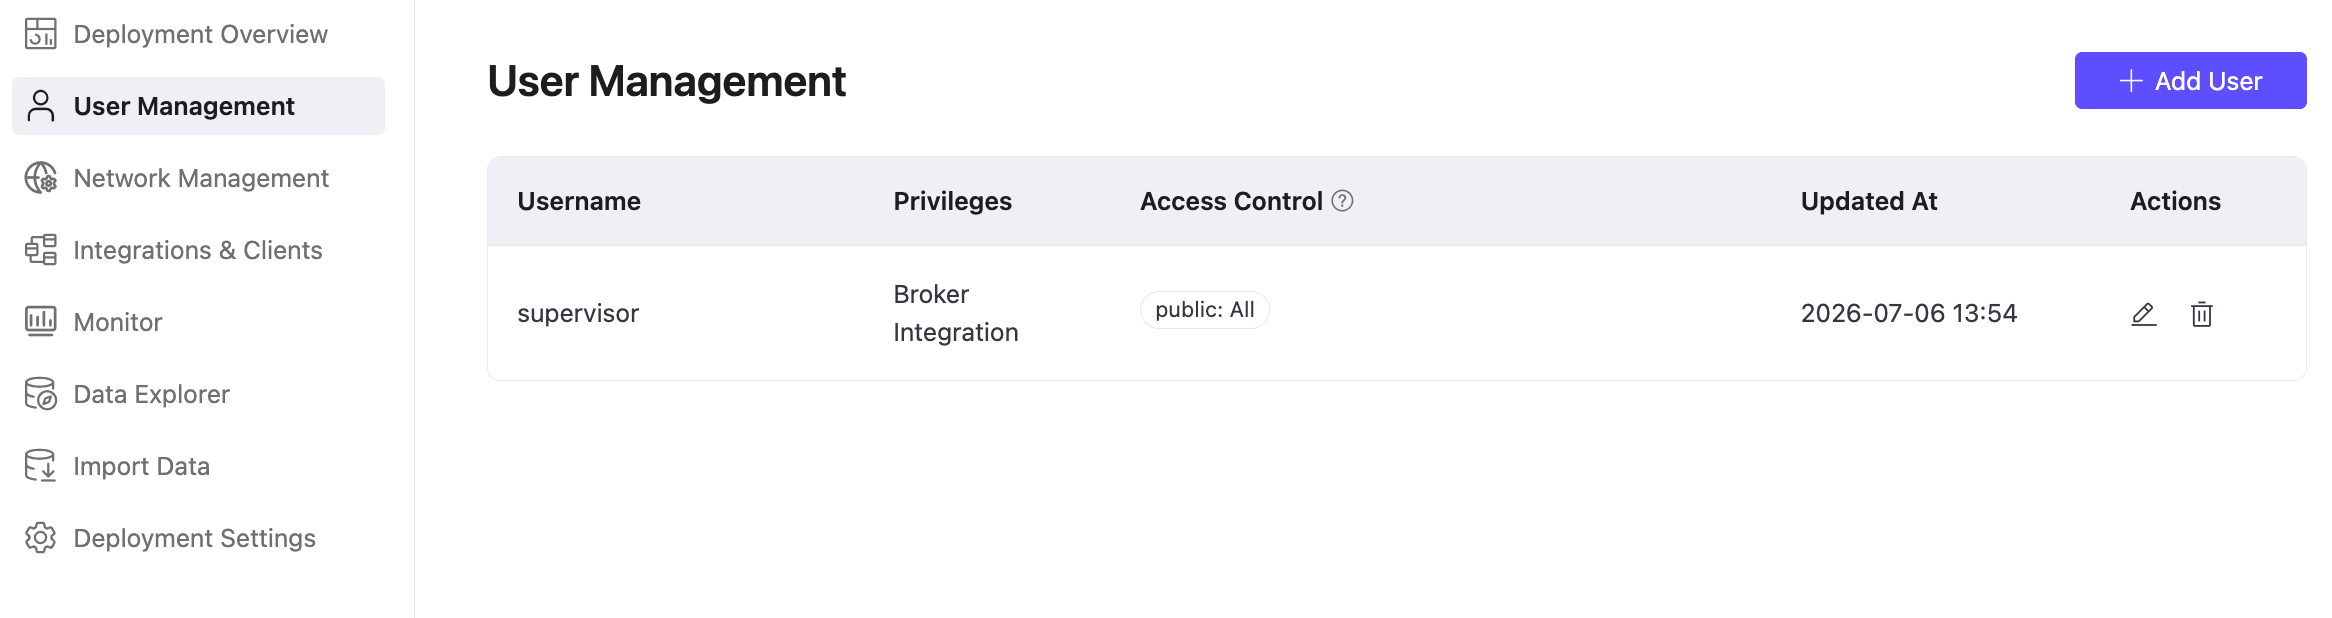
For details about privileges and access control modes, see User Management.
Connectivity Between Broker and Tables
The connection method depends on your Broker deployment type and network setup:
| Deployment Type | Condition | Connection | Action Required | Note |
|---|---|---|---|---|
| Dedicated / Dedicated Flex | Same cloud platform, region, and network as Tables | Private (secure, low-latency) | Under Network Association, select the existing network when creating the second deployment. You can verify the shared network from the project's Network Management page. | Each network supports at most one Broker and one Tables deployment. |
| Dedicated / Dedicated Flex | Different region or network as Tables | Public internet over TLS | Enable NAT Gateway under the Broker deployment's Network Management settings. | — |
| Serverless | — | Public internet over TLS | No action required. | Network Association and NAT Gateway are not applicable. |
Create a Rule to Ingest Data
We'll use the rule engine to ingest and persist MQTT messages into EMQX Tables.
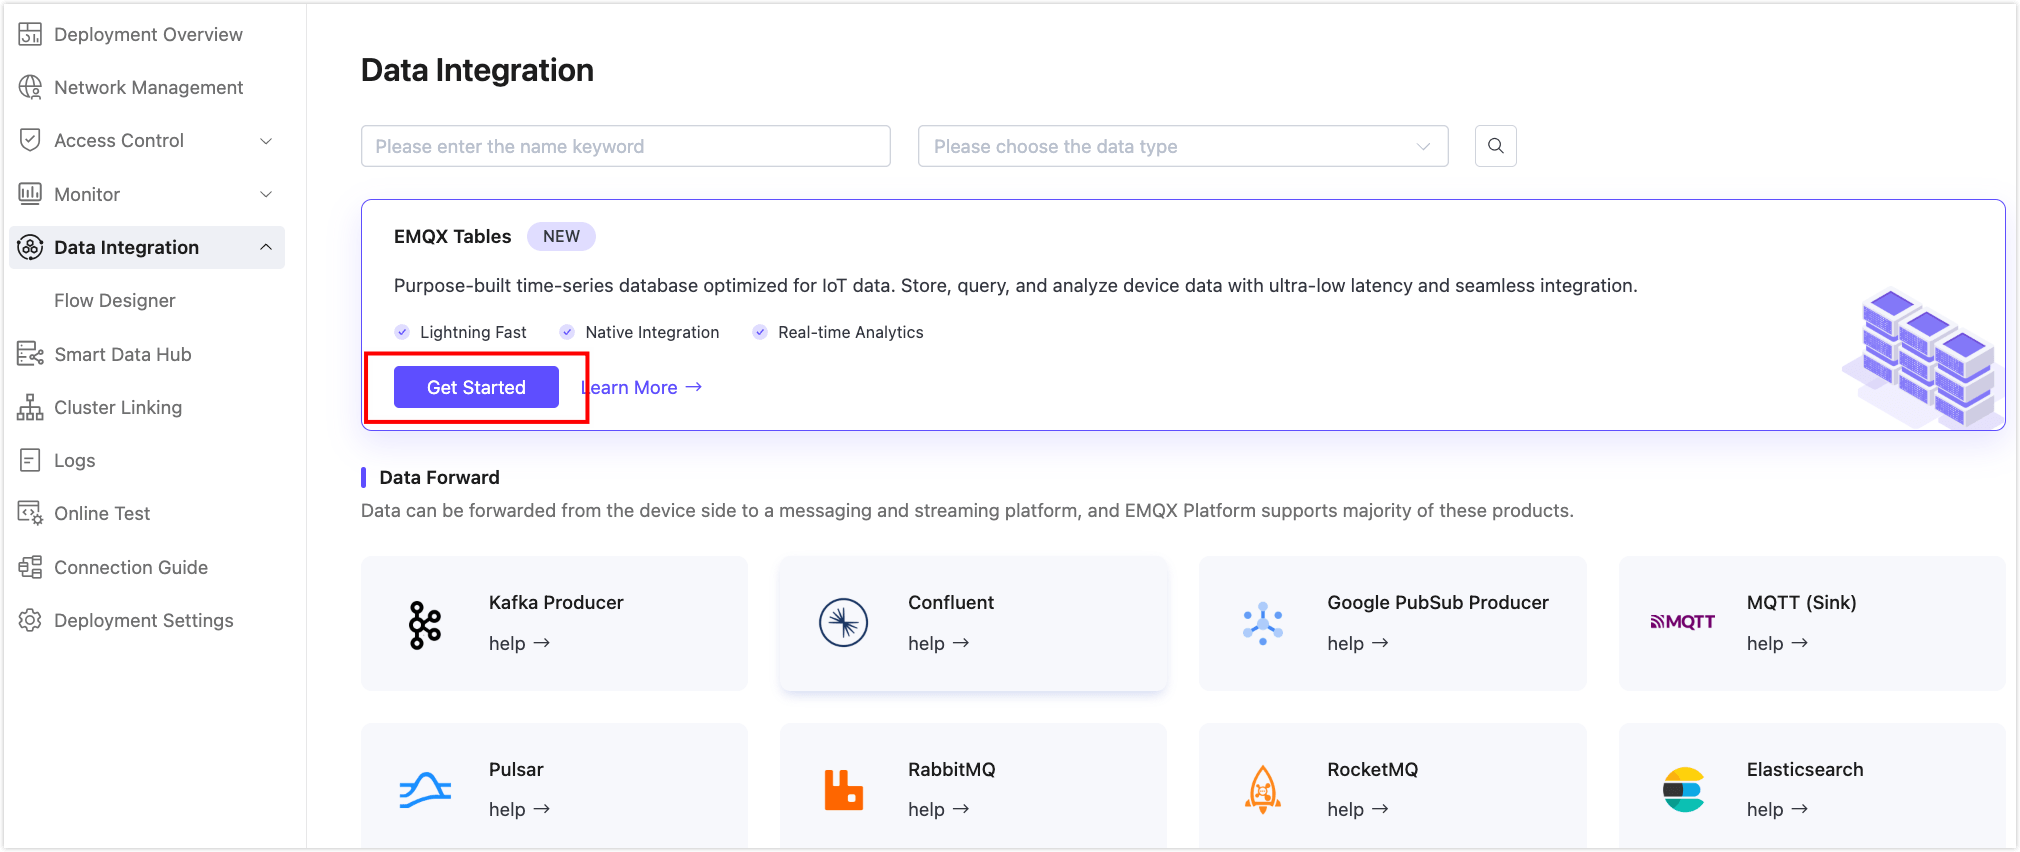
Go to your Dedicated Flex (or Serverless) deployment and navigate to Data Integration.
If this is your first connector, find and select EMQX Tables from the connector list. If you have already created connectors, click + New Connector and then select EMQX Tables.
Select Quick Setup (default) and then select the Tables deployment in your project.
Enter the connection settings:
- Database Name: Use
public. - Username: Select the user created in Create a User for Data Ingestion.
- Password: Enter the password for the selected user.
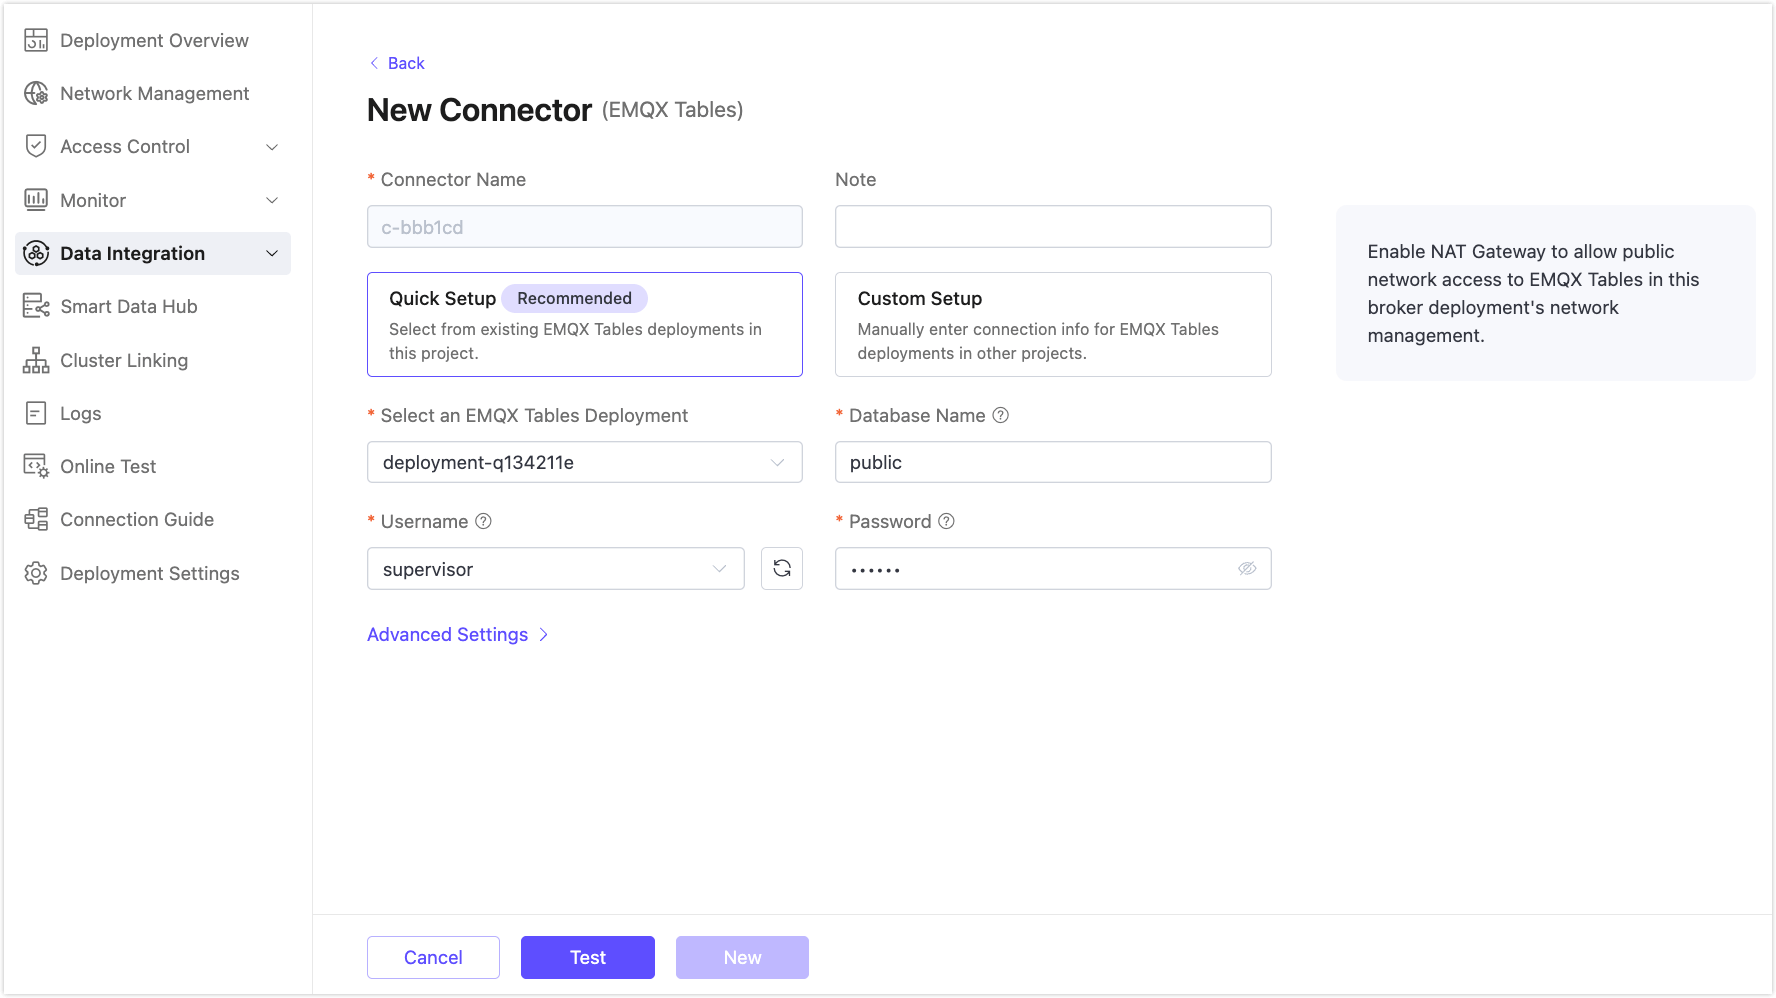
- Database Name: Use
Click Test to verify connectivity. A success prompt should be returned.
Click New and select New Rule to proceed to create a rule using this connector.
Define the SQL rule in the SQL Editor.
Rule SQL Example:
sqlSELECT timestamp as ts, payload.machine_id as machine_id, payload.production_line as production_line, payload.temperature as temperature, payload.vibration as vibration, payload.machine_status as machine_status FROM "factory/+/metrics"This rule extracts fields from the payload of all MQTT messages that match the topic
factory/+/metrics. Each extracted value is assigned an alias so it can be referenced in the Write Syntax setting in the rule action. Thetimestampfield is mapped tots, which becomes the time index for storing records in EMQX Tables.Click Next to append an action to the rule. Configure the Action settings:
Connector: Select your EMQX Tables connector.
Time Precision:
millisecondWrite Syntax:
textmachine_metrics,production_line=${production_line},machine_id=${machine_id} temperature=${temperature},vibration=${vibration},machine_status=${machine_status} ${ts}This syntax automatically creates the
machine_metricstable (if it does not exist) and uses the InfluxDB Line Protocol format to write data into the table.- Tags:
production_line,machine_id(used as dimensions and primary key fields) - Fields:
temperature,vibration,machine_status(actual metric values) - Timestamp:
${ts}ensures time-series alignment using the extractedtimestampfrom the message
- Tags:
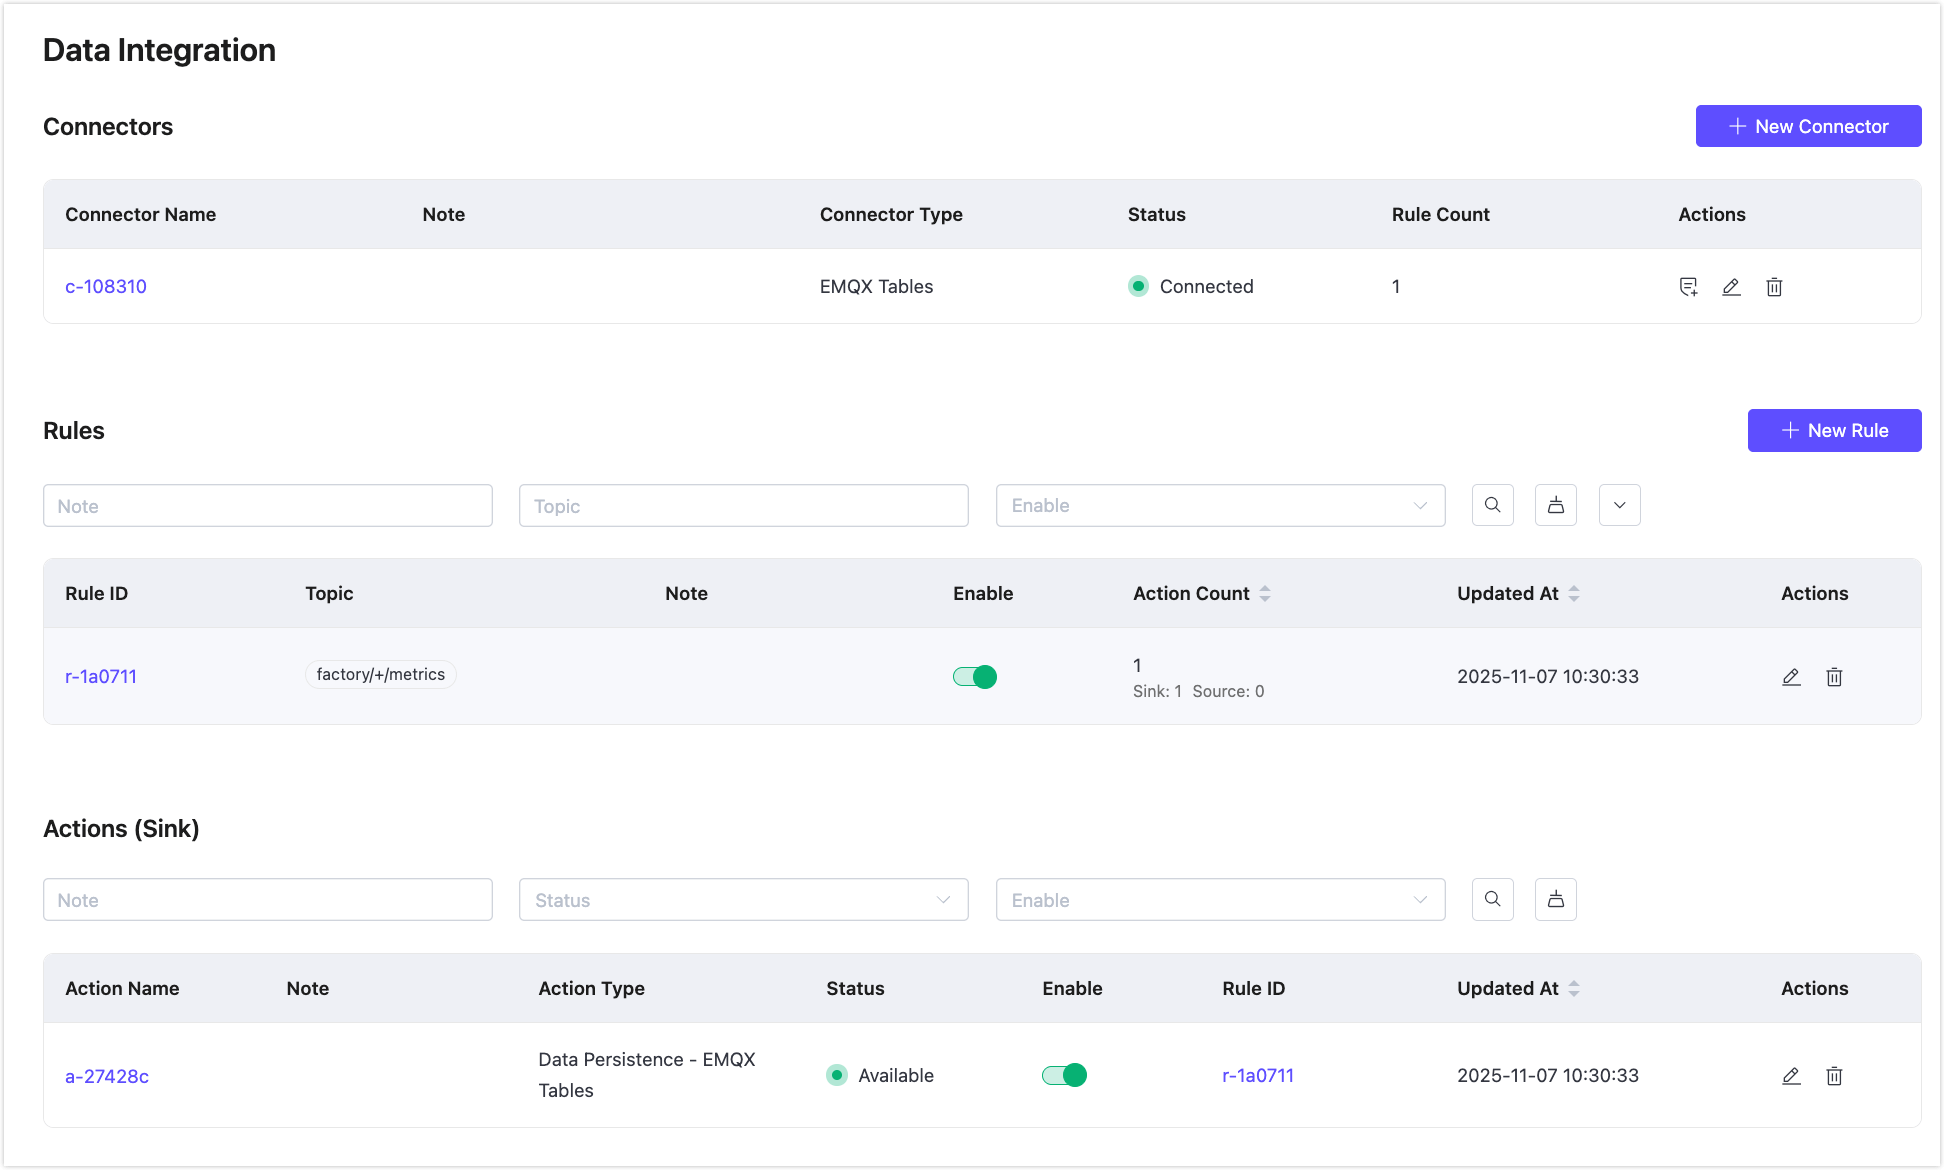
Click Confirm to save the rule.
Back on the Data Integration page, you can see the created connector, rule, and action.
Publish MQTT Messages
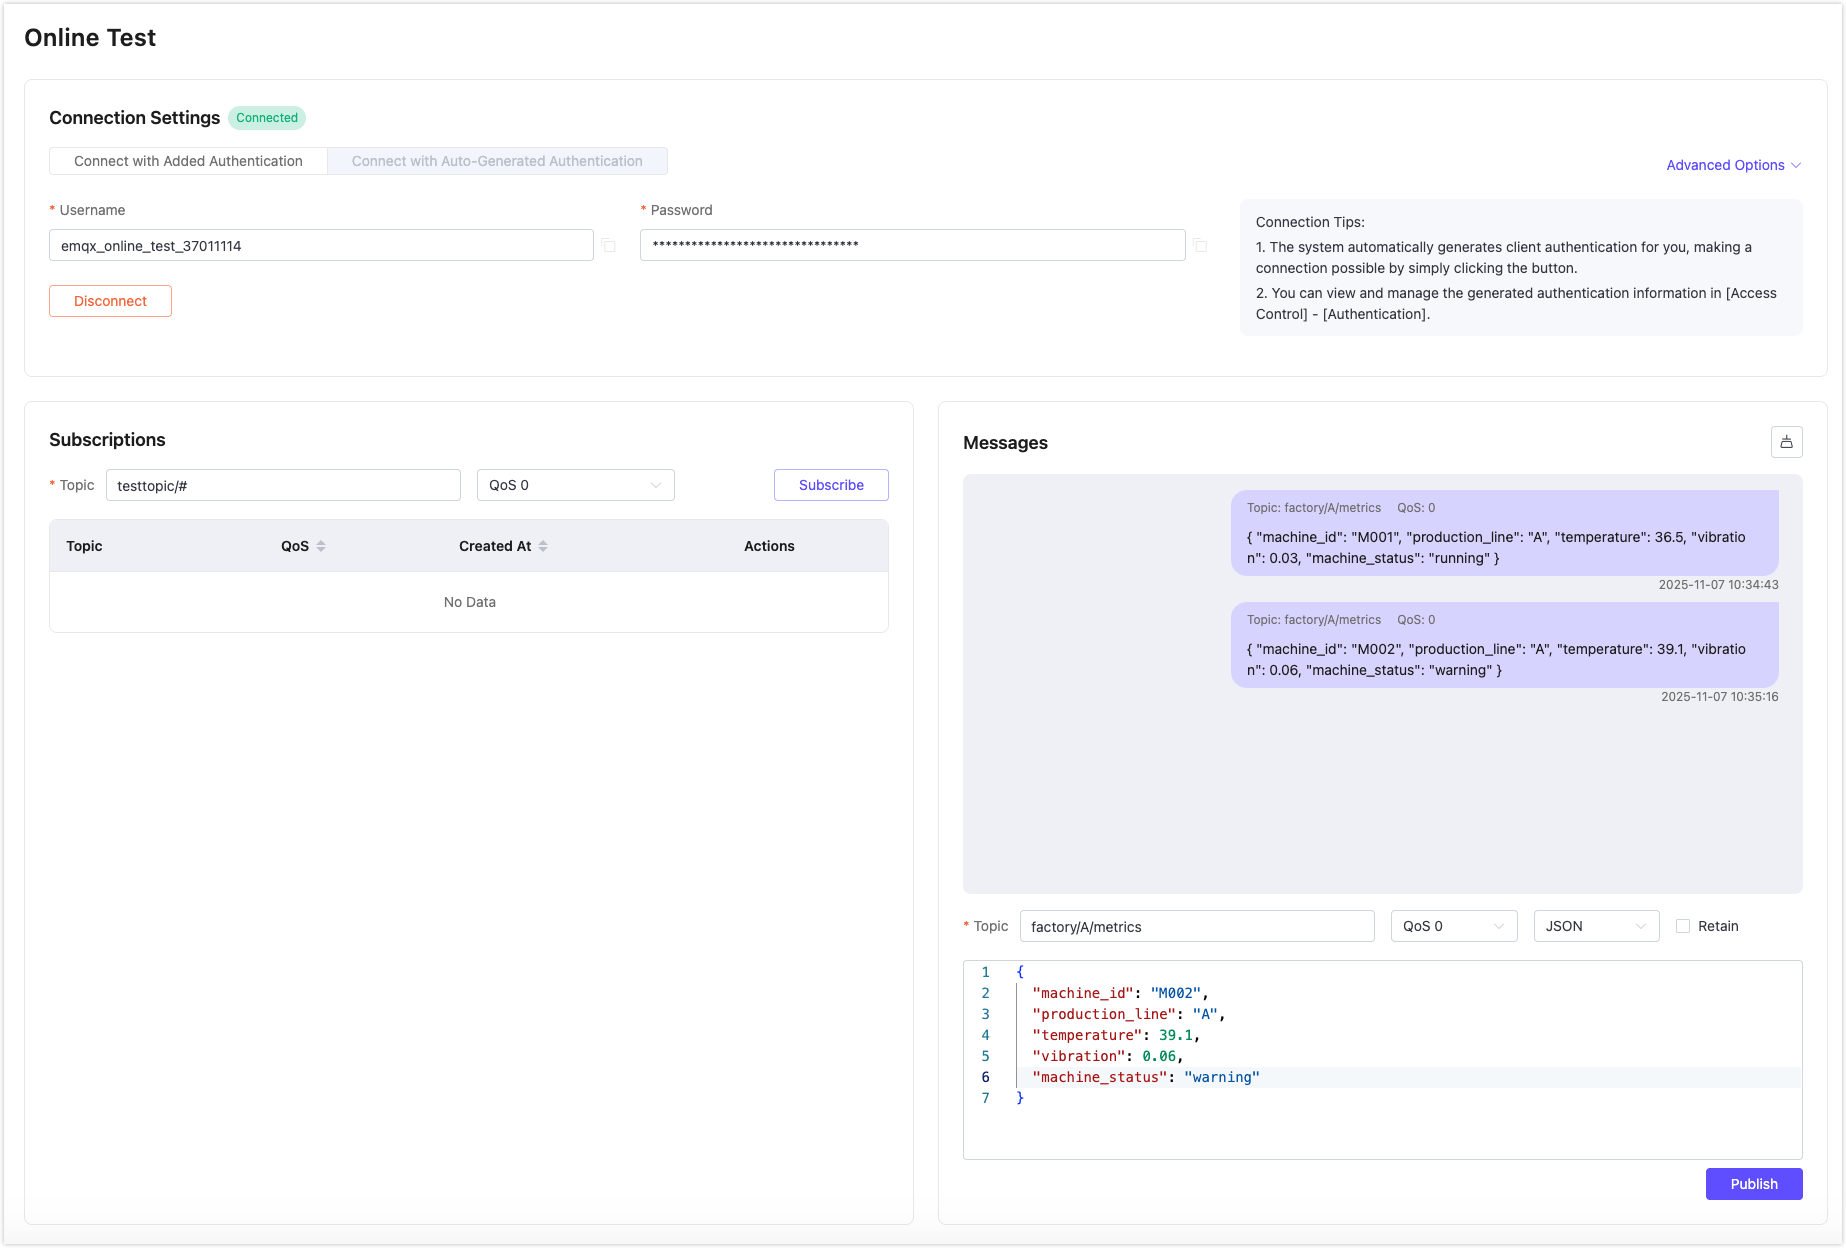
For quick testing, you can use the built-in diagnostic tool inside your Dedicated Flex (or Serverless) deployment by clicking the Online Test from the left menu.
In the Online Test, connect to the deployment using username and password or auto-generated authentication.
In the Messages section, send two messages:
TIP
If the table is not created in advance, EMQX Cloud will automatically create it based on the data types of the first successfully written message. Once a table and its columns are created, all subsequent writes must use the same data types; otherwise, the write will fail.
Topic:
factory/A/metricsPayload:
json{ "machine_id": "M001", "production_line": "A", "temperature": 36.5, "vibration": 0.03, "machine_status": "running" }json{ "machine_id": "M002", "production_line": "A", "temperature": 39.1, "vibration": 0.06, "machine_status": "warning" }
Query Data in EMQX Tables
Go to your EMQX Tables deployment.
Click Data Explorer in the left menu.
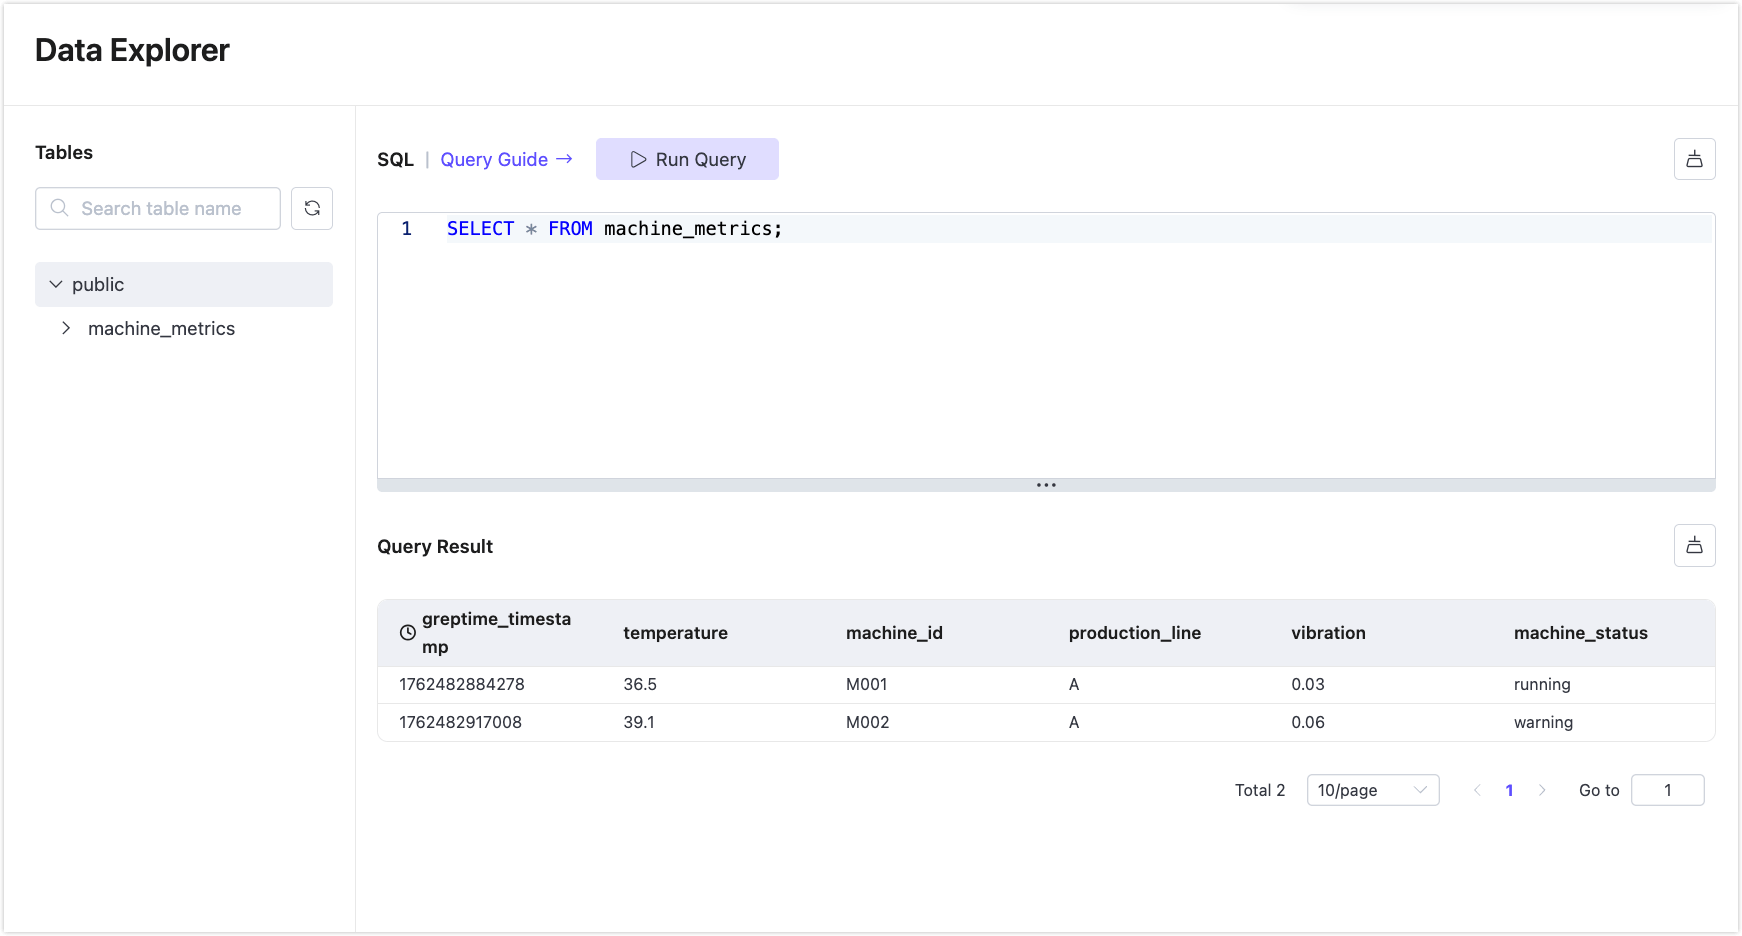
Enter the following SQL in the editor and click Run Query:
sqlSELECT * FROM machine_metrics;You’ll see the messages ingested.
Complete: Native MQTT-to-DB Pipeline
You now have a live pipeline:
MQTT Clients -> EMQX Broker -> Rule Engine -> EMQX Tables -> SQL Analytics
There is no third-party infrastructure, fully managed, and built for time-series IoT workloads.
Next, you can visualize metrics in Grafana or Streamlit. Visit the Integration Guide for more tools and examples.
Quick Guide for Using Database Functions
In addition to ingesting data from EMQX Broker into the default public database, EMQX Tables also allows you to define custom databases and tables, manually insert data using SQL, and query it using the built-in Data Explorer interface. This gives you more flexibility for testing and development.
Create a Custom Database
You can optionally create a custom database apart from the default public database.
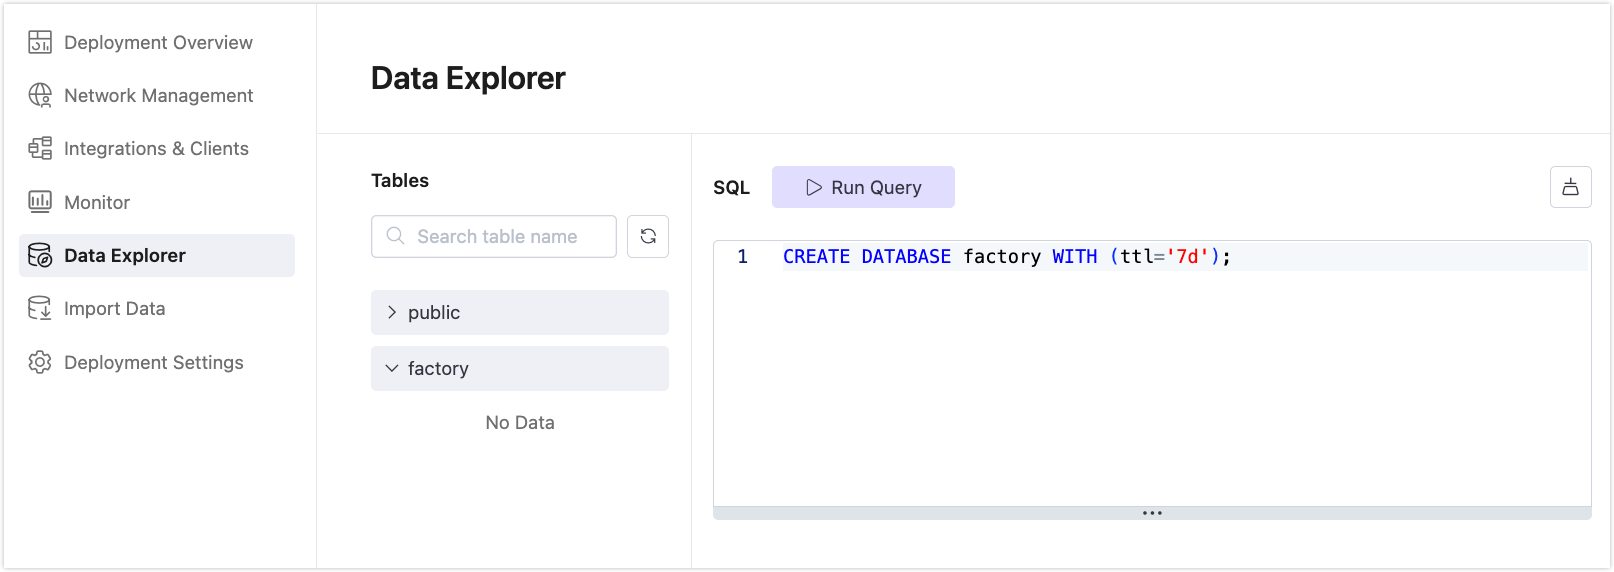
In your deployment, go to the Data Explorer page.
Enter the following SQL, and click Run Query:
sqlCREATE DATABASE factory WITH (ttl='7d');
This creates a new database named factory with a data retention time-to-live (TTL) of 7 days.
Create a Table
Inside the new database, you can define a time-series table for storing factory metrics.
In the Data Explorer, enter the following SQL in the editor and click Run Query:
CREATE TABLE factory.machine_metrics (
    ts TIMESTAMP NOT NULL,
    production_line STRING,
    machine_id STRING,
    temperature DOUBLE,
    vibration DOUBLE,
    machine_status STRING DEFAULT 'running',
    TIME INDEX (ts),
    PRIMARY KEY (production_line, machine_id)
) WITH (
    ttl='7d'
);
This table uses ts as the time index and a composite primary key of production_line and machine_id.
Insert Data Using SQL
EMQX Tables supports both SQL-based and Line Protocol-based data ingestion. You can also write data by uploading .txt and .lp files.
In the Data Explorer, run the following command to insert sample data:
INSERT INTO factory.machine_metrics (ts, production_line, machine_id, temperature, vibration, machine_status)
VALUES
    (now(), 'A', 'M001', 36.5, 0.03, 'running'),
    (now(), 'A', 'M002', 39.1, 0.06, 'warning'),
    (now(), 'B', 'M010', 37.2, 0.02, 'running'),
    (now(), 'B', 'M011', 45.6, 0.12, 'error');
now()inserts the current timestamp.
Query Your Data
To verify your data, use the Data Explorer.
Example Query
View all records:
SELECT * FROM factory.machine_metrics;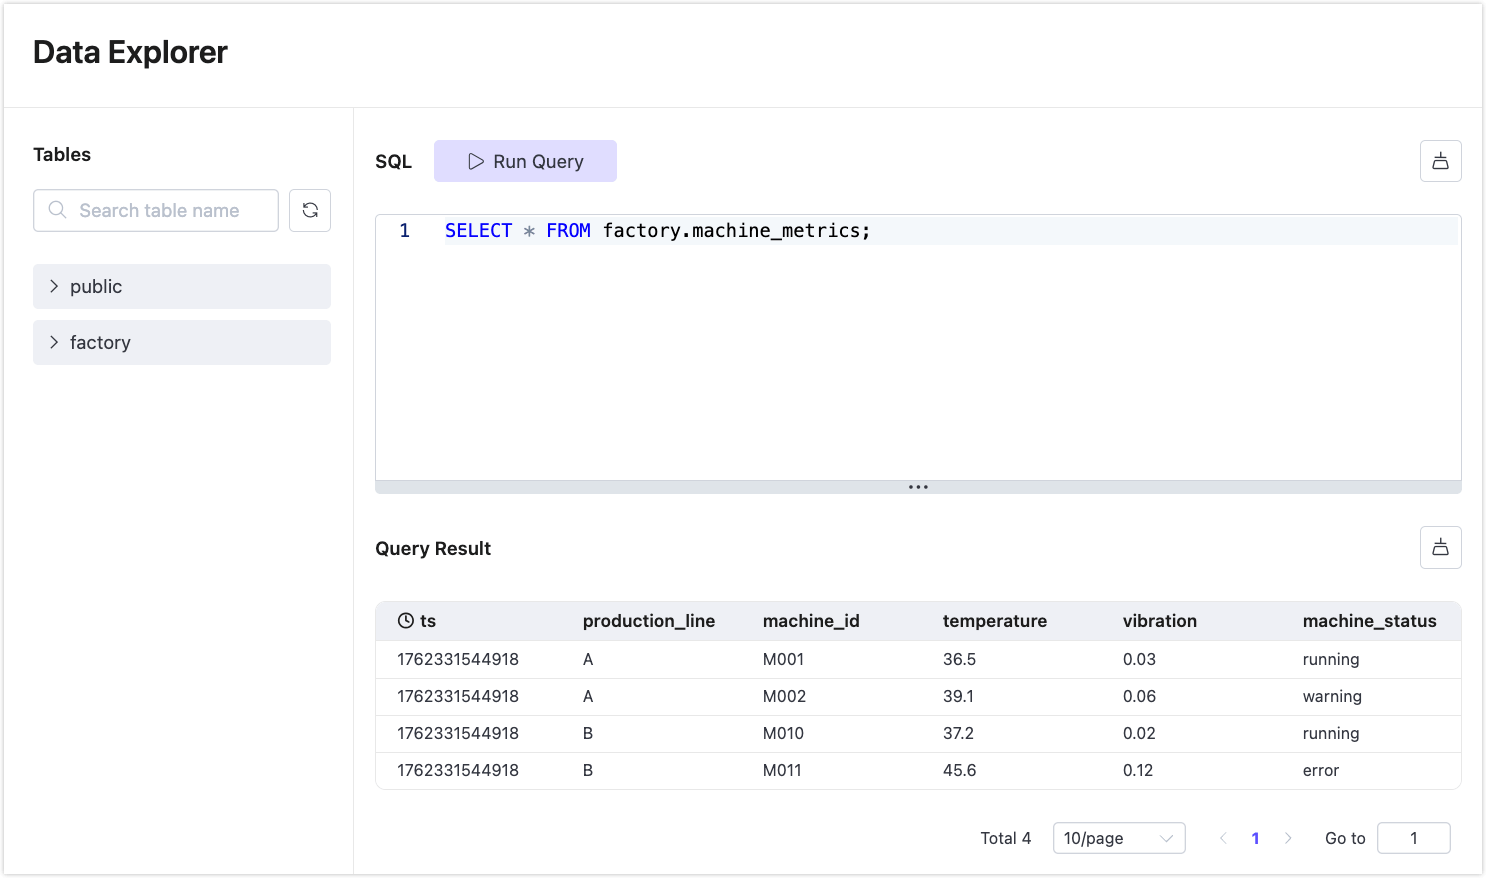
View average temperature in the last 60 minutes, grouped by line and status:
SELECT production_line, machine_status, AVG(temperature) AS avg_temp
FROM factory.machine_metrics
WHERE ts > now() - INTERVAL '60 minute'
GROUP BY production_line, machine_status;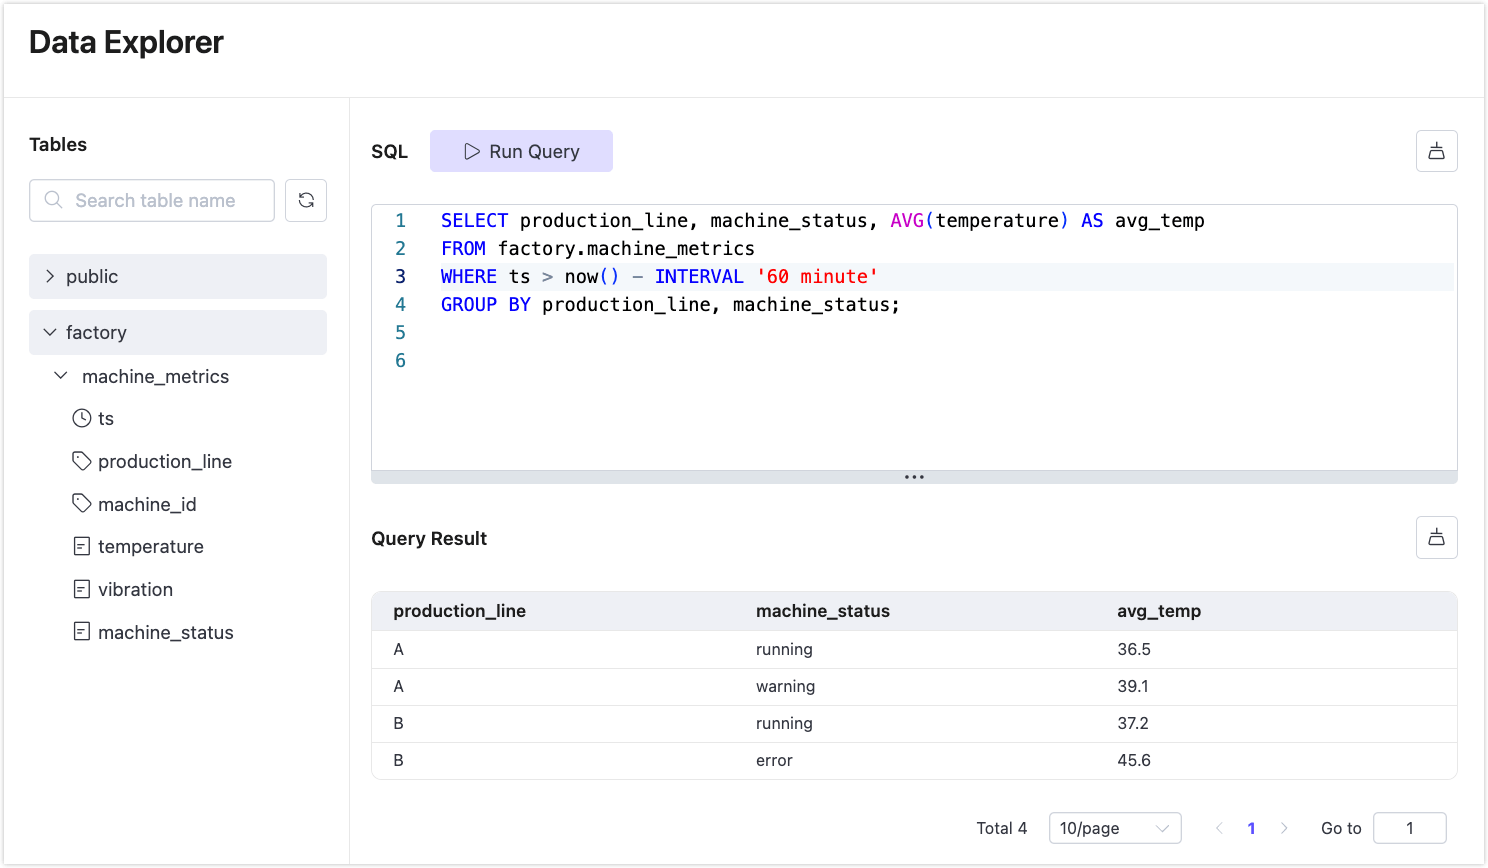
You can also filter by device:
SELECT ts, temperature
FROM machine_metrics
WHERE machine_id = 'M001'
ORDER BY ts DESC
LIMIT 10;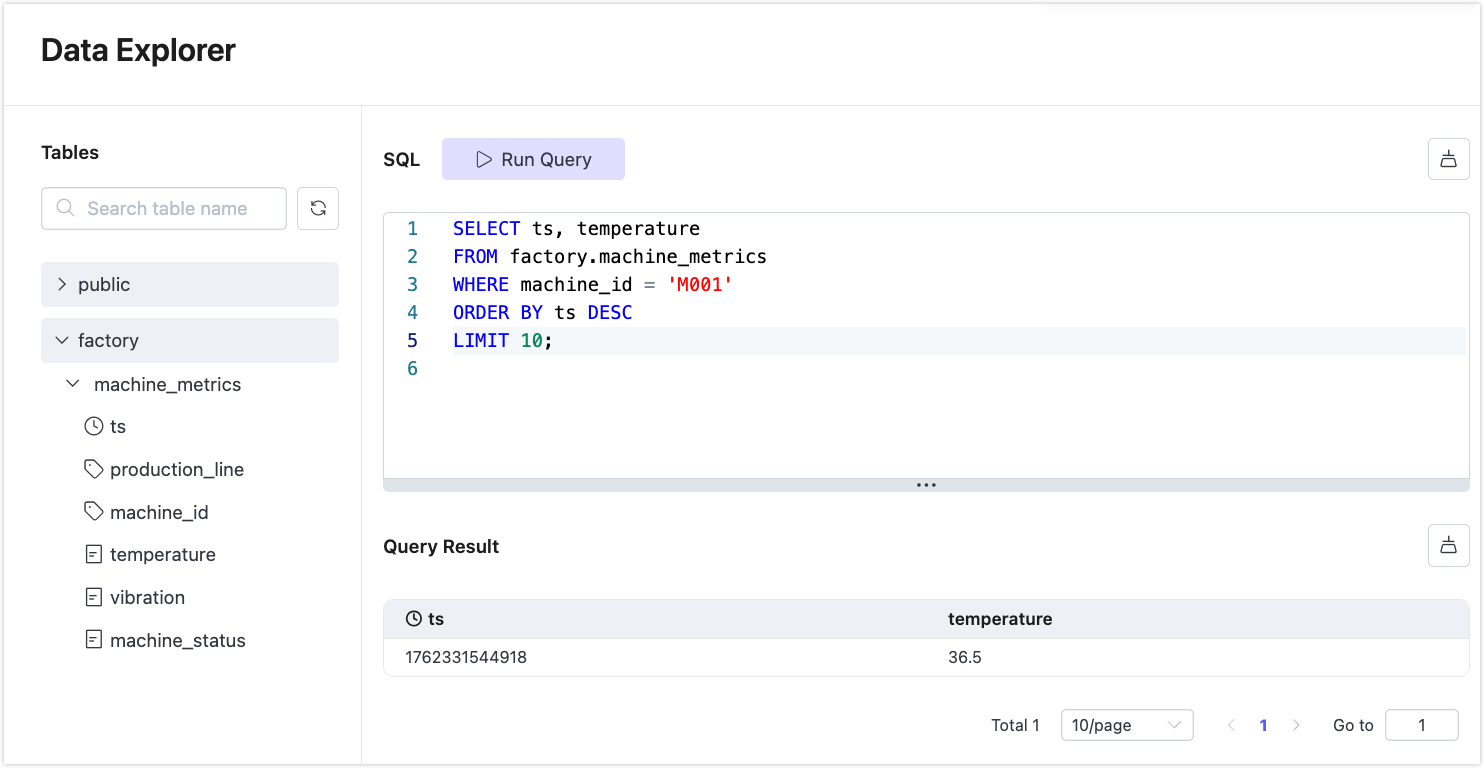
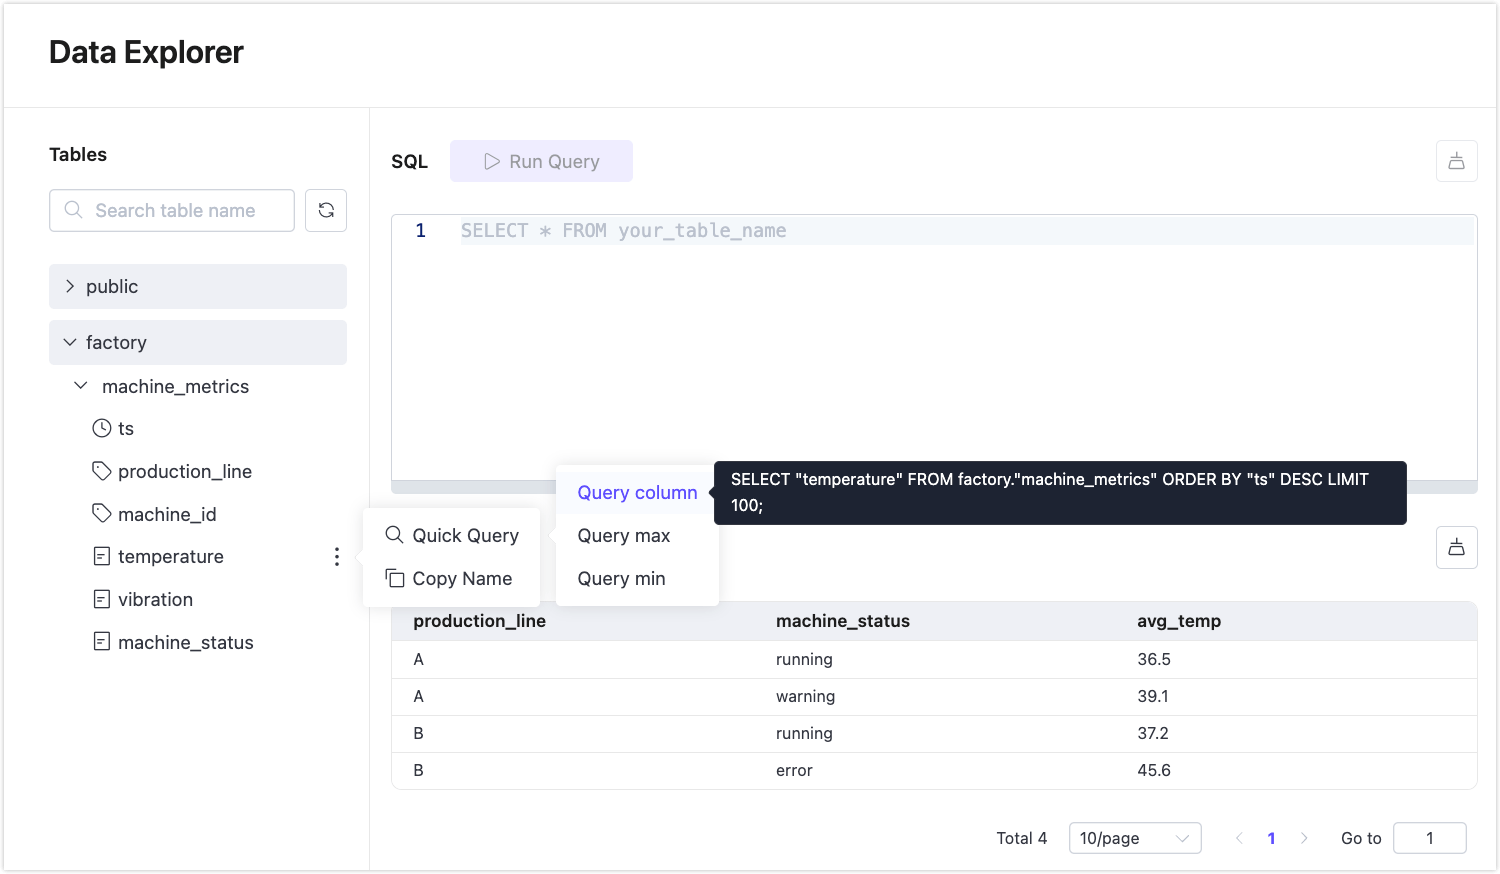
Use Quick Query for Fast Access
You can generate SQL snippets quickly from the table schema:
- Hover over a column in the left-side schema panel under Data Explorer.
- Click the vertical ellipsis (︙) icon beside a column.
- Select Quick Query:
- Use options like Query column, Query max, or Query min.
- The generated SQL will appear in the editor automatically.
Resources
Visit the Greptime document for supported SQL statements and clauses.
For more detailed instructions on how to query data, refer to Query Data in EMQX Tables.