Data Explorer
The Data Explorer provides a unified interface for querying, analyzing, and exporting data stored in EMQX Tables. It is designed to streamline common workflows such as writing and running queries, inspecting query execution behavior, managing query history, and exporting results for further analysis.
This page describes the main components of the Data Explorer and explains how to use its features effectively.
Overview
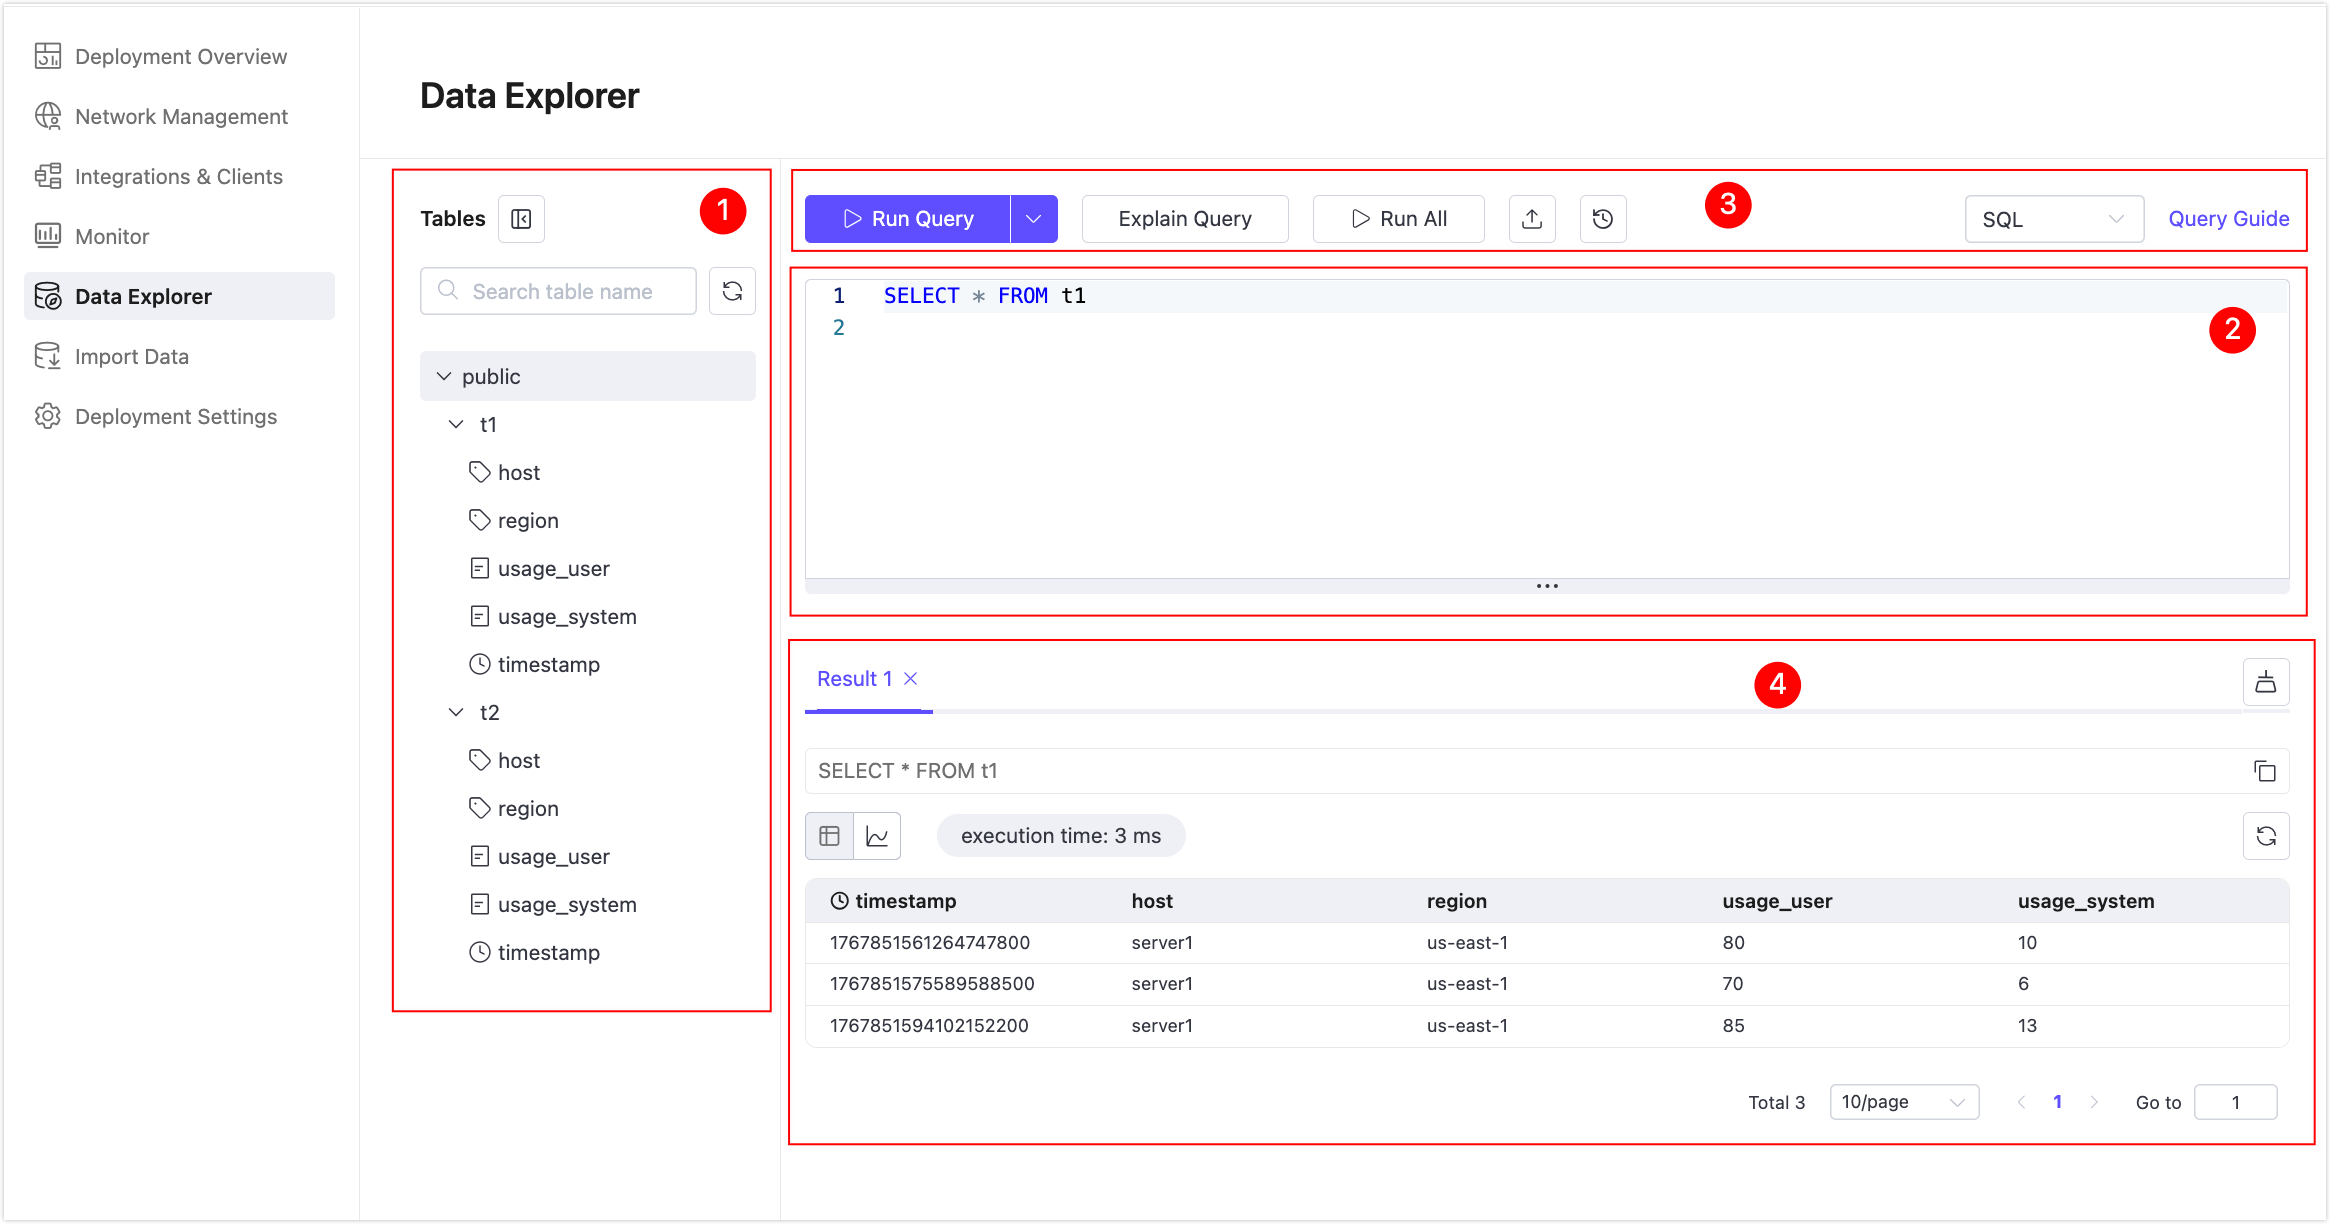
The Data Explorer consists of the following main areas:
- Tables panel: Browse available schemas, tables, and columns, and quickly reference table structures while writing queries.
- Query editor: Write and execute SQL or PromQL queries.
- Action toolbar: Run queries, analyze execution plans with Explain Query, upload or download query files, and access query history.
- Results area: View query results, execution details, and export data in supported formats.
Tables Panel Controls
The Tables panel can be expanded or collapsed to help you focus on query authoring and result analysis.
Click the collapse/expand icon next to Tables to toggle the panel.
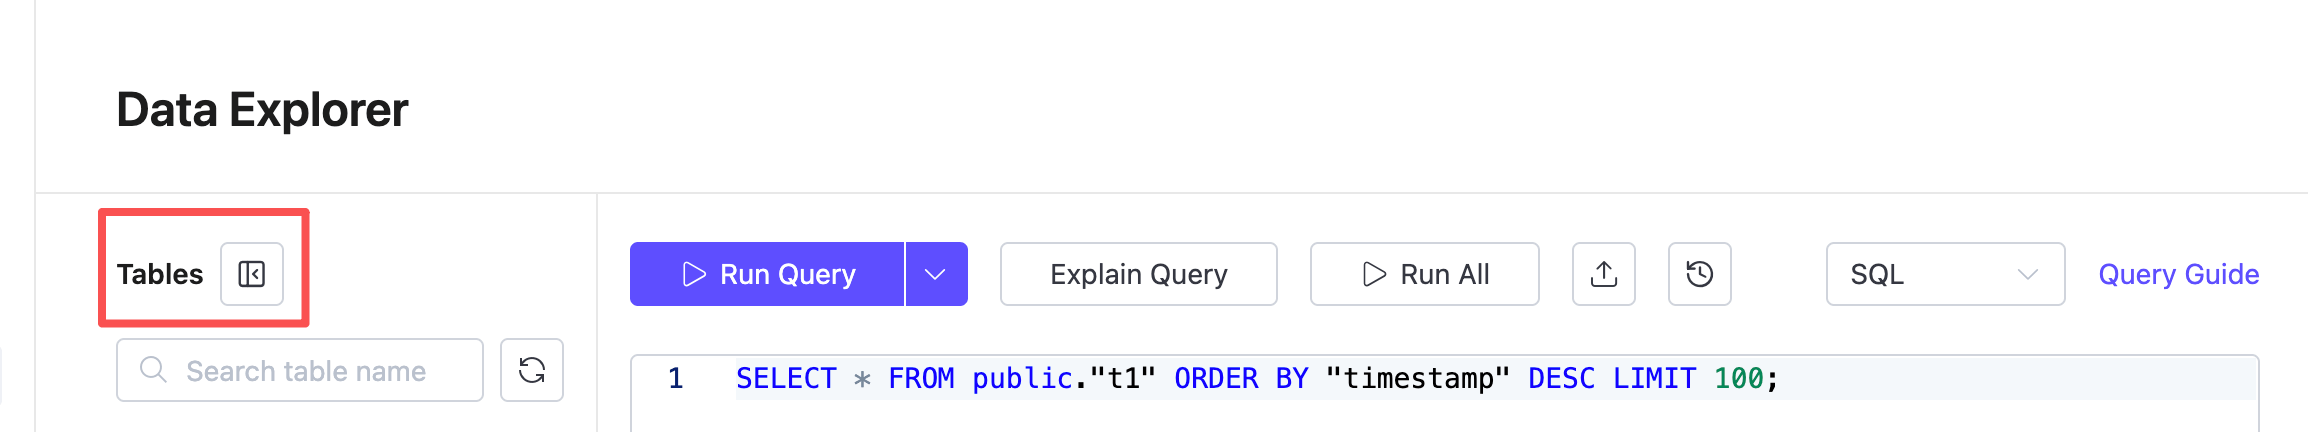
When the panel is hidden, the query editor and results area automatically expand, providing more horizontal space.
This is particularly useful when working with long or complex queries, where additional editor space improves readability and efficiency.
Query Editor
The Query Editor is where you write and execute SQL or PromQL queries against your EMQX Tables data.
Supported Query Types
The Query Editor supports the following query languages:
- SQL (default)
- PromQL
You can switch the query type using the selector in the top-right corner of the editor.
Run Query
The Run Query button executes a query based on the selected query language.
SQL Queries
The Run Query button executes one SQL statement at a time.
- If the editor contains only one SQL statement, click Run Query to execute it directly.
- If the editor contains multiple SQL statements, Data Explorer determines which statement to execute using the rules below.
This behavior allows you to work efficiently with both simple queries and multi-statement scripts in the same editor.
Statement Selection Rules (SQL only)
When multiple SQL statements are present:
- Statements are separated by semicolons (
;). - If no text is selected, the statement where the cursor is currently located is executed.
- If text is selected, only the selected statement(s) are executed.
Use Run All to execute every SQL statement in the editor sequentially.
Examples of SQL Statement Selection
Example 1: Multiple statements on a single line
SELECT * FROM t1;SELECT count(*) FROM t1;SELECT * FROM t2;If the cursor is placed inside
SELECT count(*) FROM t1;, the following statement is executed:sqlSELECT count(*) FROM t1;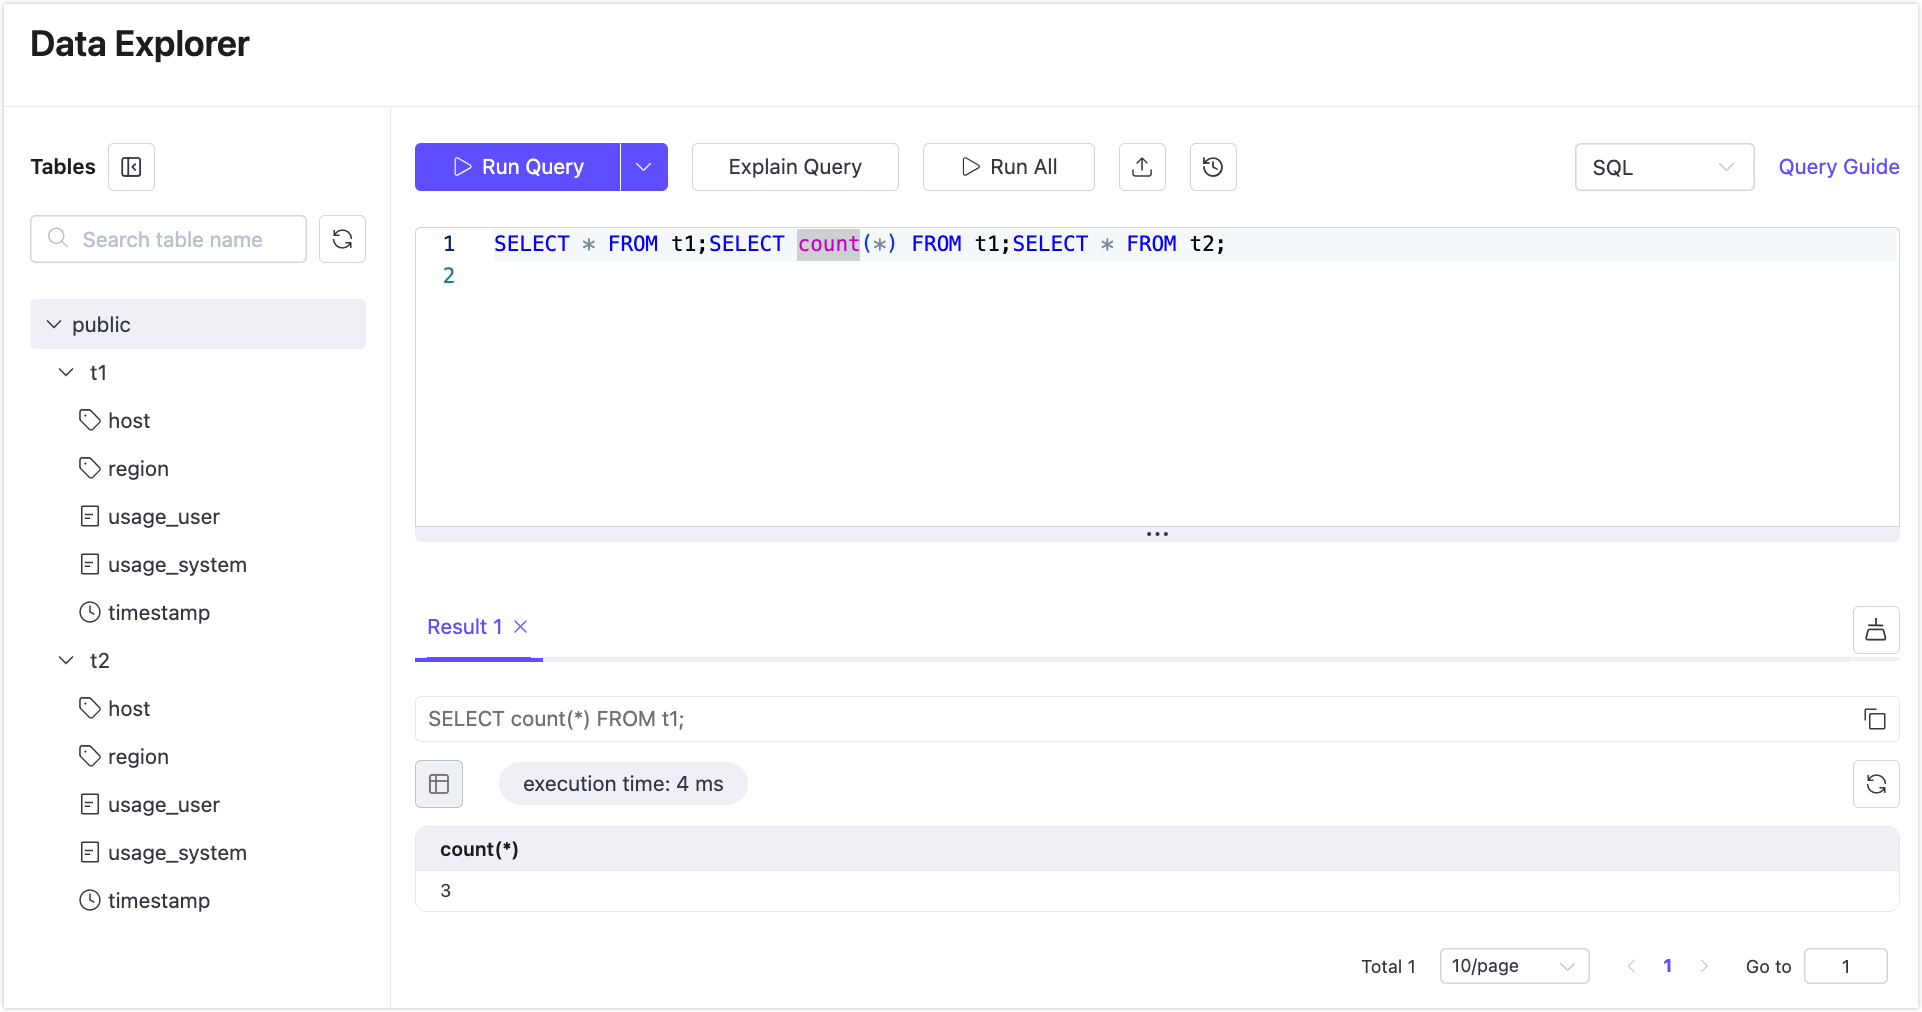
If the cursor is placed inside
SELECT * FROM t2;, the following statement is executed:sqlSELECT * FROM t2;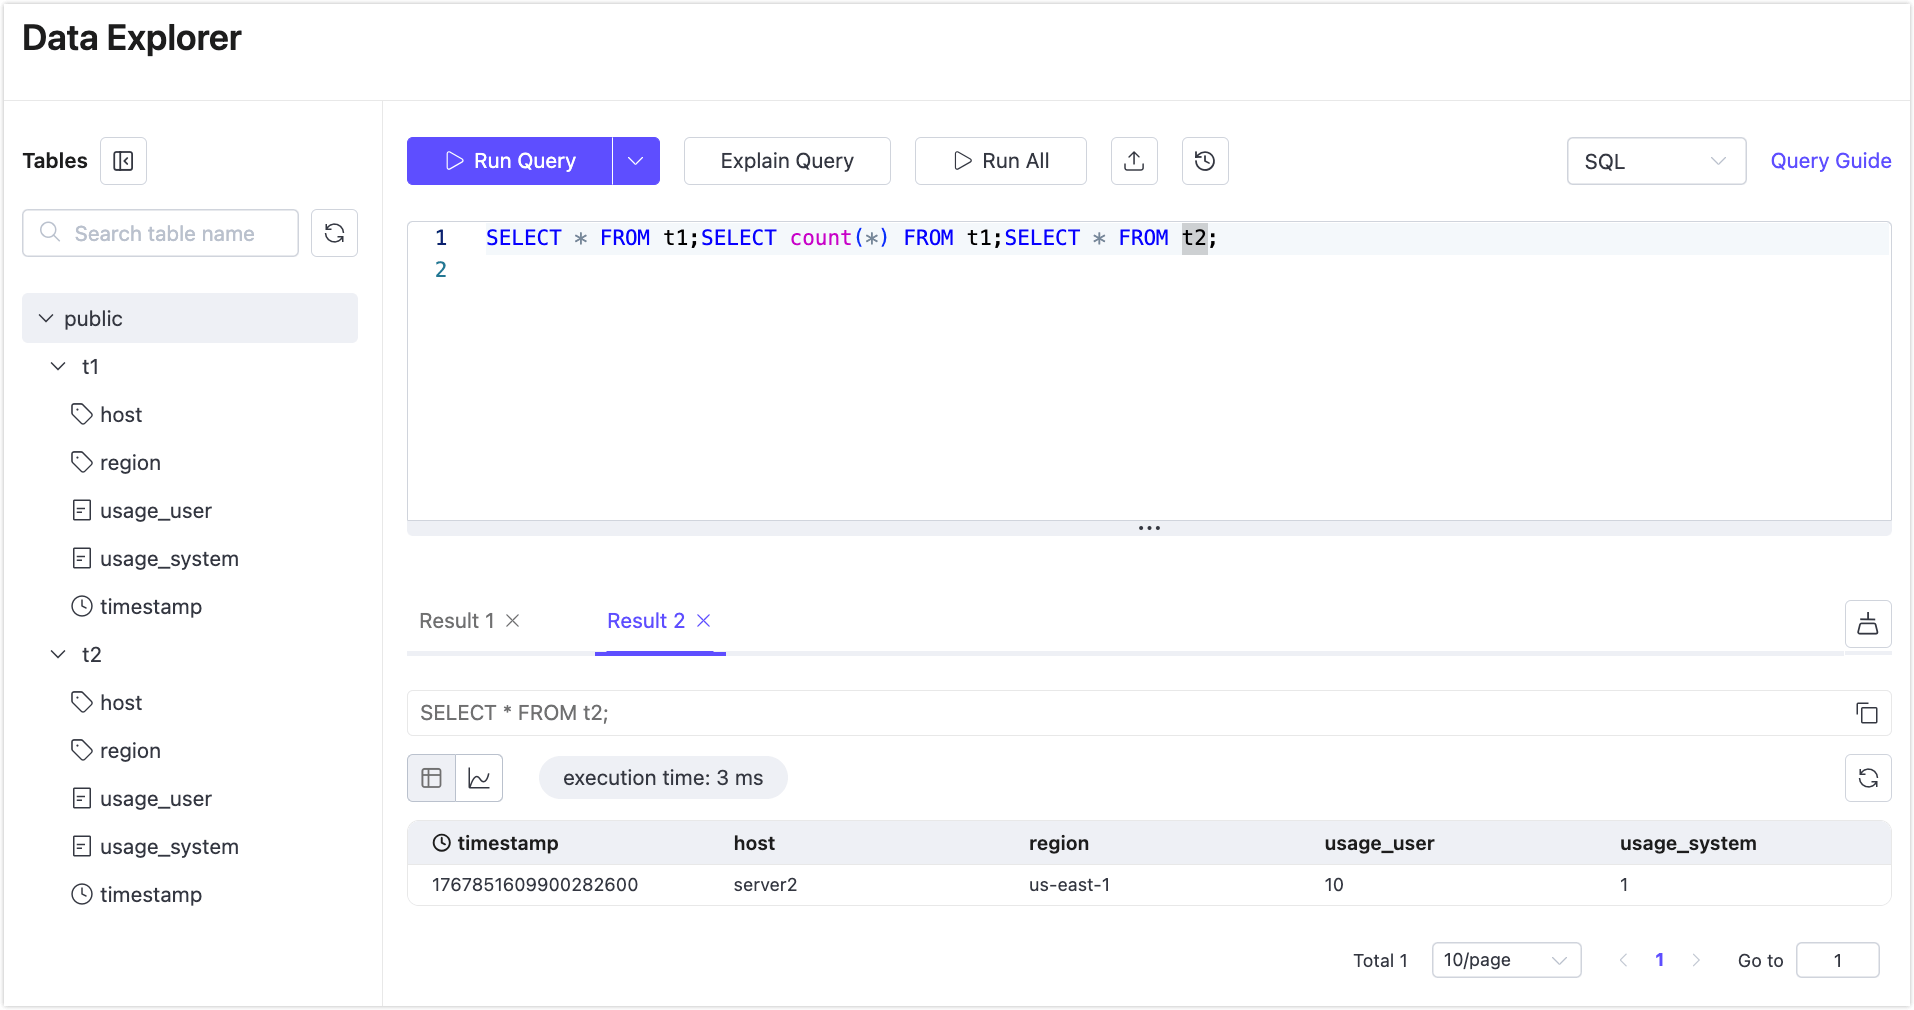
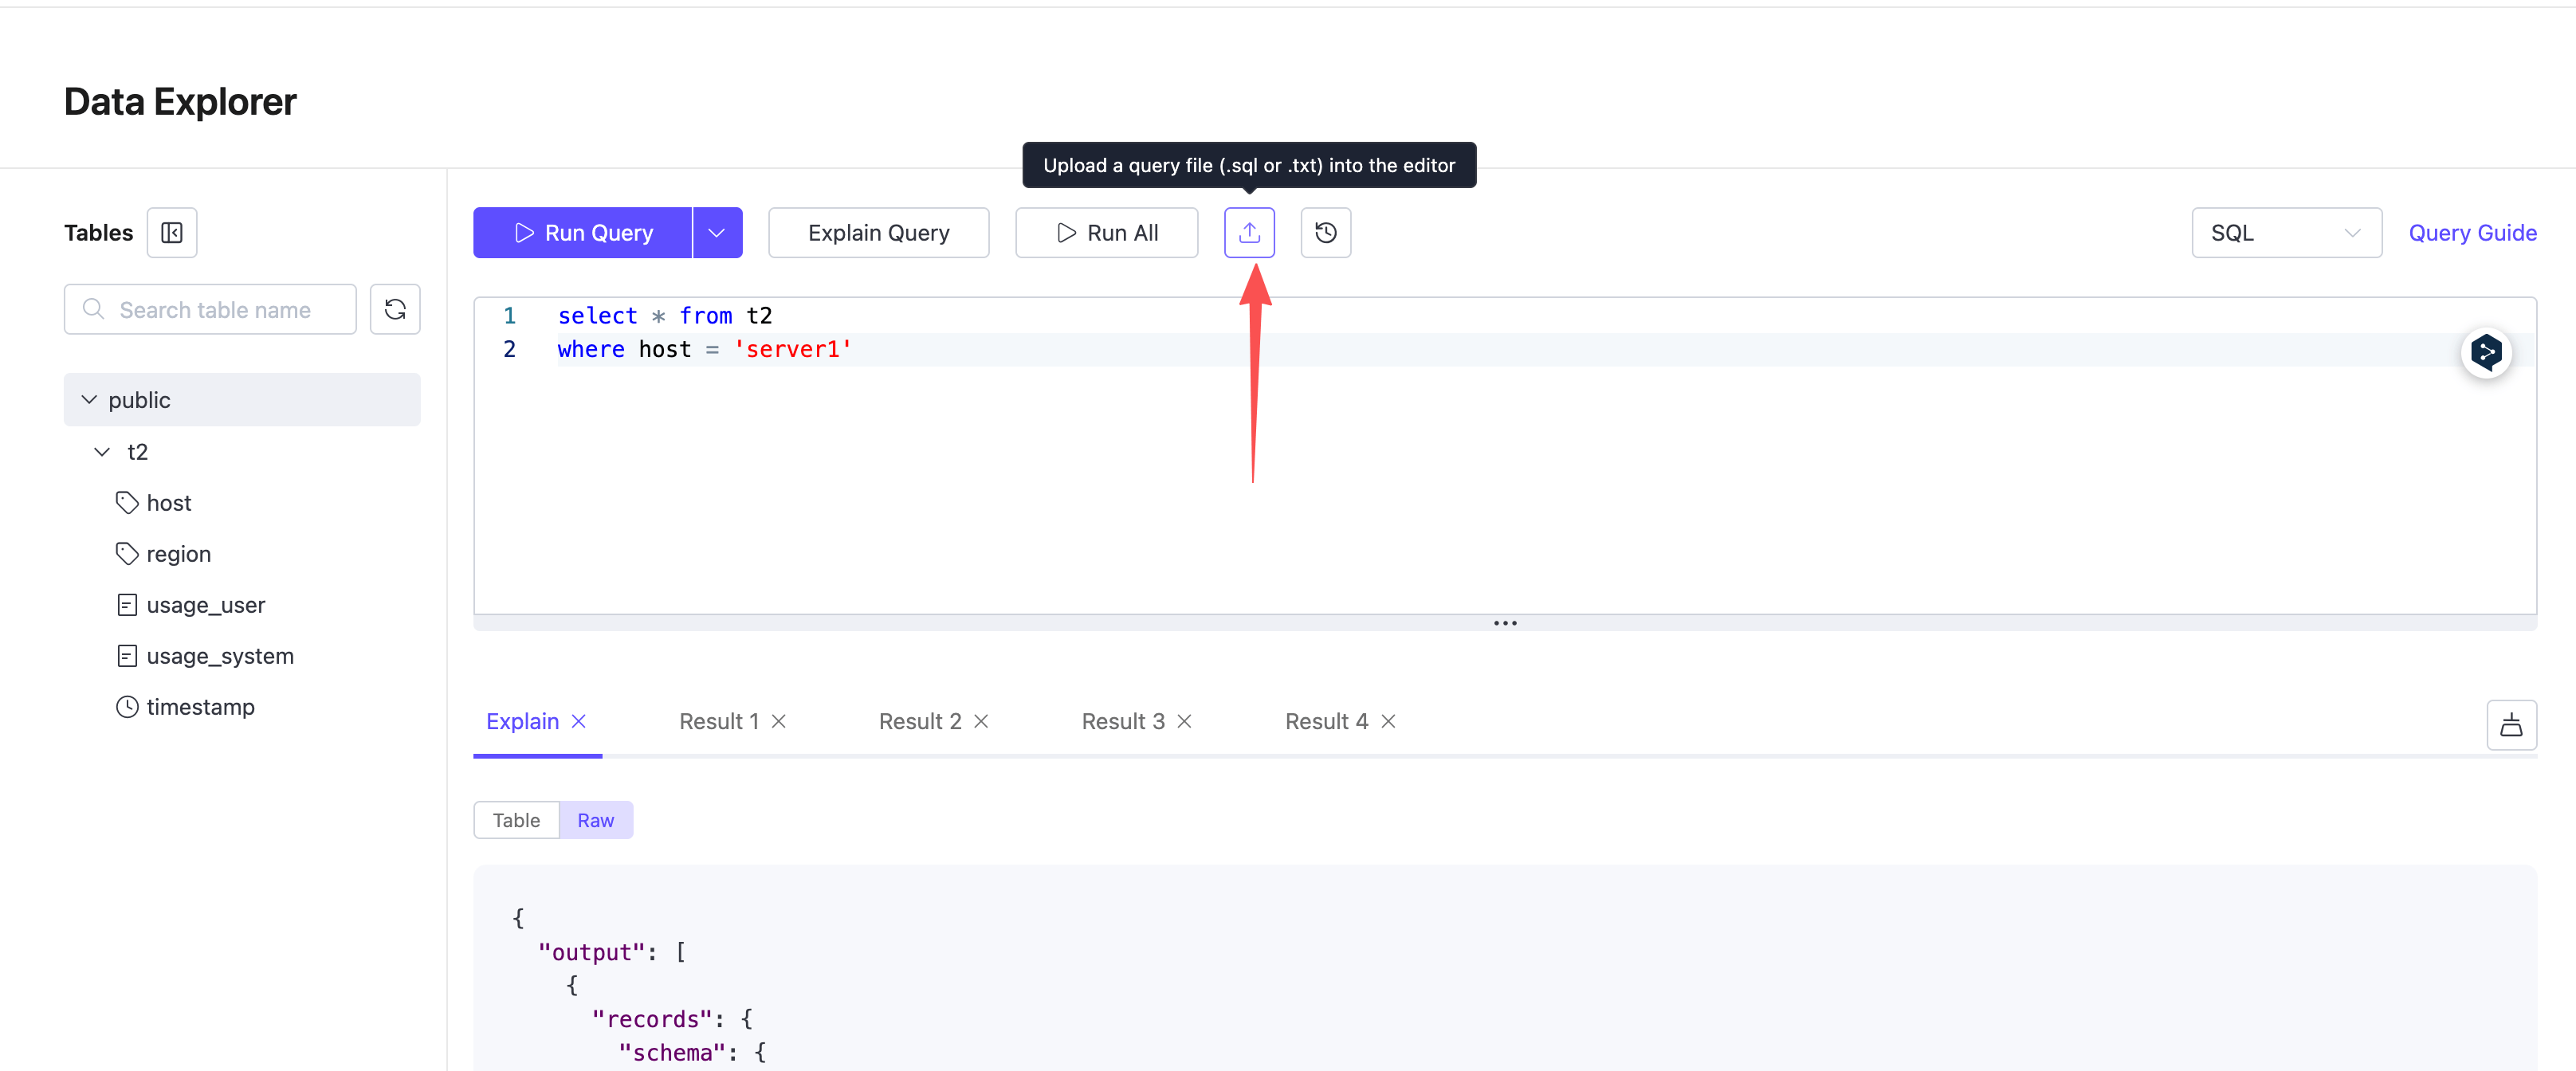
Example 2: Statements split across multiple lines
SELECT * FROM t1
WHERE host = 'server1';

SELECT * FROM t2
ORDER BY "timestamp" DESC
LIMIT 10;
If the cursor is placed anywhere inside the first query (SELECT * FROM t1 ...), the following statement is executed:
SELECT * FROM t1
WHERE host = 'server1';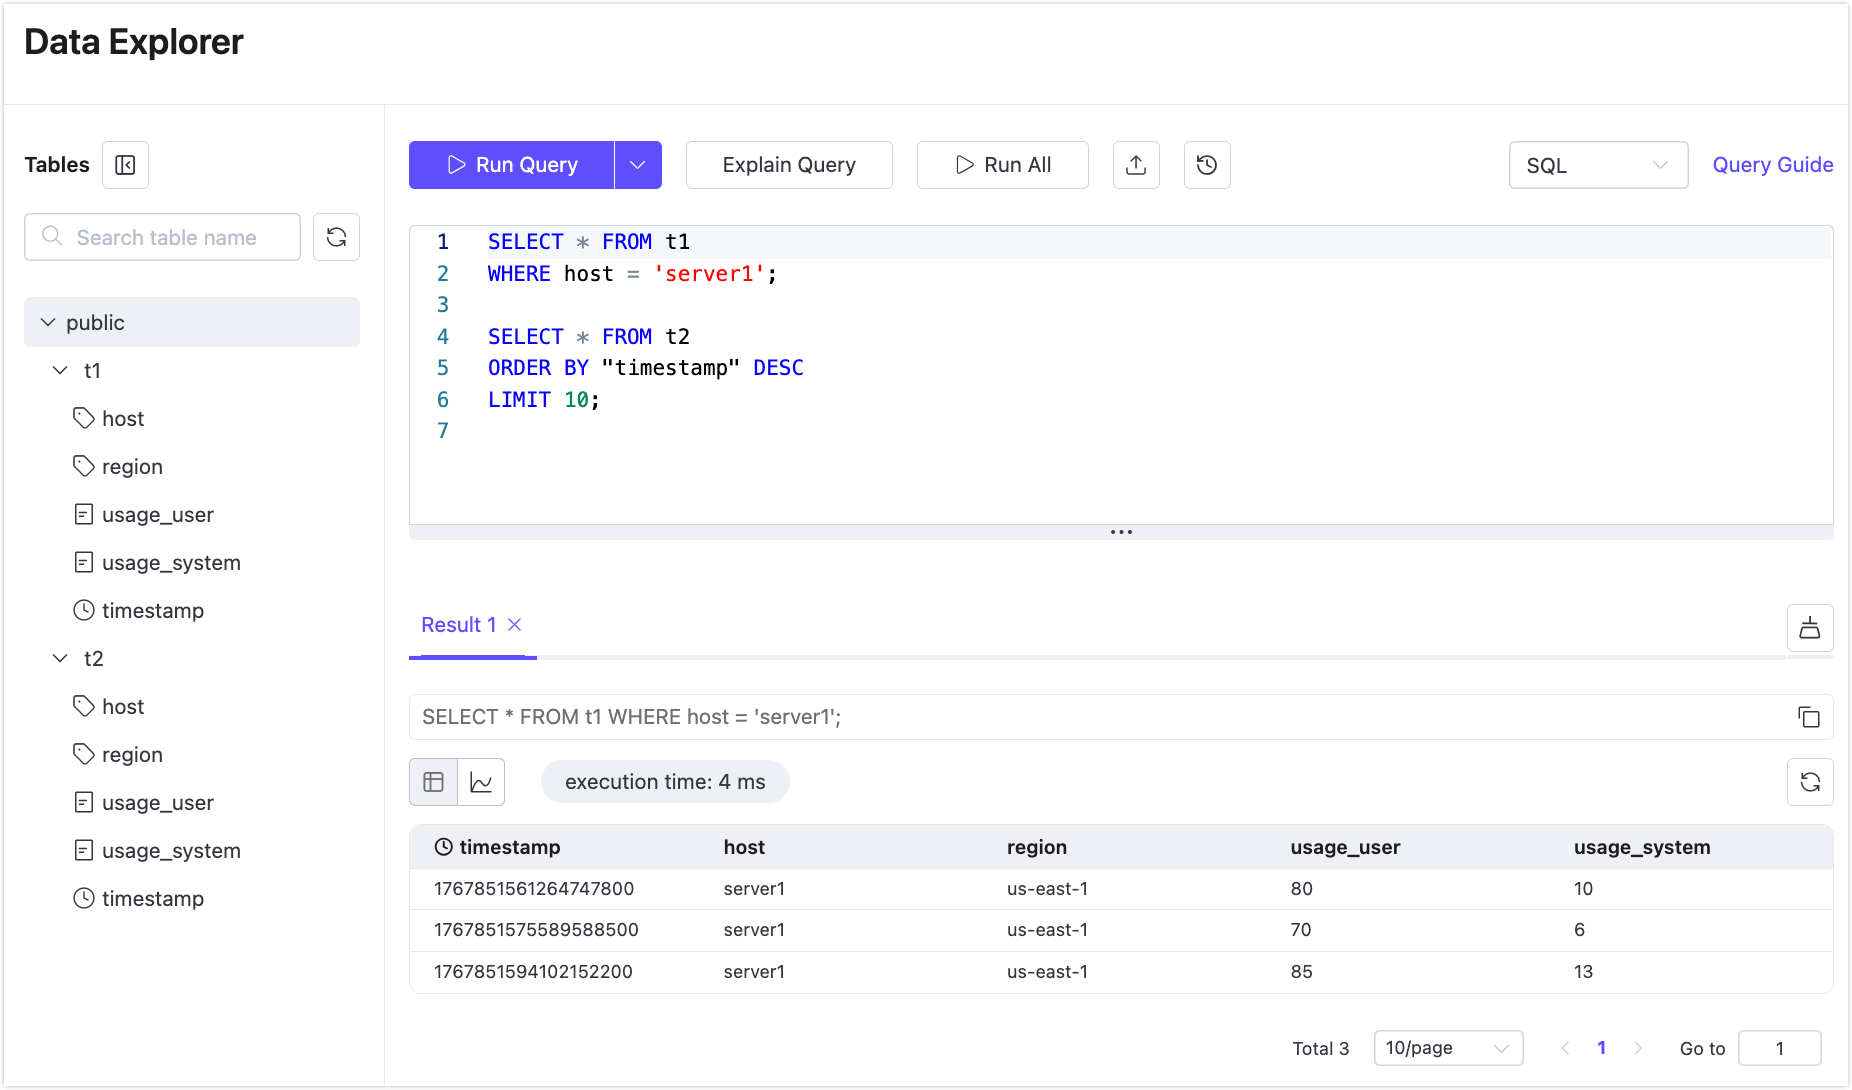
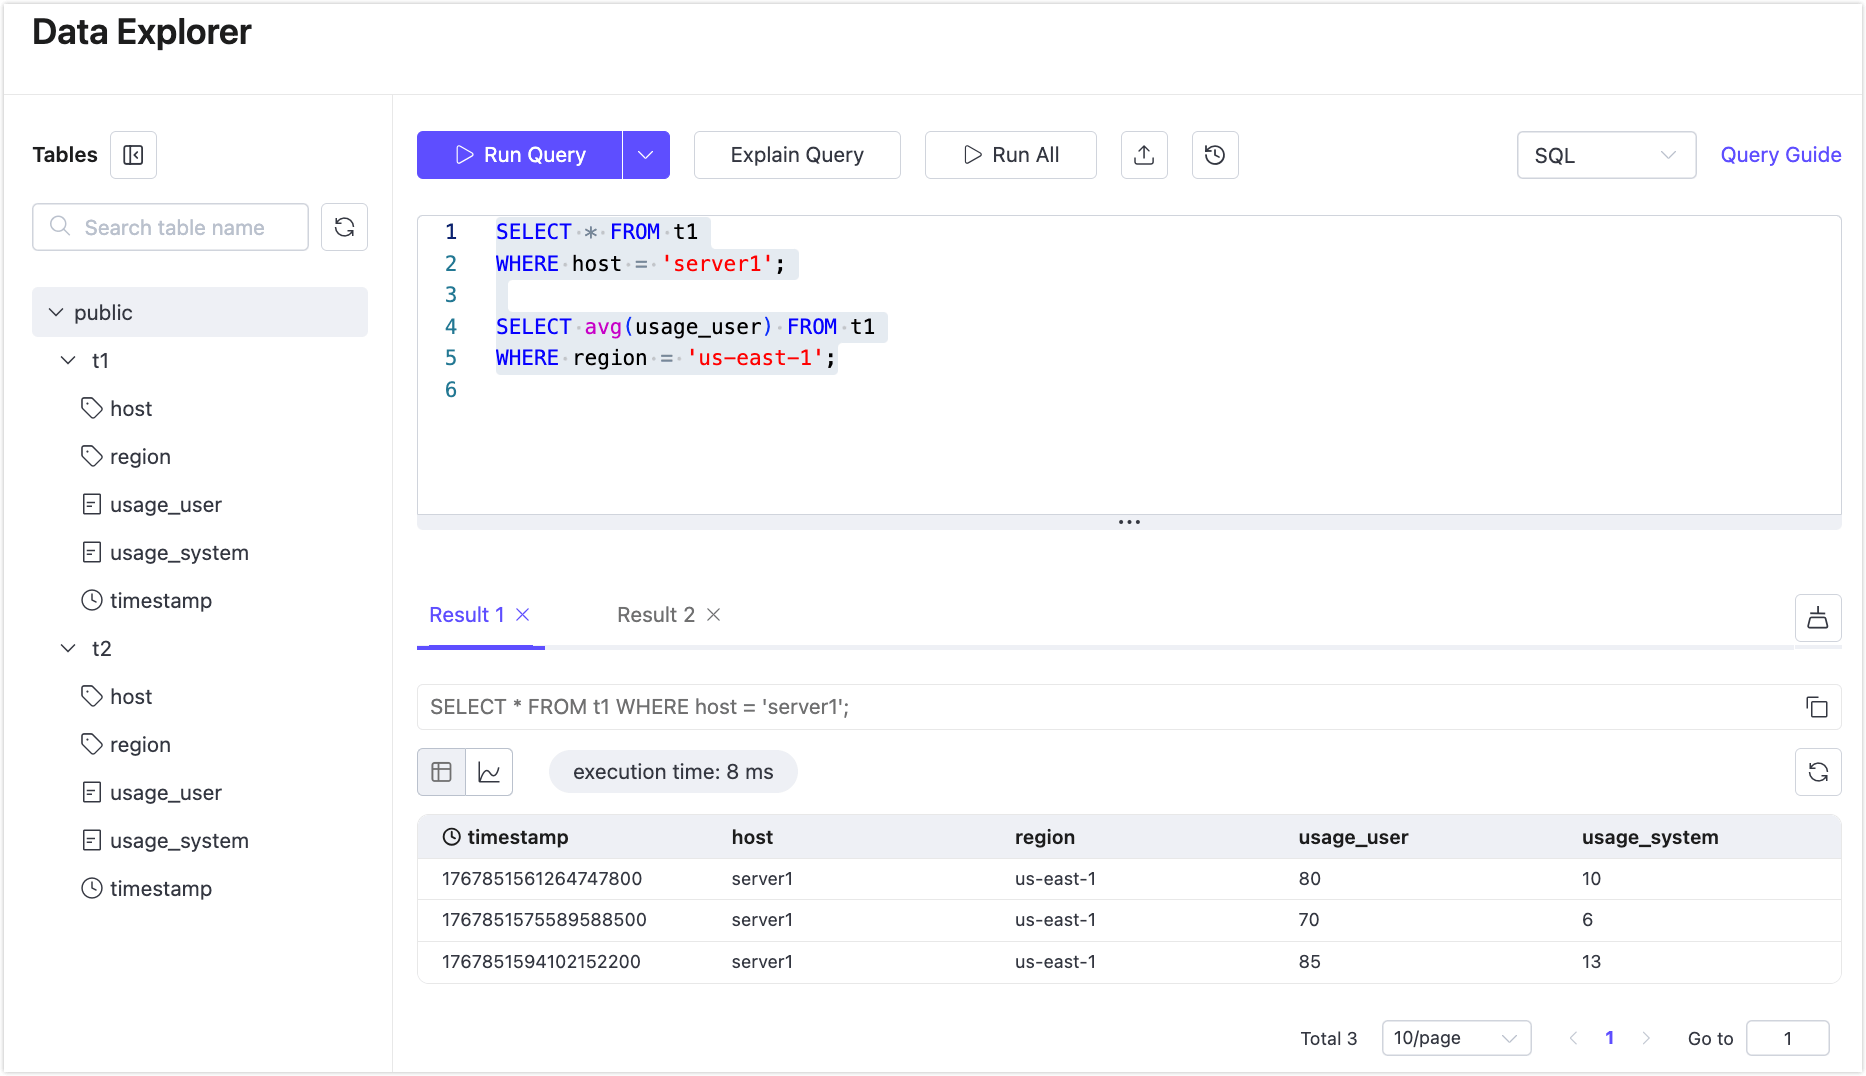
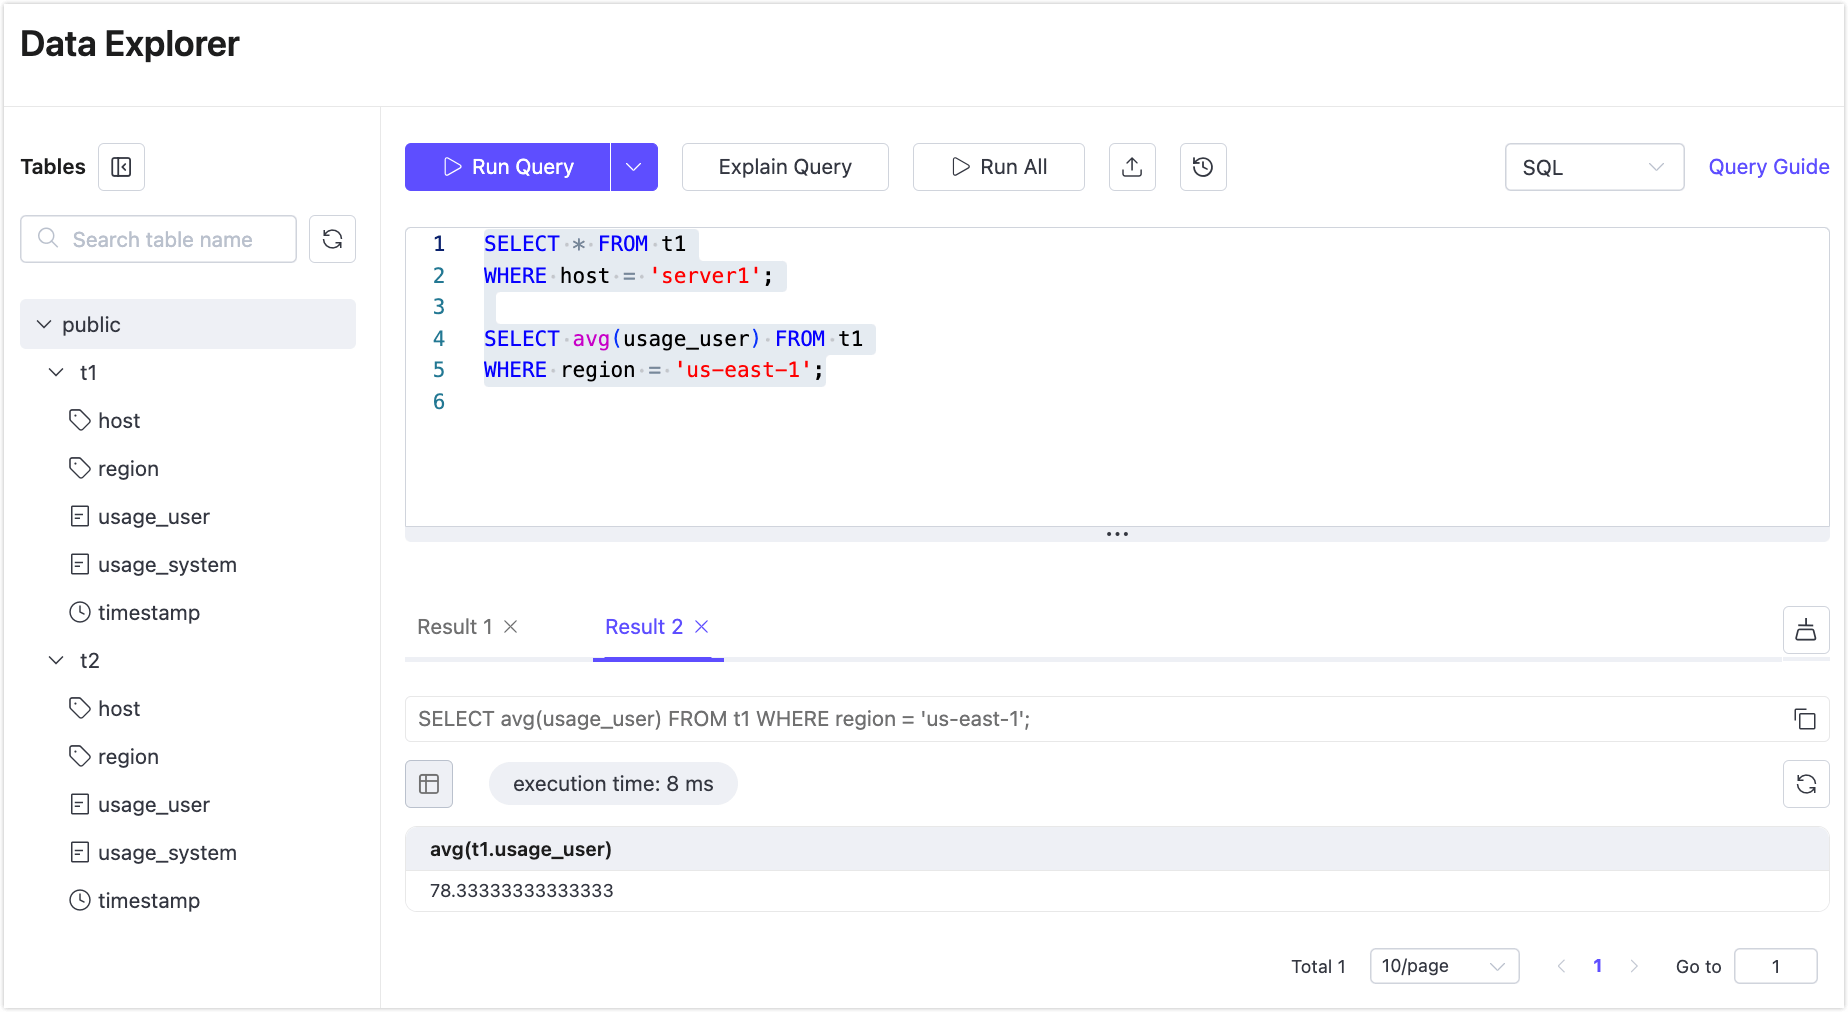
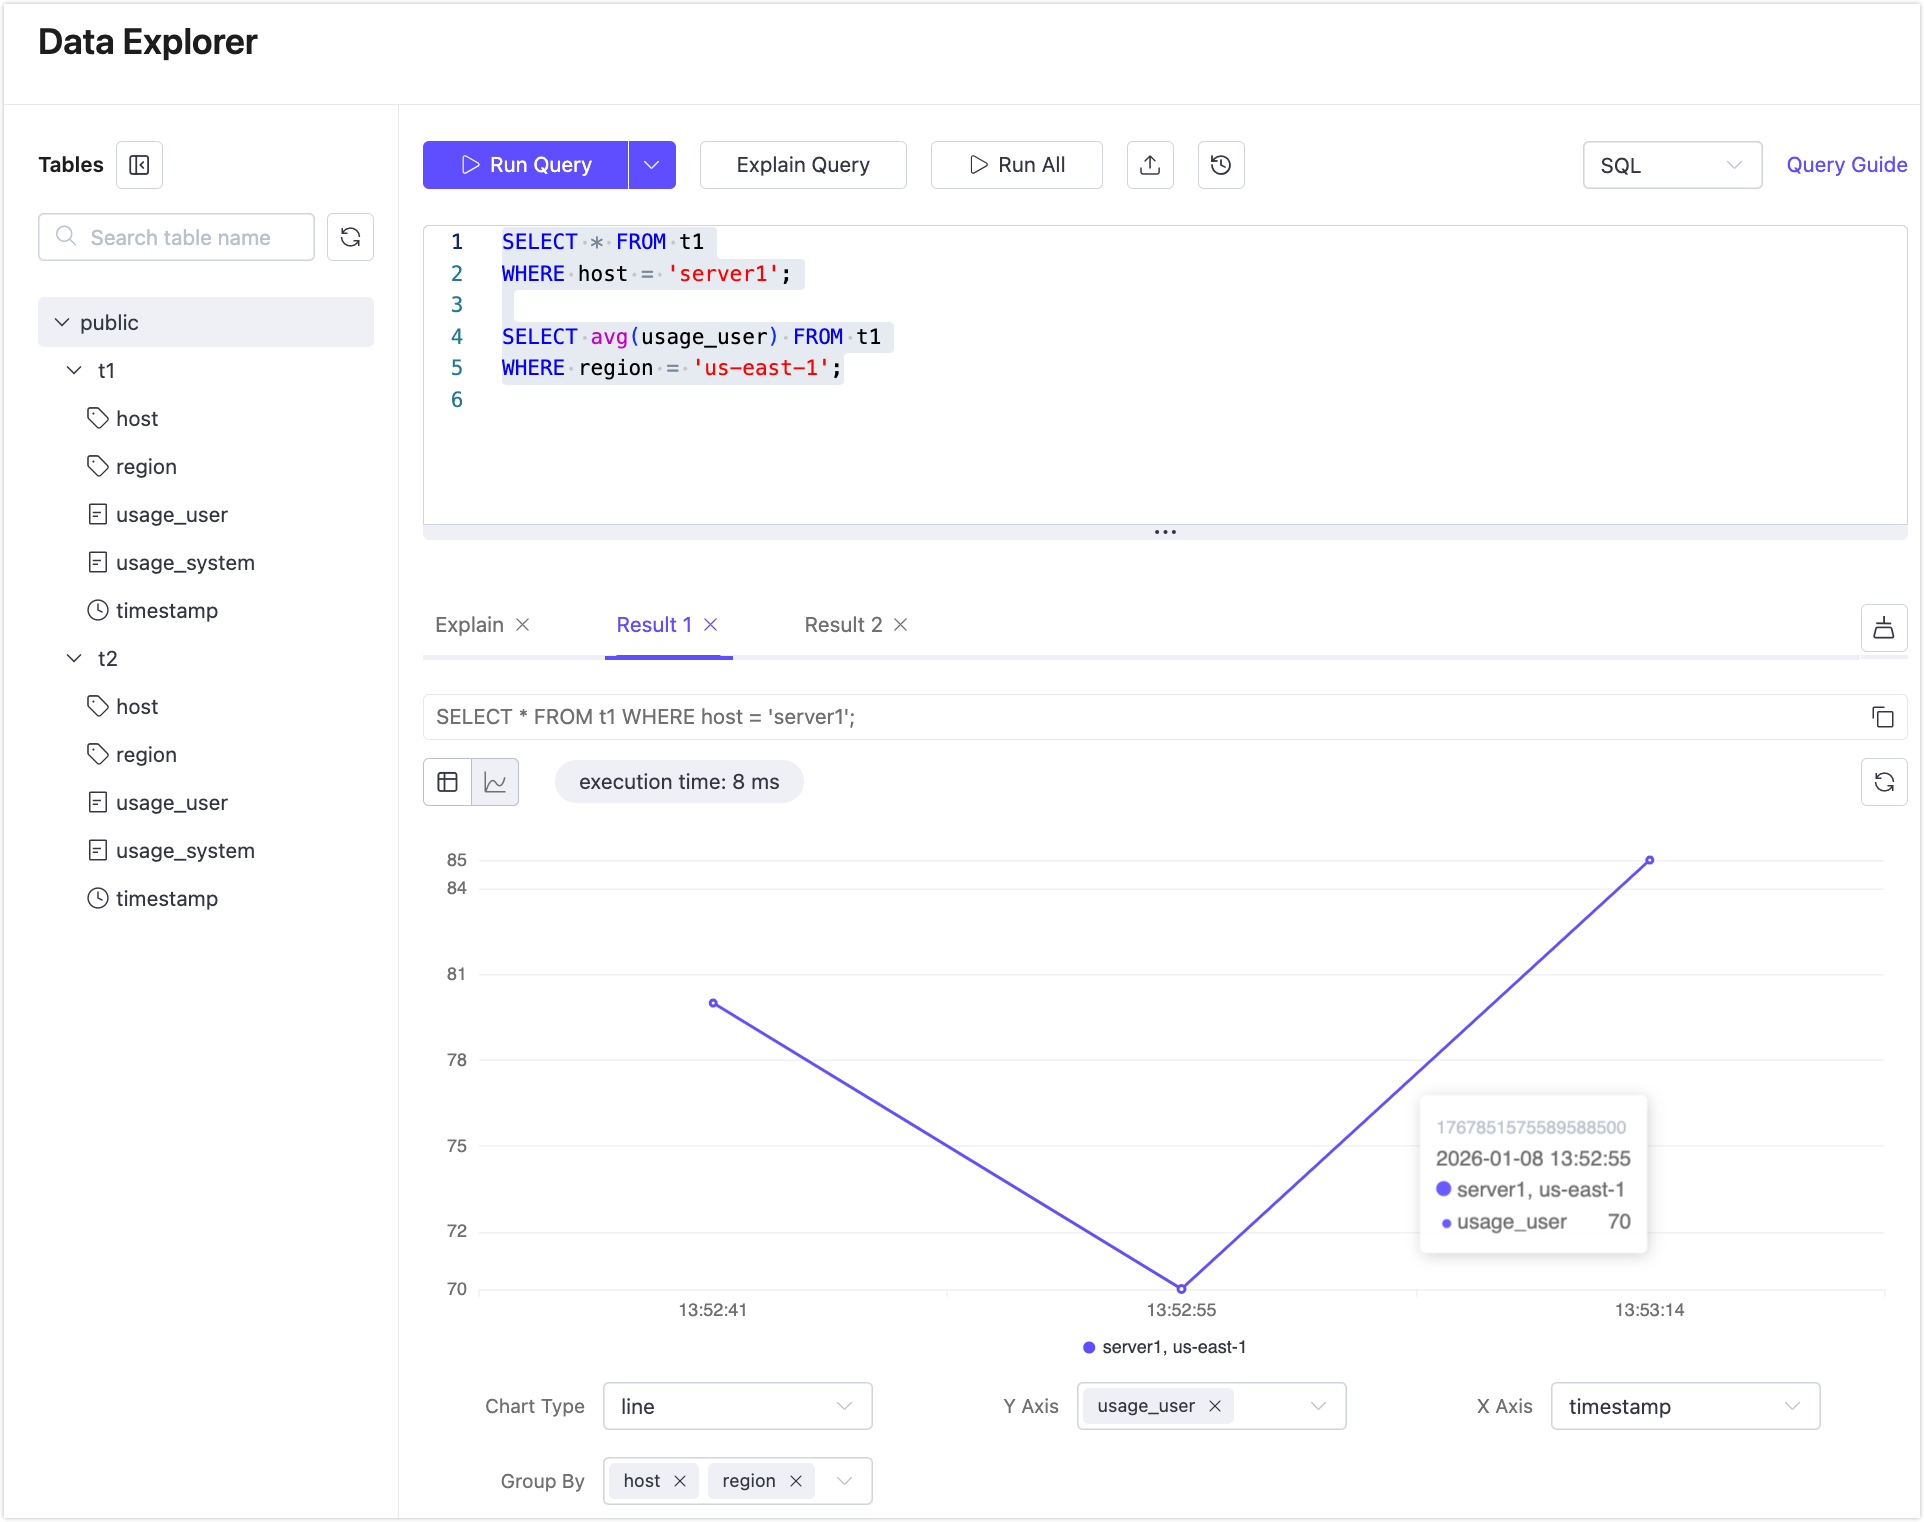
Example 3: Executing multiple statements together
SELECT * FROM t1
WHERE host = 'server1';

SELECT avg(usage_user) FROM t1
WHERE region = 'us-east-1';
Select both statements using the mouse and click Run Query.
Both statements are executed sequentially, and each successful execution produces a separate result tab.
PromQL Queries
For PromQL, the Run Query button always executes a single PromQL statement.
- Only one PromQL statement is supported in the editor at a time.
- Cursor position and text selection are not applicable.
- Executing multiple PromQL statements or selecting part of a statement is not supported.
When a PromQL query is present, click Run Query to execute the statement directly.
Run All
The Run All button executes every SQL statement in the editor sequentially.
- Available for SQL only.
- Each successfully executed statement generates a separate result tab.
Use this when you want to run batch queries or compare results from multiple queries at once.
Explain Query
The Explain Query feature helps you understand how a SQL or PromQL query is executed internally.
It returns the detailed execution process of the query, including:
- The execution stages involved
- How the query is planned and executed
- The time spent in each stage
Explain Query is commonly used to identify performance bottlenecks, analyze slow SQL/PromQL queries, and optimize query design.
Click Explain Query to analyze the current SQL or PromQL statement. The Explain result is displayed as a dedicated Explain tab, positioned to the left of normal query result tabs. Only the latest Explain result is retained and displayed.
The Explain Query result supports three different views, allowing you to examine the execution plan from multiple perspectives.
Table View
The Table view represents the query execution plan in a structured, stage-based table. Execution is grouped into stages, and each stage displays a hierarchical operator tree that reflects how the query is processed internally.
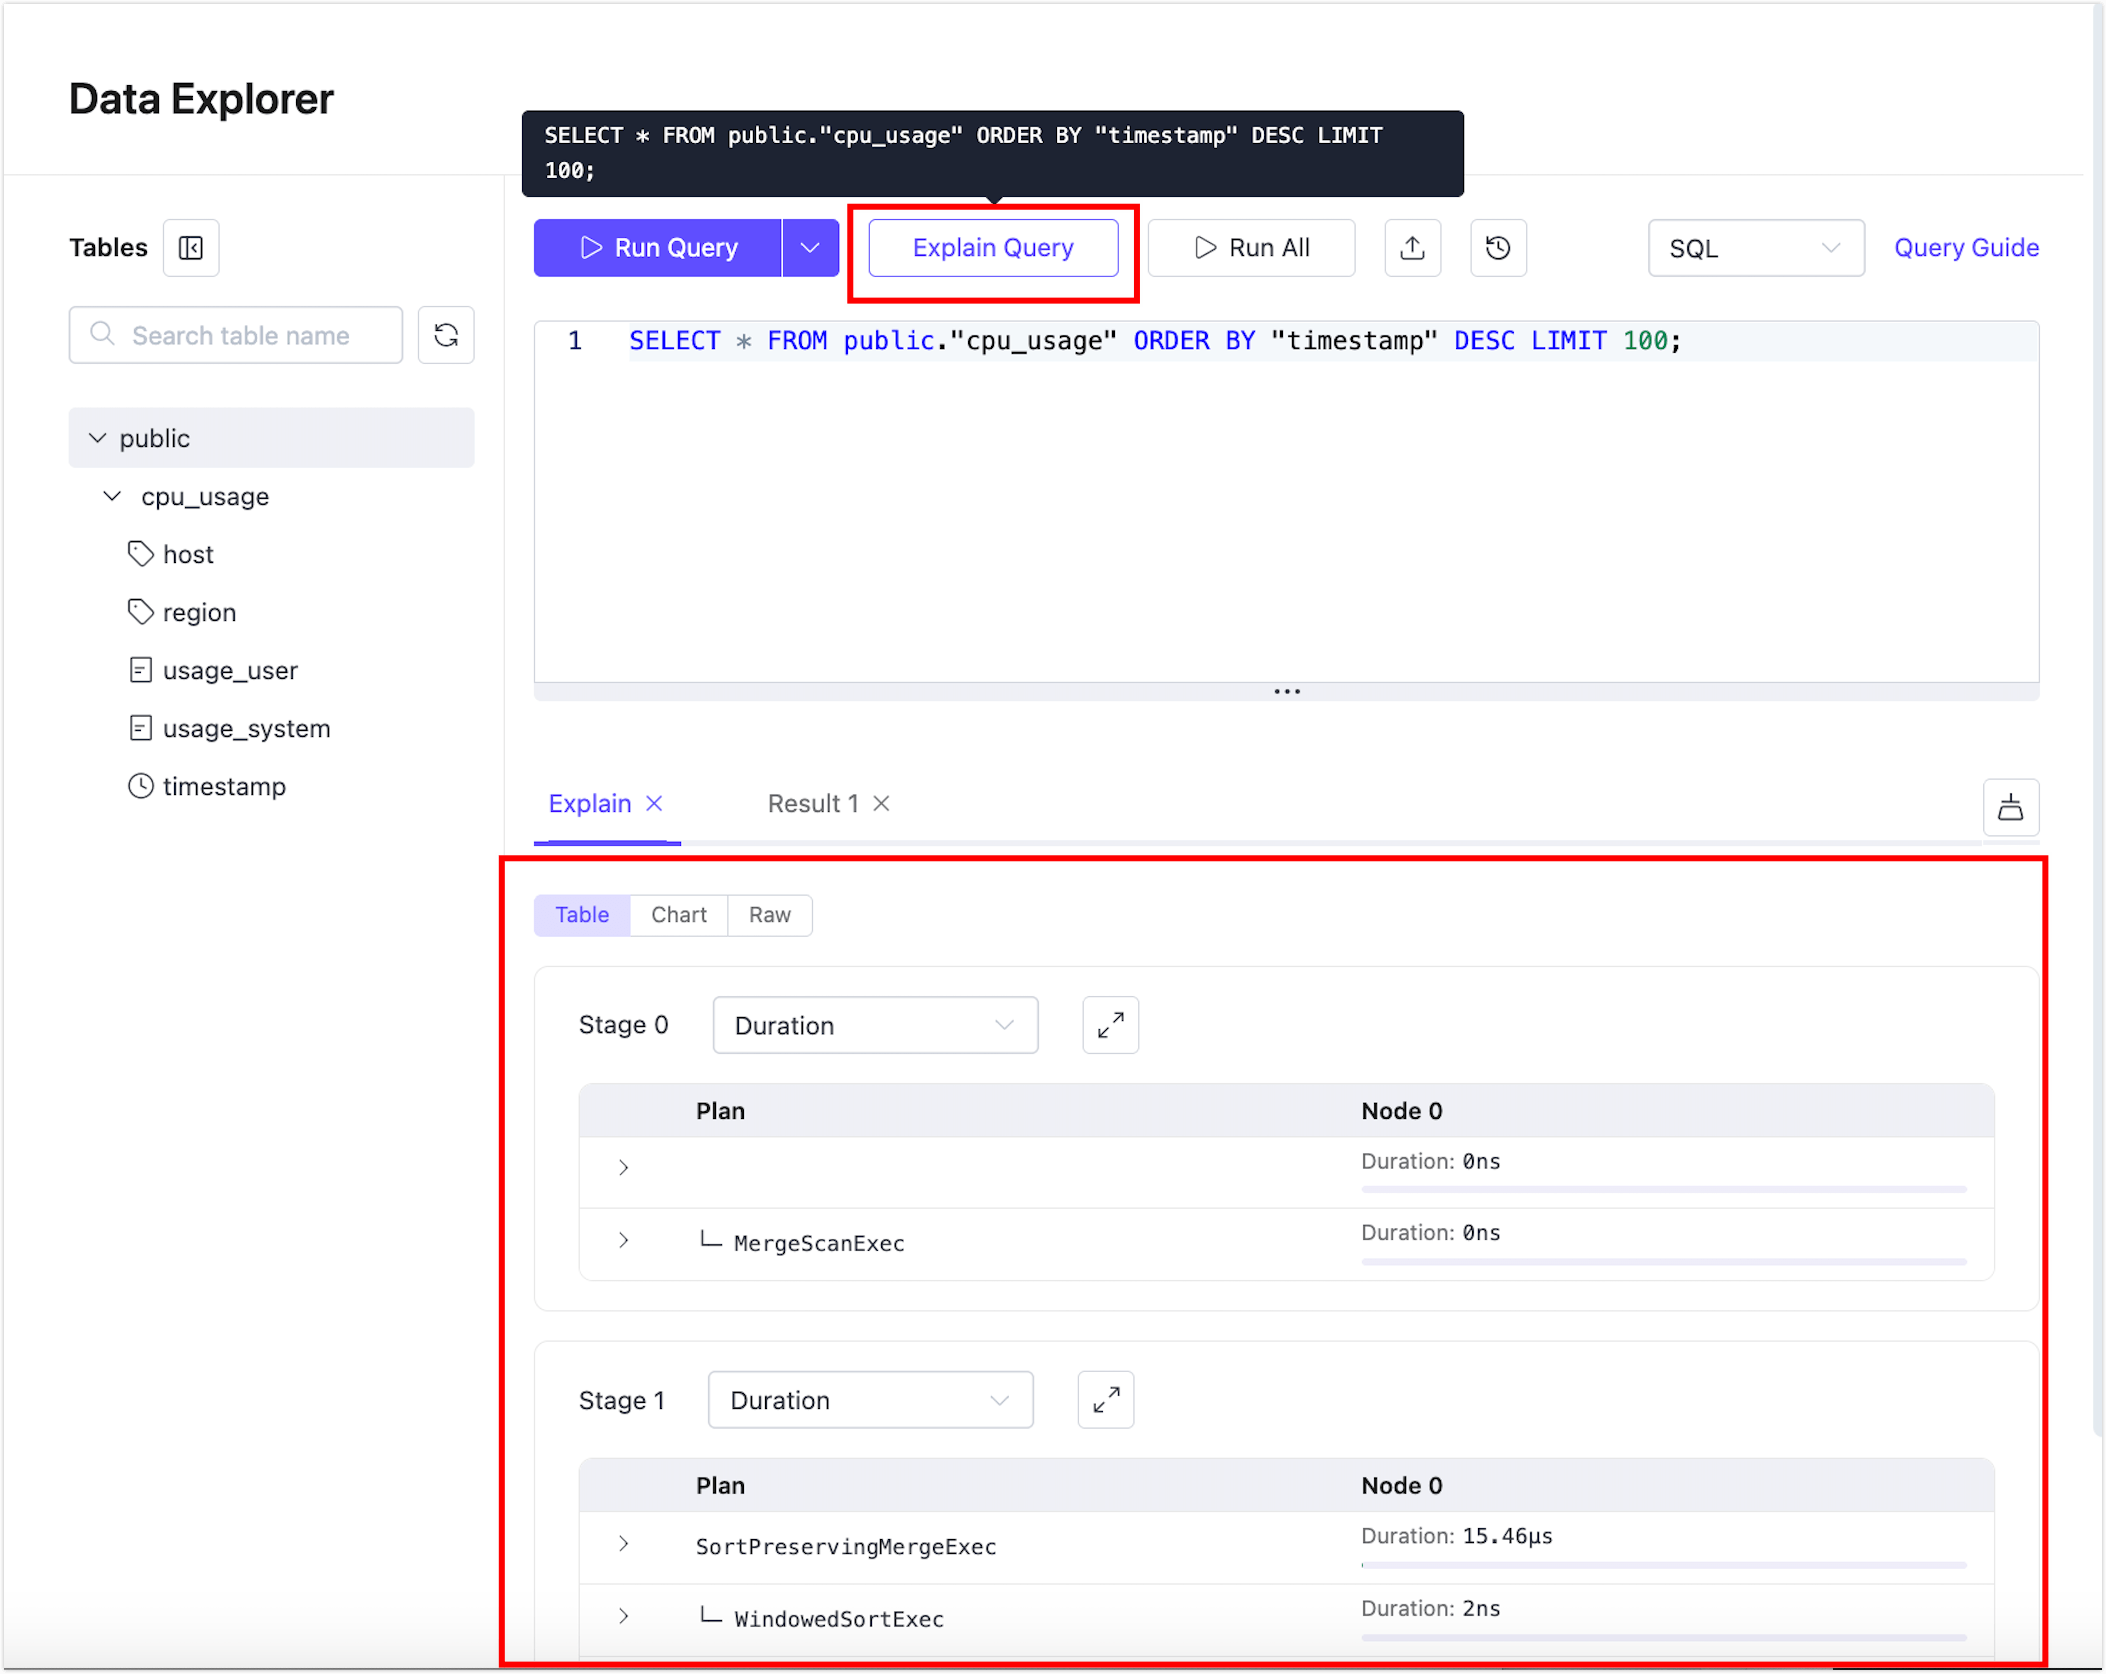
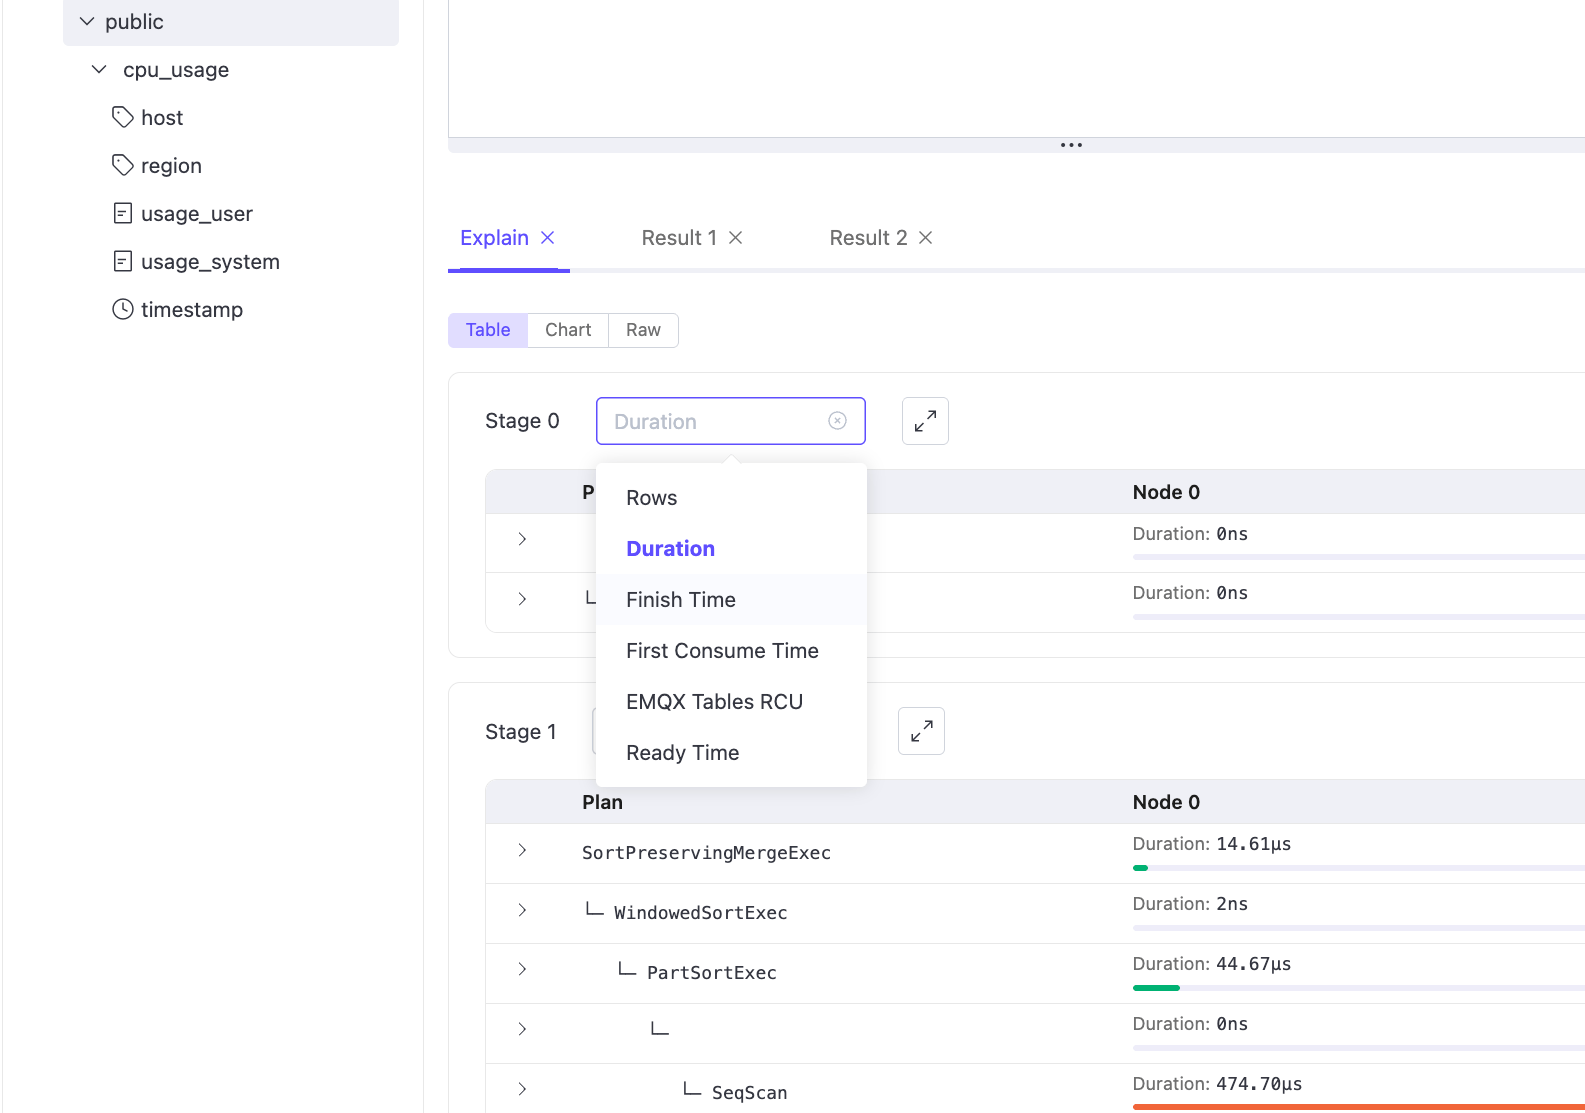
The Select Metric drop-down controls which execution metric is displayed for the selected stage. Changing the selected metric updates the values and visual indicators in the Table view, allowing you to analyze the same execution plan from different performance perspectives.
Note
In clustered deployments, execution details are shown per GreptimeDB node, allowing you to inspect how the query is executed on individual nodes. The node selector is displayed only when the cluster contains more than one node.
All examples shown in this section are based on Explain results from a single-node deployment.
Chart View
The Chart view displays the query execution plan as an interactive graphical tree diagram, providing a visual representation of execution stages and operator relationships.
In Chart view, you can:
- Click individual execution nodes to inspect their details, or directly read the key metrics displayed on each node.
- Verify execution metrics (such as execution time and resource usage) shown on the nodes against the corresponding values in the raw Explain data.
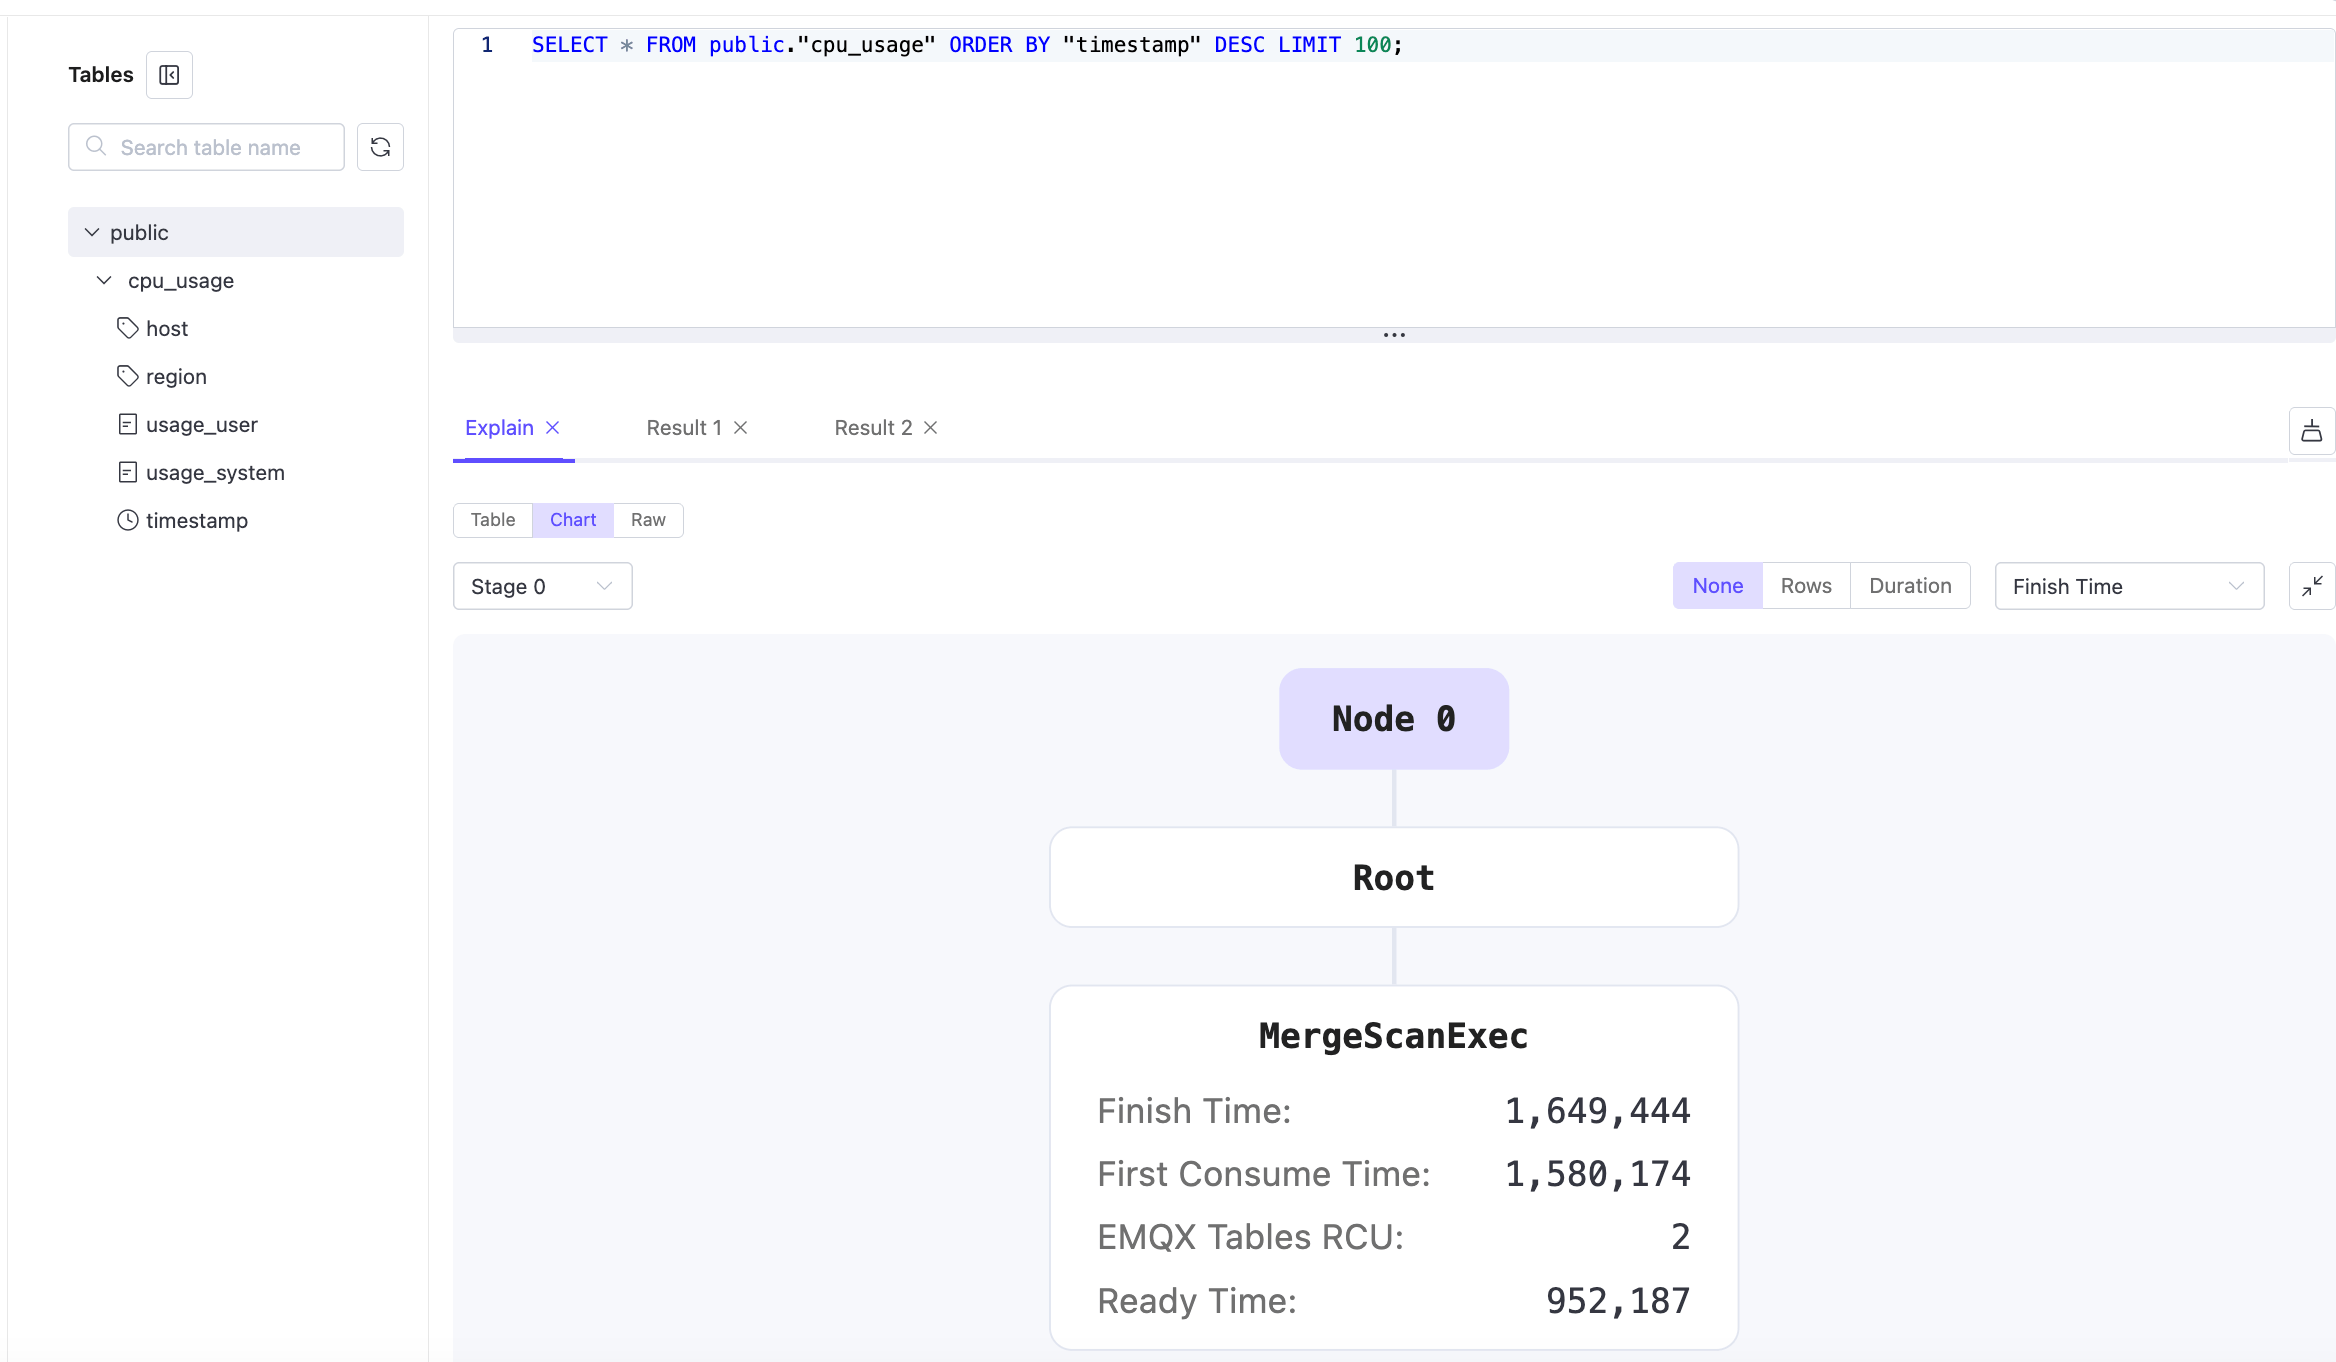
Metric display mode
The control in the top-right corner allows you to switch how metrics are visualized in the chart:
- None: Displays only the execution tree structure without metric-based visualization.
- Rows: Highlights nodes based on the number of rows processed.
- Duration: Highlights nodes based on execution time.
Changing the mode updates both the visual emphasis and the values displayed on each node, allowing you to analyze the execution plan from different perspectives.
The Chart view is handy for visually tracing execution paths, understanding parent–child relationships between operators, and validating performance characteristics at each execution step.
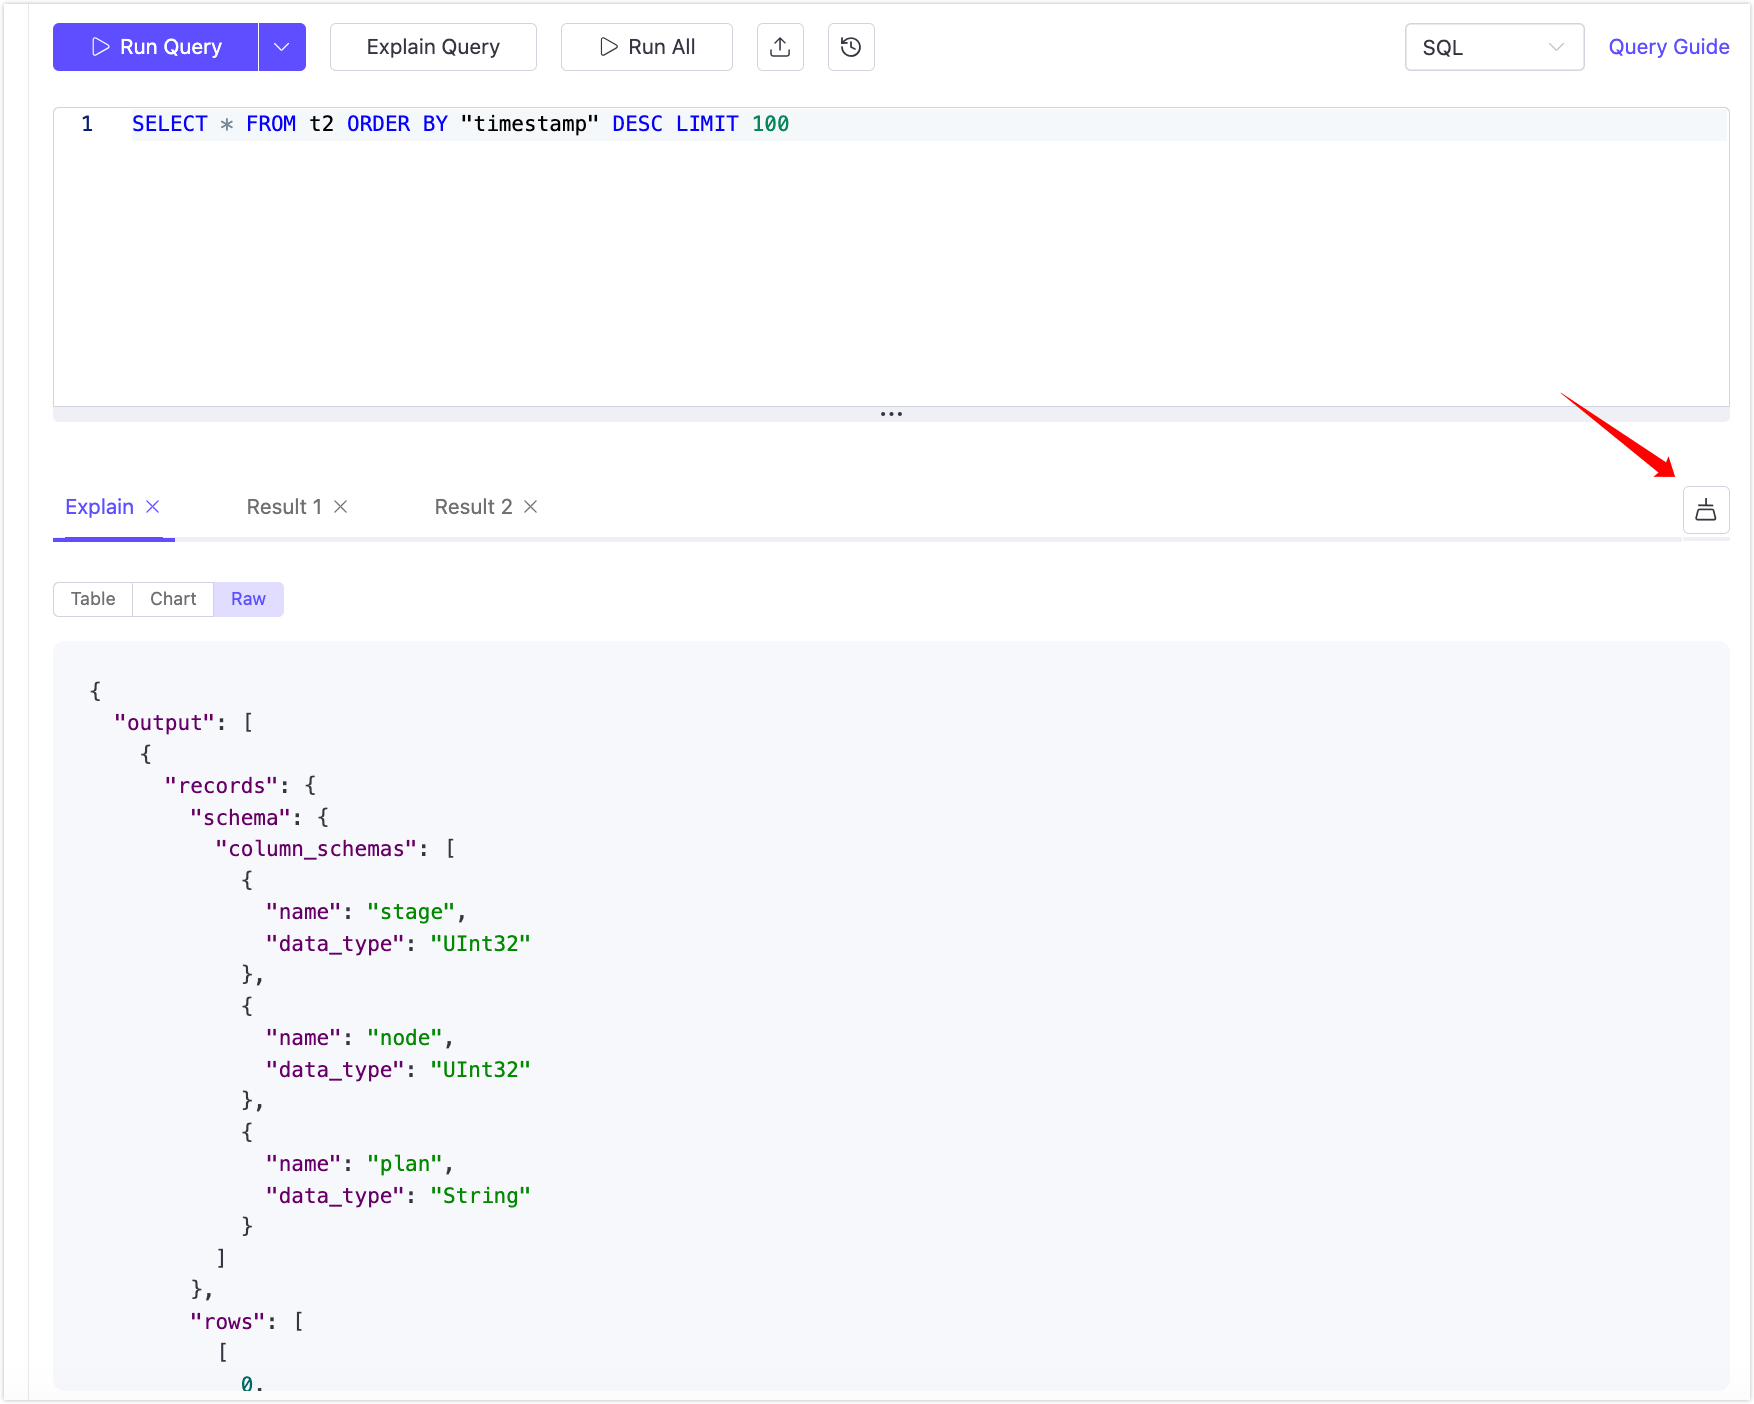
Raw View
Raw API response (JSON) format, which can be copied for further analysis.
Query Results
Each time a query is executed successfully, Data Explorer generates a new query result.
- Each successful query execution generates a new Result tab.
- Tabs are labeled incrementally (e.g.,
Result 1,Result 2) and can be switched freely. - You can close individual tabs using the ✕ icon.
Results are not persisted after leaving the current deployment page.
Result Views
Depending on the query and data shape, results can be displayed in the following formats:
Table view (default): Displays query results in a tabular format with pagination. This view is suitable for inspecting raw records and exact values.
Chart view: Visualizes query results as charts for easier trend analysis and comparison.
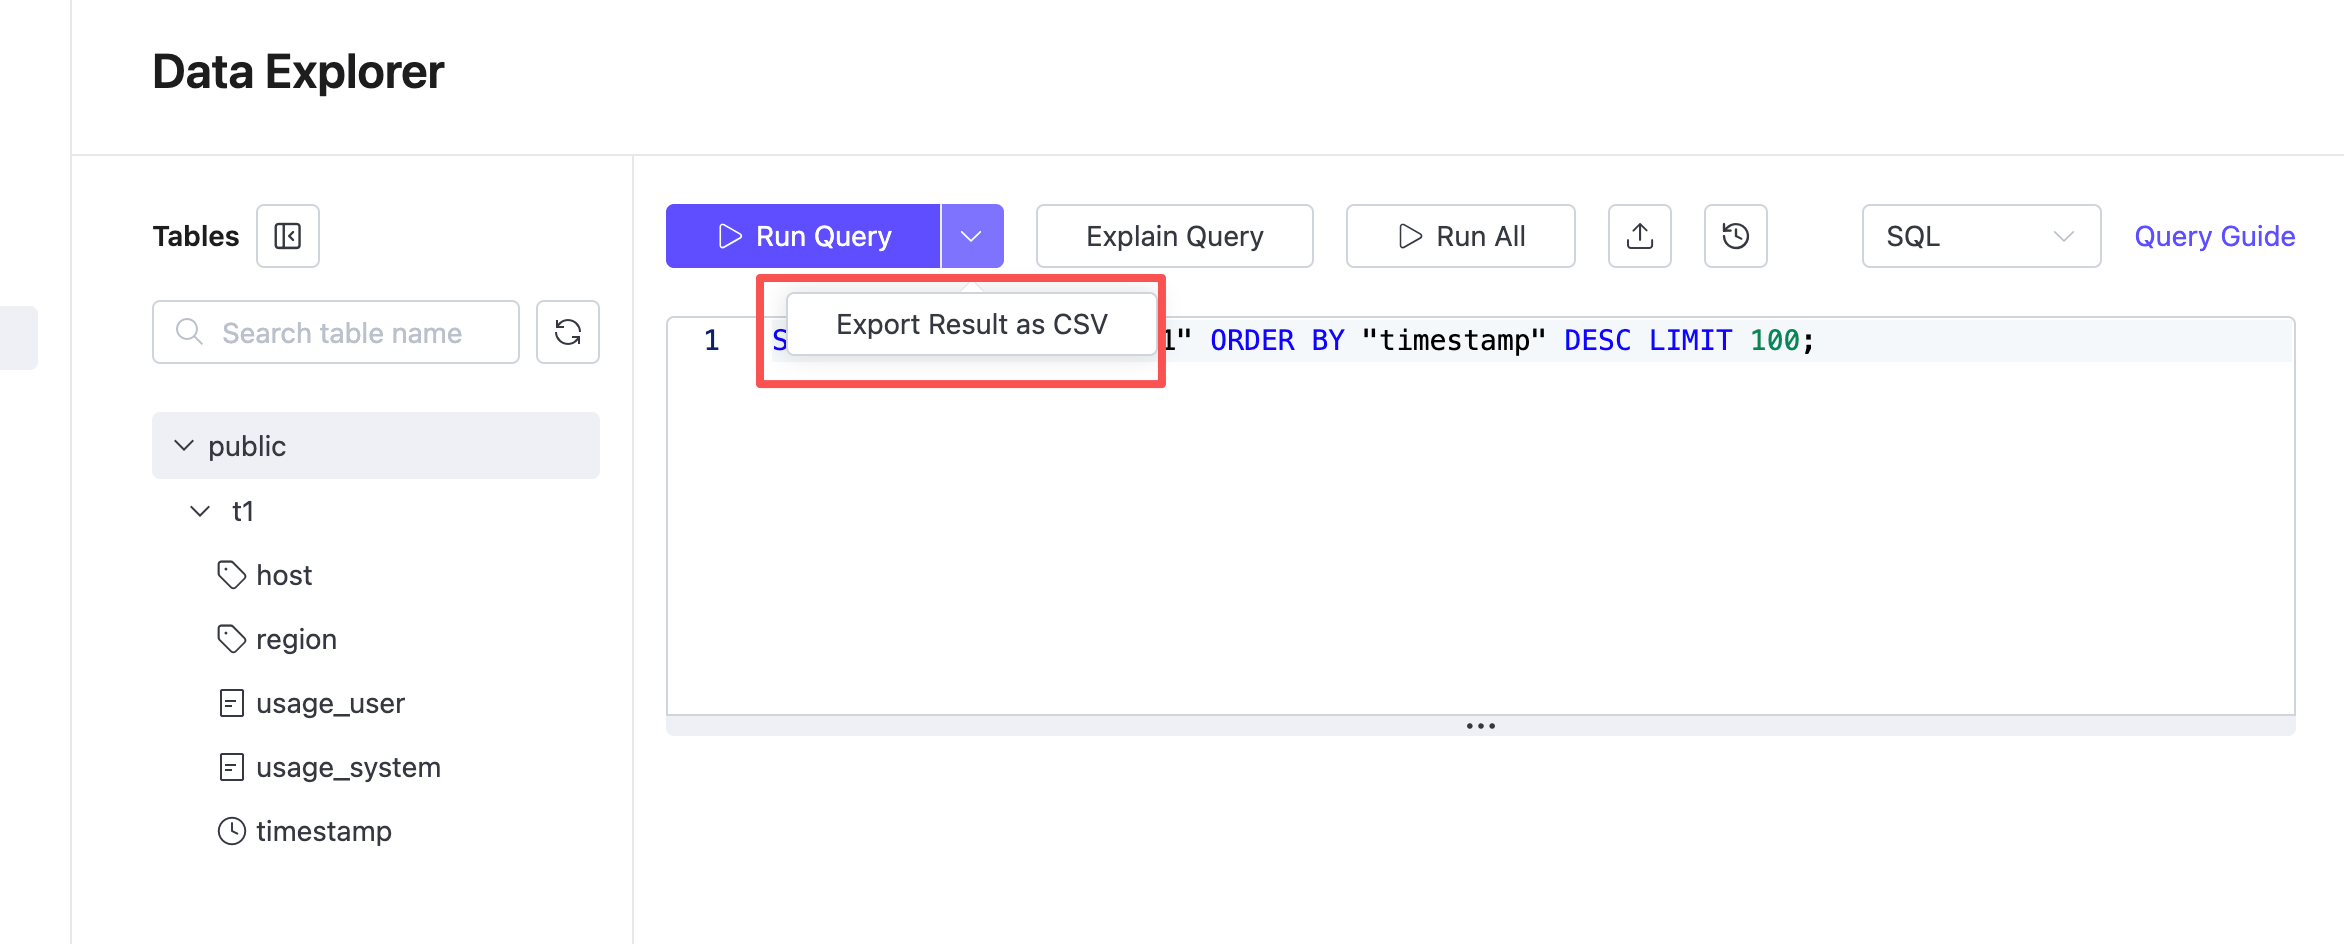
Export Query Results
You can export query results in CSV format directly from the Data Explorer.
- Enter a query statement.
- Click the dropdown arrow next to Run Query.
- Select Export Result as CSV.
- The system runs the query and downloads the result.
Query History
Query History helps you review, reuse, and manage previously executed SQL and PromQL queries within the current deployment.
Automatic History Retention
Query history is recorded automatically according to the following rules:
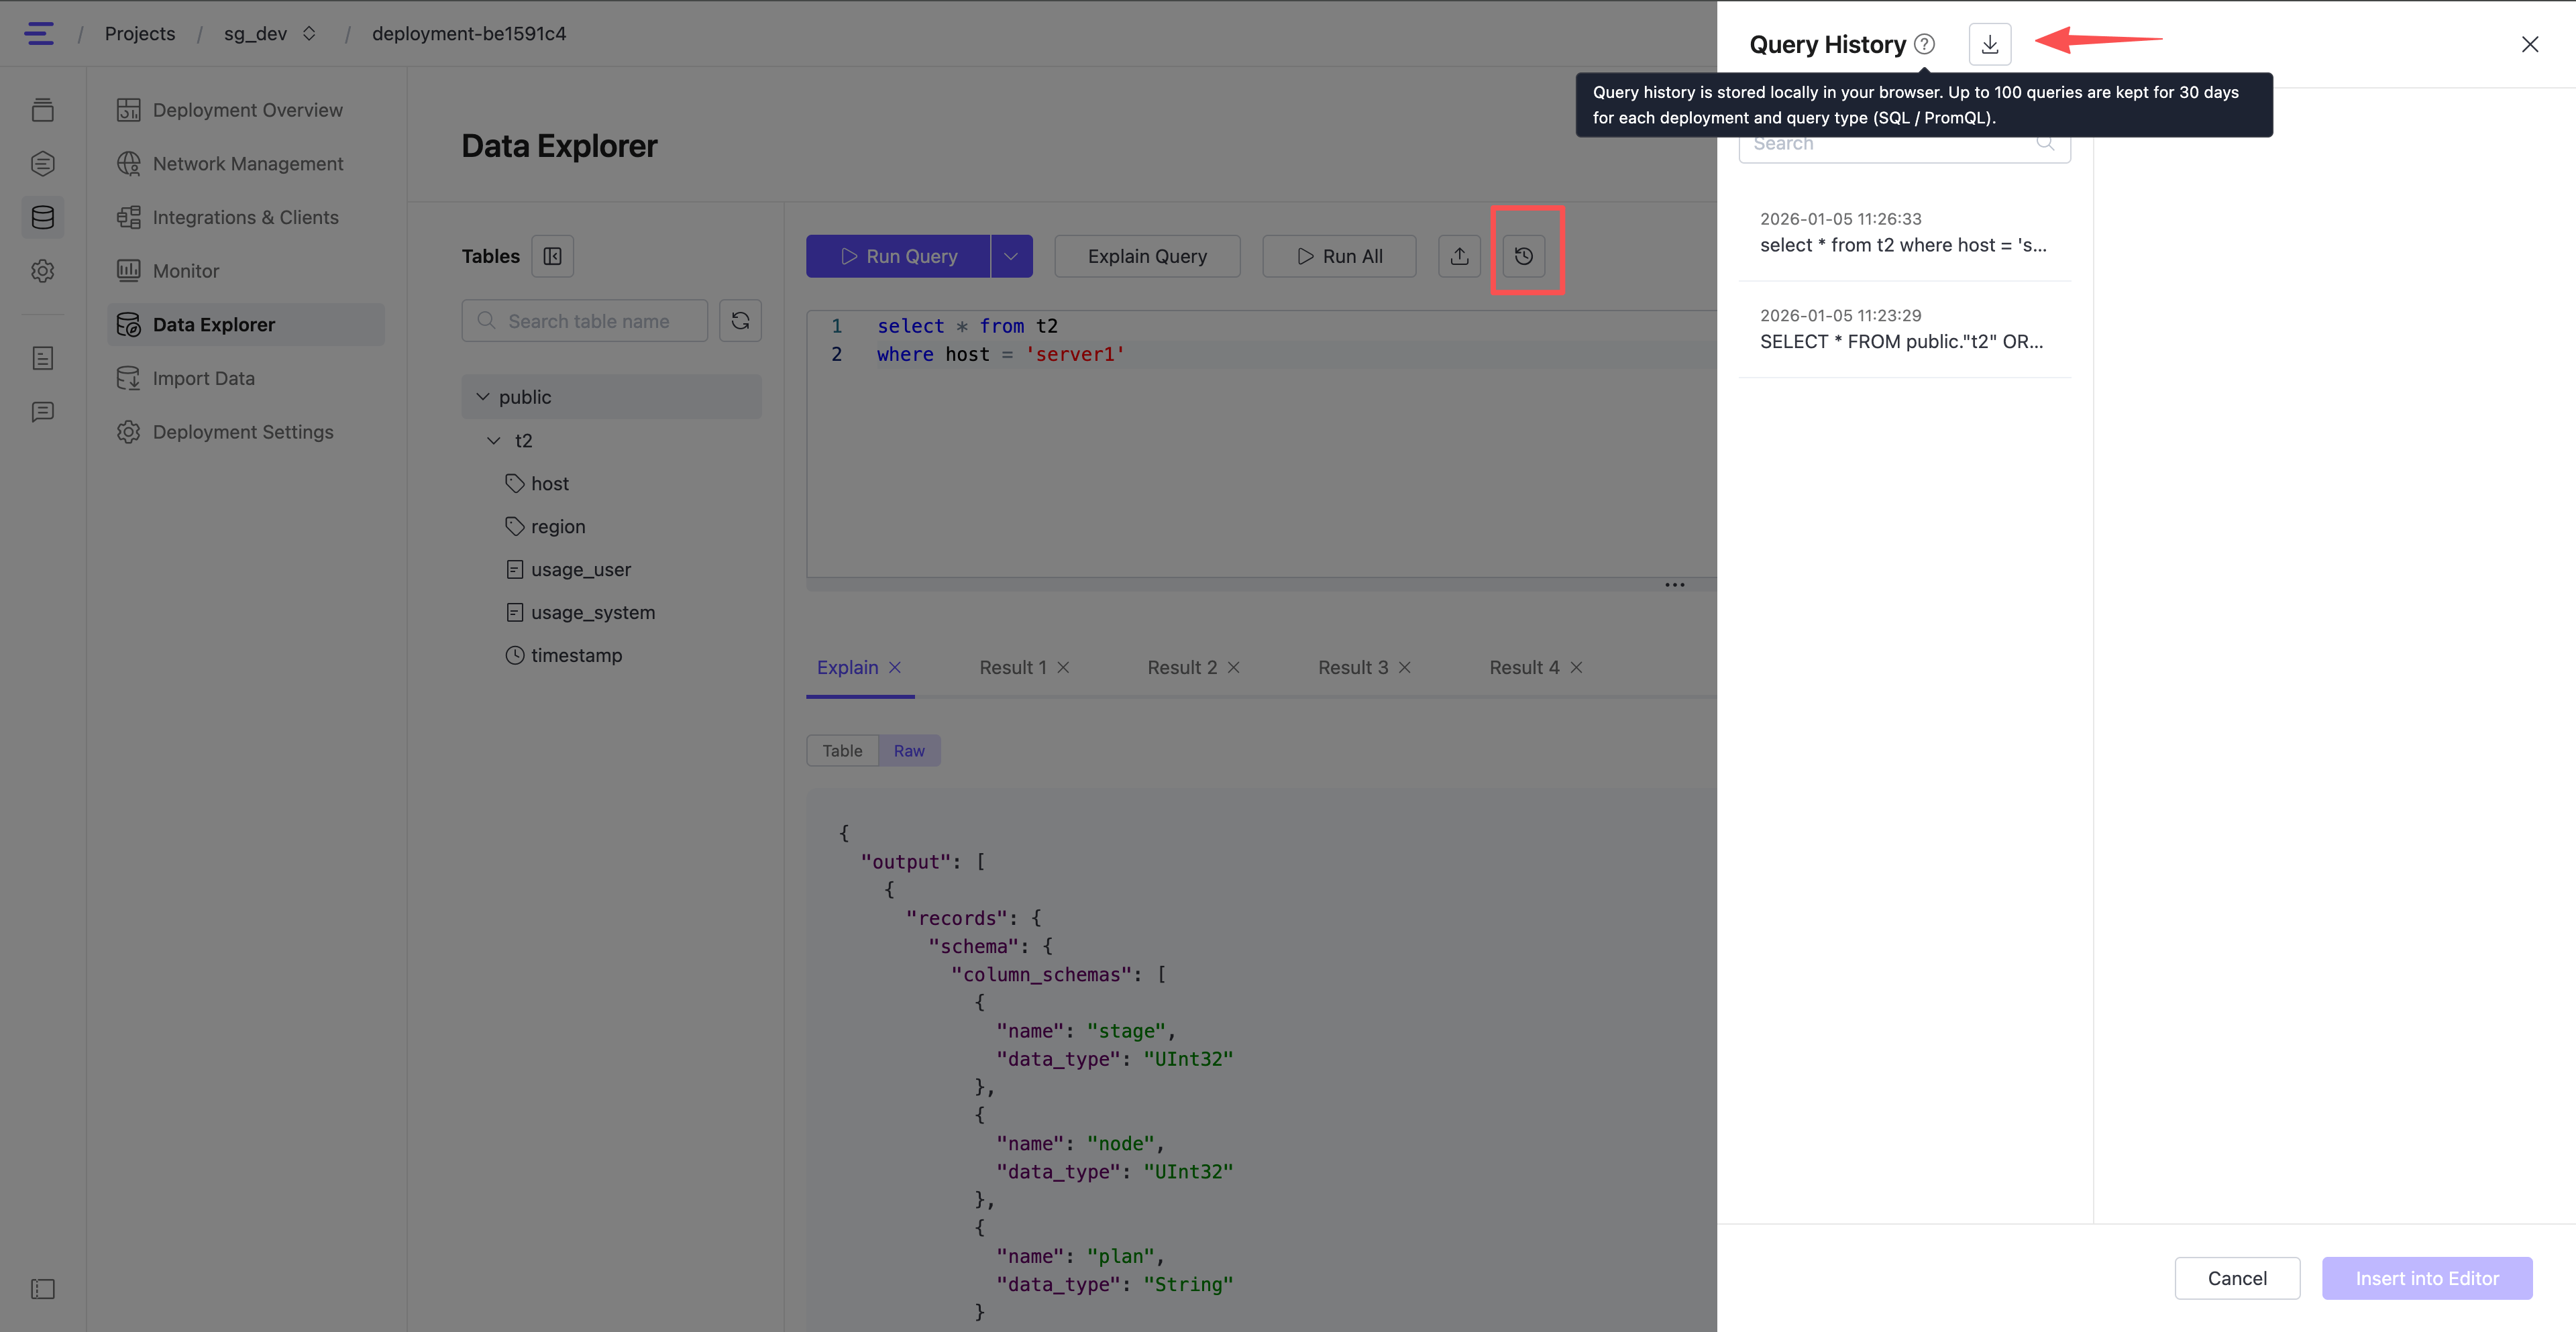
- Query history is stored locally in your browser.
- Records are retained for up to 30 days.
- For each deployment:
- Up to 100 SQL queries.
- Up to 100 PromQL queries.
- When the limit is reached, the oldest records are removed automatically.
- All query history is deleted when the deployment is removed.
Open Query History Panel
Click the History icon in the toolbar to open the Query History panel.
From this panel, you can:
- Filter records by SQL or PromQL.
- Search within query history.
- View the execution time of each query.
- Click a history entry to insert the query back into the editor.
Download Query History
You can download query history records, including filtered search results.
SQL history
- Exported as a
.sqlfile - Statements separated by blank lines
- Each statement ends with a semicolon (
;)
sqlselect * from t2 where host = 'server1'; SELECT * FROM public."t2" ORDER BY "timestamp" DESC LIMIT 100;- Exported as a
PromQL history
- Exported as a
.txtfile - One query per line
textsum(t1) t1- Exported as a
Upload Query History File
You can upload a query history file to quickly reuse or edit existing queries.
- Supported file formats are
.sqland.txt. - After uploading, the file content replaces the current content in the query editor.