Full-Chain MQTT Message Tracing with EMQX Tables: Latency, Delivery, and Acknowledgment Analysis
In an MQTT system, a message passes through several key stages: the publisher sends it, the broker receives and routes it, delivers it to subscribers, and the subscribers acknowledge receipt (ACK). When issues such as message delays, consumer backlogs, ACK timeouts, duplicate consumption, or message loss occur, basic broker monitoring metrics alone are rarely sufficient to pinpoint which segment of the chain is at fault.
In a production environment, an MQTT message may go through:
- Publisher network transmission latency
- Broker receive and internal processing latency
- Broker-to-subscriber delivery latency
- Subscriber ACK return latency
- Abnormal situations such as failed delivery or missing ACK
Beyond traditional broker metric monitoring, a tracing mechanism is needed to correlate and analyze the MQTT message lifecycle.
EMQX Cloud combines event topics, the rule engine, and Tables data integration to capture and correlate key events in the MQTT message lifecycle. This approach records message chain status and timestamps from the moment of publication, through broker delivery, to subscriber ACK confirmation.
This guide explains how to use EMQX Cloud and Tables to build a full-chain MQTT message observability system with the following capabilities:
- Analyze publish, delivery, and ACK confirmation chains
- Correlate
message.publish,message.delivered, andmessage.ackedevents - Measure per-stage latency across Publisher, Broker, and Subscriber
- Detect missing ACKs, incomplete chains, and potential message drops
- Verify that messages were successfully delivered to subscribers
- Use SQL to aggregate and analyze the message lifecycle for fault analysis
Prerequisites
Before starting, ensure the following conditions are met:
- An EMQX v5 deployment is created and accessible.
- Tables is deployed and accessible.
- System clocks on the publisher and subscriber are synchronized.
- The publisher includes a
publish_attimestamp in the payload of each MQTT message. - QoS 1 or QoS 2 is used to enable capture of acknowledgment events.
- Timestamps are handled in a consistent timezone across clients and the database. UTC is recommended.
Timestamp Definitions
The tracing model uses the following timestamps:
publish_at: The client-side timestamp written into the MQTT payload by the publisher.publish_received_at: The time when EMQX receives the PUBLISH packet.message_delivered: The time when EMQX delivers the message to the subscriber side.message_acked: The time when EMQX receives the acknowledgment (ACK) from the subscriber.
These timestamps are used to calculate the latency at each stage of the transmission path.
Set Up the Tables Table
Create a table to store message trace records. Each message stage is stored as a separate row, enabling later correlation queries using msg_id.
CREATE TABLE mqtt_message_traces (
    "timestamp" TIMESTAMP NOT NULL,
    event_name STRING NOT NULL,
    msg_id STRING NOT NULL,
    trace_key STRING NOT NULL,
    publish_at BIGINT,
    emqx_received_at BIGINT,
    emqx_delivered_at BIGINT,
    sub_ack_at BIGINT,
    pub_clientid STRING,
    sub_clientid STRING,
    topic STRING NOT NULL,
    qos INT NOT NULL,
    msg BIGINT,
    TIME INDEX ("timestamp"),
    PRIMARY KEY (trace_key)
)
WITH (
    ttl = '30d'
);
Configure Tables Data Integration in EMQX Cloud
The traceability workflow uses three rules and three write actions. All three actions write to the same table, but each captures a different stage of the message lifecycle.
All three rules use the same correlation key:
id as msg_idThe same msg_id is used to correlate the following three events:
message.publishmessage.deliveredmessage.acked
Configure the Publish Trace Rule
The first rule records publish-stage data. It listens on a wildcard topic and captures regular messages on all business topics.
Rule SQL:
SELECT
  timestamp,
  event,
  id as msg_id,
  concat(id, '_publish') as trace_key,
  int(payload.publish_at) as publish_at,
  int(publish_received_at) as emqx_received_at,
  clientid as pub_clientid,
  topic,
  qos,
  int(payload.msg) as msg
FROM "#"
Action SQL:
mqtt_message_traces,event_name=${event},msg_id=${msg_id},trace_key=${trace_key},topic=${topic},pub_clientid=${pub_clientid} publish_at=${publish_at}i,emqx_received_at=${emqx_received_at}i,qos=${qos}i,msg=${msg}i ${timestamp}When the publisher sends a message to a business topic (for example, emqx/test), this rule writes a publish trace record to Tables.
Configure the Delivered Trace Rule
The second rule records the timestamp when EMQX delivers the message to the subscriber path.
Rule SQL:
SELECT
  timestamp,
  event,
  id as msg_id,
  concat(id, '_delivered') as trace_key,
  int(timestamp) as emqx_delivered_at,
  from_clientid as pub_clientid,
  clientid as sub_clientid,
  topic,
  qos,
  int(payload.msg) as msg
FROM "$events/message_delivered"
Action SQL:
mqtt_message_traces,event_name=${event},msg_id=${msg_id},trace_key=${trace_key},topic=${topic},pub_clientid=${pub_clientid},sub_clientid=${sub_clientid} emqx_delivered_at=${emqx_delivered_at}i,qos=${qos}i,msg=${msg}i ${timestamp}This record is used to calculate broker-side processing latency and broker-to-subscriber latency.
Configure the Acked Trace Rule
The third rule records acknowledgment-stage data. This rule only fires when an acknowledgment event exists, so QoS 1 or QoS 2 is required.
Rule SQL:
SELECT
  timestamp,
  event,
  id as msg_id,
  concat(id, '_acked') as trace_key,
  int(timestamp) as sub_ack_at,
  from_clientid as pub_clientid,
  clientid as sub_clientid,
  topic,
  qos,
  int(payload.msg) as msg
FROM "$events/message_acked"
Action SQL:
mqtt_message_traces,event_name=${event},msg_id=${msg_id},trace_key=${trace_key},topic=${topic},pub_clientid=${pub_clientid},sub_clientid=${sub_clientid} sub_ack_at=${sub_ack_at}i,qos=${qos}i,msg=${msg}i ${timestamp}This record is used to calculate subscriber-side acknowledgment latency and end-to-end total latency.
Connector Configuration Notes
From a logical design perspective, all three actions can share a single Tables connector.
However, during sustained load testing on EMQX 5, sharing a single connector was found to be unstable. The observable symptom is that one action accumulates write failures, reducing the number of complete samples available for correlation queries.
For stable operation, the recommended configuration is:
- A dedicated connector for the publish trace action
- A dedicated connector for the delivered trace action
- A dedicated connector for the acked trace action
This is an implementation-level stability choice and does not affect the table schema, rule SQL, action SQL, correlation logic, or latency calculation formulas.
Use Python SDK to Simulate Message Delivery
This section describes the publisher and subscriber behavior used for validation.
The publisher sends MQTT messages to a business topic (for example, emqx/test), with each payload containing a publish_at timestamp. The subscriber listens on the same topic and remains online throughout the message flow.
Install the Python dependency:
python3 -m venv .venv && source .venv/bin/activate
pip install paho-mqtt
Publisher
The publisher needs to:
- Connect to EMQX
- Publish messages to the target topic
- Use QoS 1
- Include a
publish_atfield in each message payload
Example payload:
{"publish_at":1773579492999,"msg":10000}The following publisher script supports both fixed-interval sending and duration-based load testing at a specified TPS, suitable for both functional verification and sustained load testing.
#!/usr/bin/env python3
import argparse, json, random, time
from paho.mqtt import client as mqtt_client
parser = argparse.ArgumentParser()
parser.add_argument("--host", default="127.0.0.1")
parser.add_argument("--port", type=int, default=1883)
parser.add_argument("--topic", default="emqx/test")
parser.add_argument("--qos", type=int, default=1)
parser.add_argument("--count", type=int, default=20)
parser.add_argument("--interval-sec", type=float, default=1.0)
parser.add_argument("--tps", type=float)
parser.add_argument("--duration-sec", type=float)
parser.add_argument("--hold-sec", type=float, default=0.0)
parser.add_argument("--username", default=None)
parser.add_argument("--password", default=None)
args = parser.parse_args()
def on_connect(client, userdata, flags, reason_code, properties):
    if reason_code != 0:
        raise RuntimeError(f"connect failed: {reason_code}")
client = mqtt_client.Client(
    mqtt_client.CallbackAPIVersion.VERSION2,
    client_id=f"python-mqtt-pub-{random.randint(0, 100000)}",
)
client.on_connect = on_connect
if args.username:
    client.username_pw_set(args.username, args.password)
client.connect(args.host, args.port)
client.loop_start()
count = 0
start = time.perf_counter()
if args.tps and args.duration_sec:
    interval = 1.0 / args.tps
    deadline = start + args.duration_sec
    next_send = start
    keep_sending = lambda now, sent: now < deadline
else:
    interval = args.interval_sec
    next_send = start + interval
    keep_sending = lambda now, sent: sent < args.count
while keep_sending(time.perf_counter(), count):
    now = time.perf_counter()
    if now < next_send:
        time.sleep(next_send - now)
    payload = json.dumps({"publish_at": int(time.time() * 1000), "msg": count}, separators=(",", ":"))
    result = client.publish(args.topic, payload, qos=args.qos)
    if result.rc != 0:
        raise RuntimeError(f"publish failed: {result.rc}")
    count += 1
    next_send += interval
publish_elapsed = time.perf_counter() - start
if args.hold_sec > 0:
    time.sleep(args.hold_sec)
total_elapsed = time.perf_counter() - start
print(json.dumps({
    "topic": args.topic,
    "sent": count,
    "publish_duration_sec": round(publish_elapsed, 3),
    "total_duration_sec": round(total_elapsed, 3),
    "hold_sec": args.hold_sec,
    "target_tps": args.tps,
    "actual_tps": round(count / publish_elapsed, 3) if publish_elapsed else 0.0,
}))
client.disconnect()
client.loop_stop()
Example run:
python3 publisher.py \
  --host XXXX.ala.dedicated.aws.mqttce.net \
  --port 1883 \
  --topic emqx/test \
  --qos 1 \
  --tps 1 \
  --duration-sec 5 \
  --hold-sec 5 \
  --username xxx \
  --password xxx
Example output:
{"topic": "emqx/test", "sent": 6, "publish_duration_sec": 5.002, "total_duration_sec": 10.007, "hold_sec": 5.0, "target_tps": 1.0, "actual_tps": 1.2}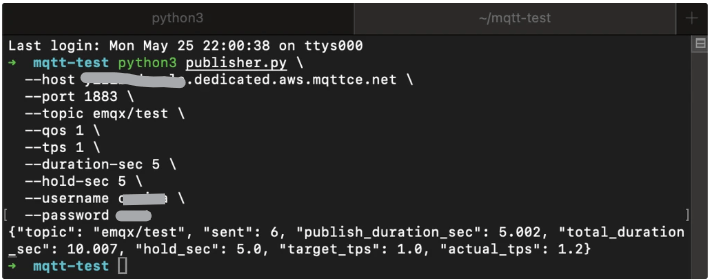
Subscriber
The subscriber needs to:
- Connect to EMQX
- Subscribe to the same business topic
- Use QoS 1
- Remain connected longer than the publish phase
#!/usr/bin/env python3
import argparse, json, random, time
from paho.mqtt import client as mqtt_client
parser = argparse.ArgumentParser()
parser.add_argument("--host", default="127.0.0.1")
parser.add_argument("--port", type=int, default=1883)
parser.add_argument("--topic", default="emqx/test")
parser.add_argument("--qos", type=int, default=1)
parser.add_argument("--duration-sec", type=float)
parser.add_argument("--username", default=None)
parser.add_argument("--password", default=None)
args = parser.parse_args()
counter = {"received": 0}
def on_connect(client, userdata, flags, reason_code, properties):
    if reason_code != 0:
        raise RuntimeError(f"connect failed: {reason_code}")
    client.subscribe(args.topic, qos=args.qos)
def on_message(client, userdata, msg):
    counter["received"] += 1
client = mqtt_client.Client(
    mqtt_client.CallbackAPIVersion.VERSION2,
    client_id=f"python-mqtt-sub-{random.randint(0, 100000)}",
)
client.on_connect = on_connect
client.on_message = on_message
if args.username:
    client.username_pw_set(args.username, args.password)
client.connect(args.host, args.port)
client.loop_start()
start = time.perf_counter()
while args.duration_sec is None or time.perf_counter() - start < args.duration_sec:
    time.sleep(1)
elapsed = time.perf_counter() - start
print(json.dumps({
    "topic": args.topic,
    "received": counter["received"],
    "duration_sec": round(elapsed, 3),
    "recv_tps": round(counter["received"] / elapsed, 3) if elapsed else 0.0,
}))
client.disconnect()
client.loop_stop()
Start the subscriber first:
python3 subscriber.py \
  --host xxxx.dedicated.aws.mqttce.net \
  --port 1883 \
  --topic emqx/test \
  --qos 1 \
  --username xxx \
  --password xxx
Recommended Run Order
Use two terminals:
- Start the subscriber first.
- Then start the publisher.
- Wait for both commands to complete.
- Query EMQX Tables after message delivery is complete.
View Message Latency
Once the publisher, subscriber, rules, and Tables actions are all running, use SQL to validate the trace records and calculate latency.
How to Calculate Latency
Latency formulas for each stage:
- Publisher to EMQX:
publish_received_at - publish_at - EMQX processing:
message_delivered - publish_received_at - EMQX to subscriber:
message_acked - message_delivered - End-to-end total:
message_acked - publish_at
TIP
- If a message lacks a
publish_attimestamp, publisher-to-broker latency cannot be calculated. - With QoS 0,
message_ackedevents are not generated, so subscriber-side latency cannot be calculated.
Query Examples
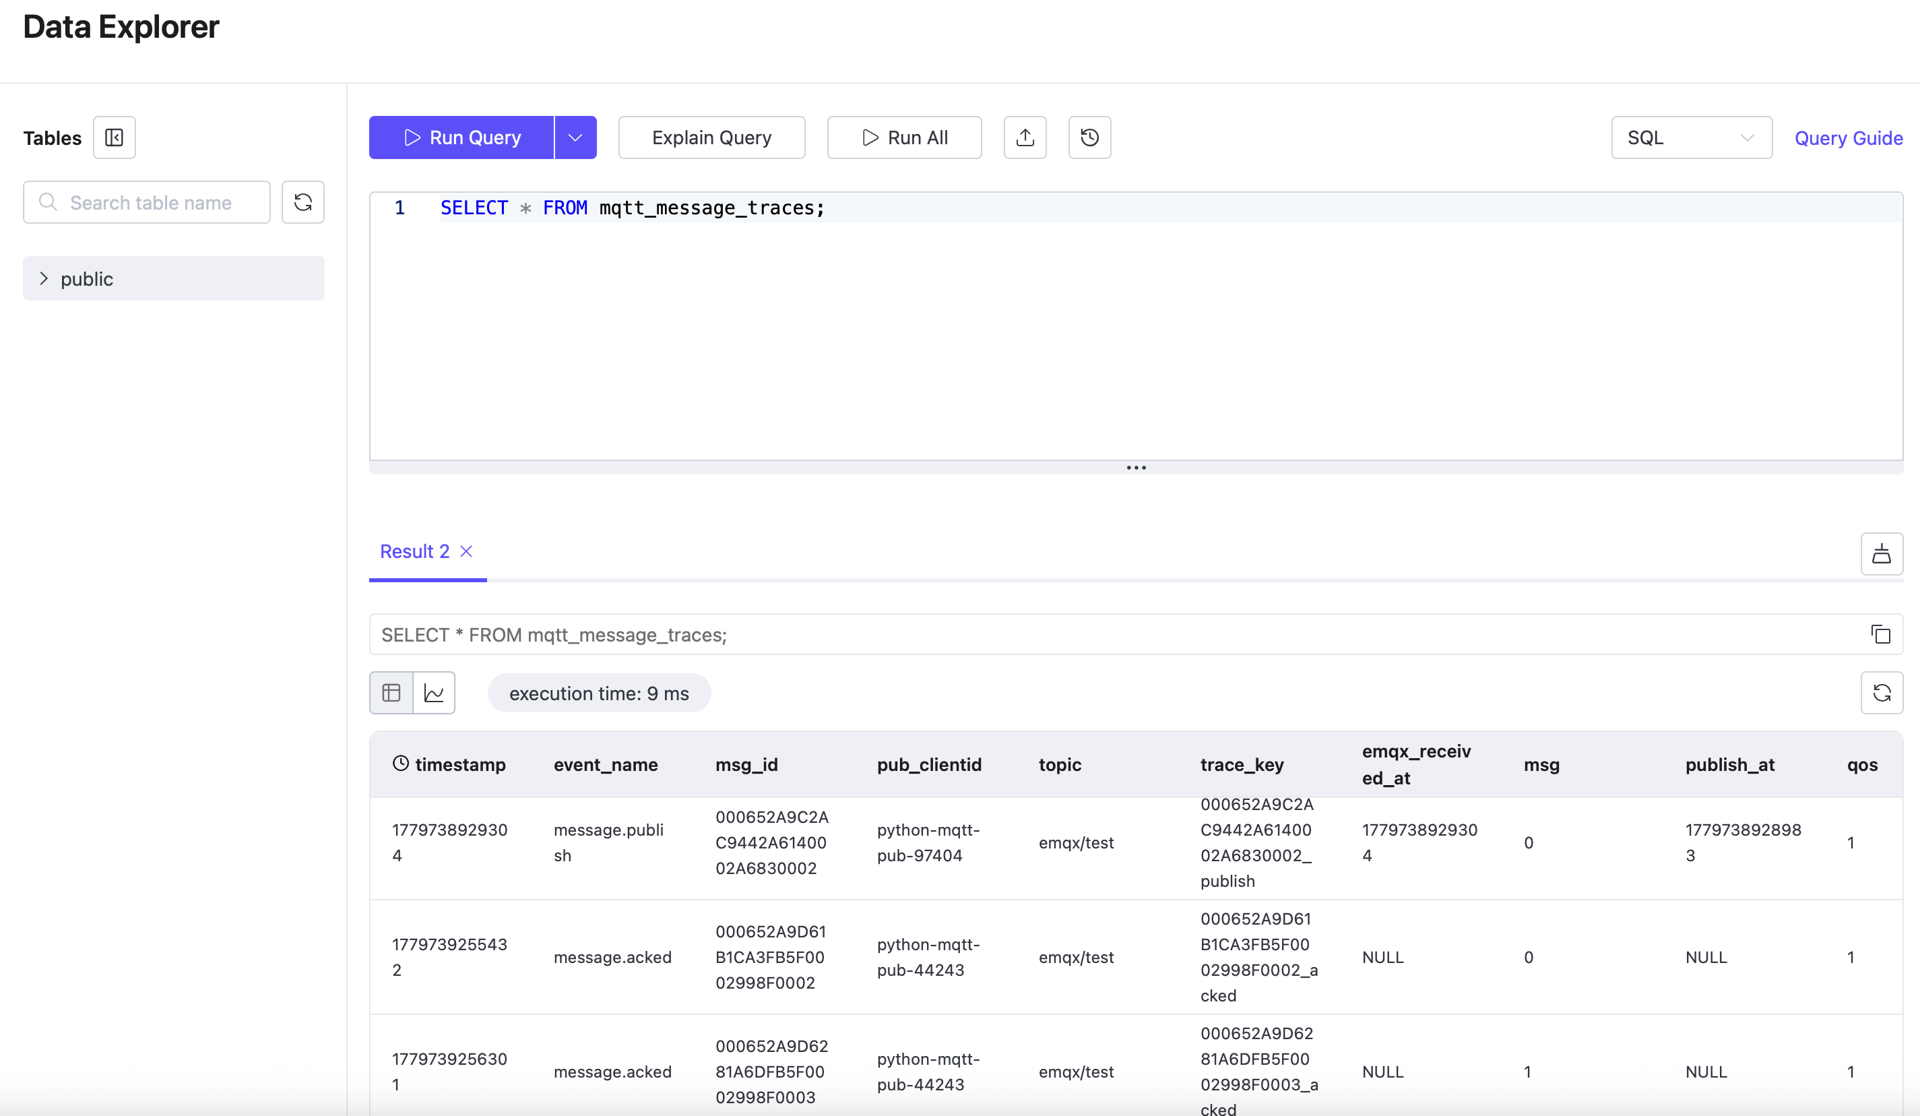
1. Count All Trace Records
SELECT COUNT(*) AS total_rows
FROM mqtt_message_traces;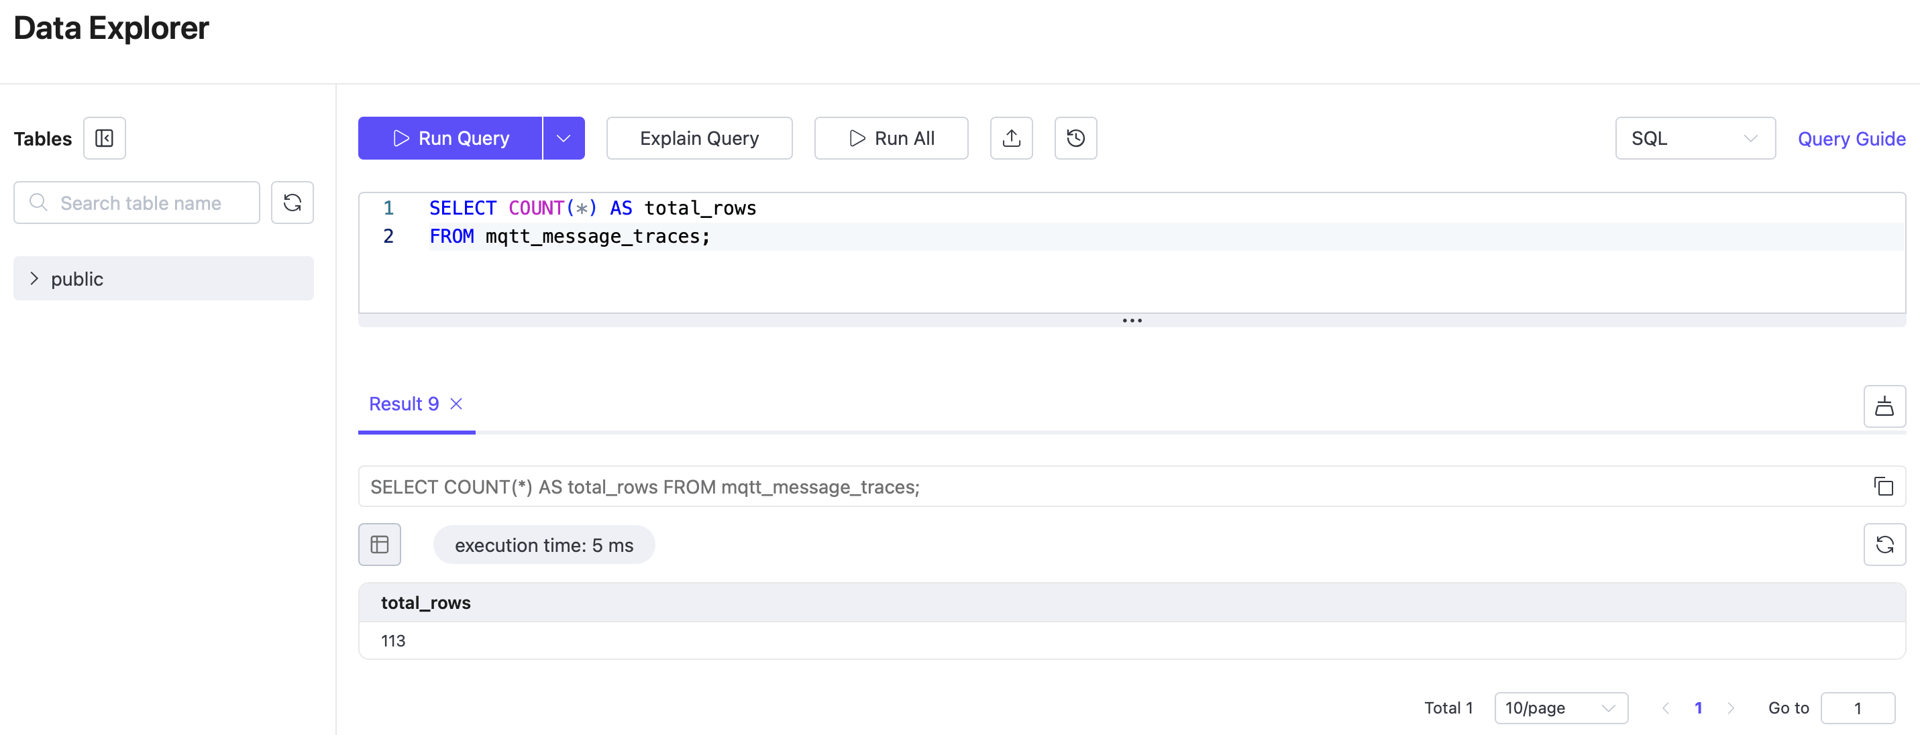
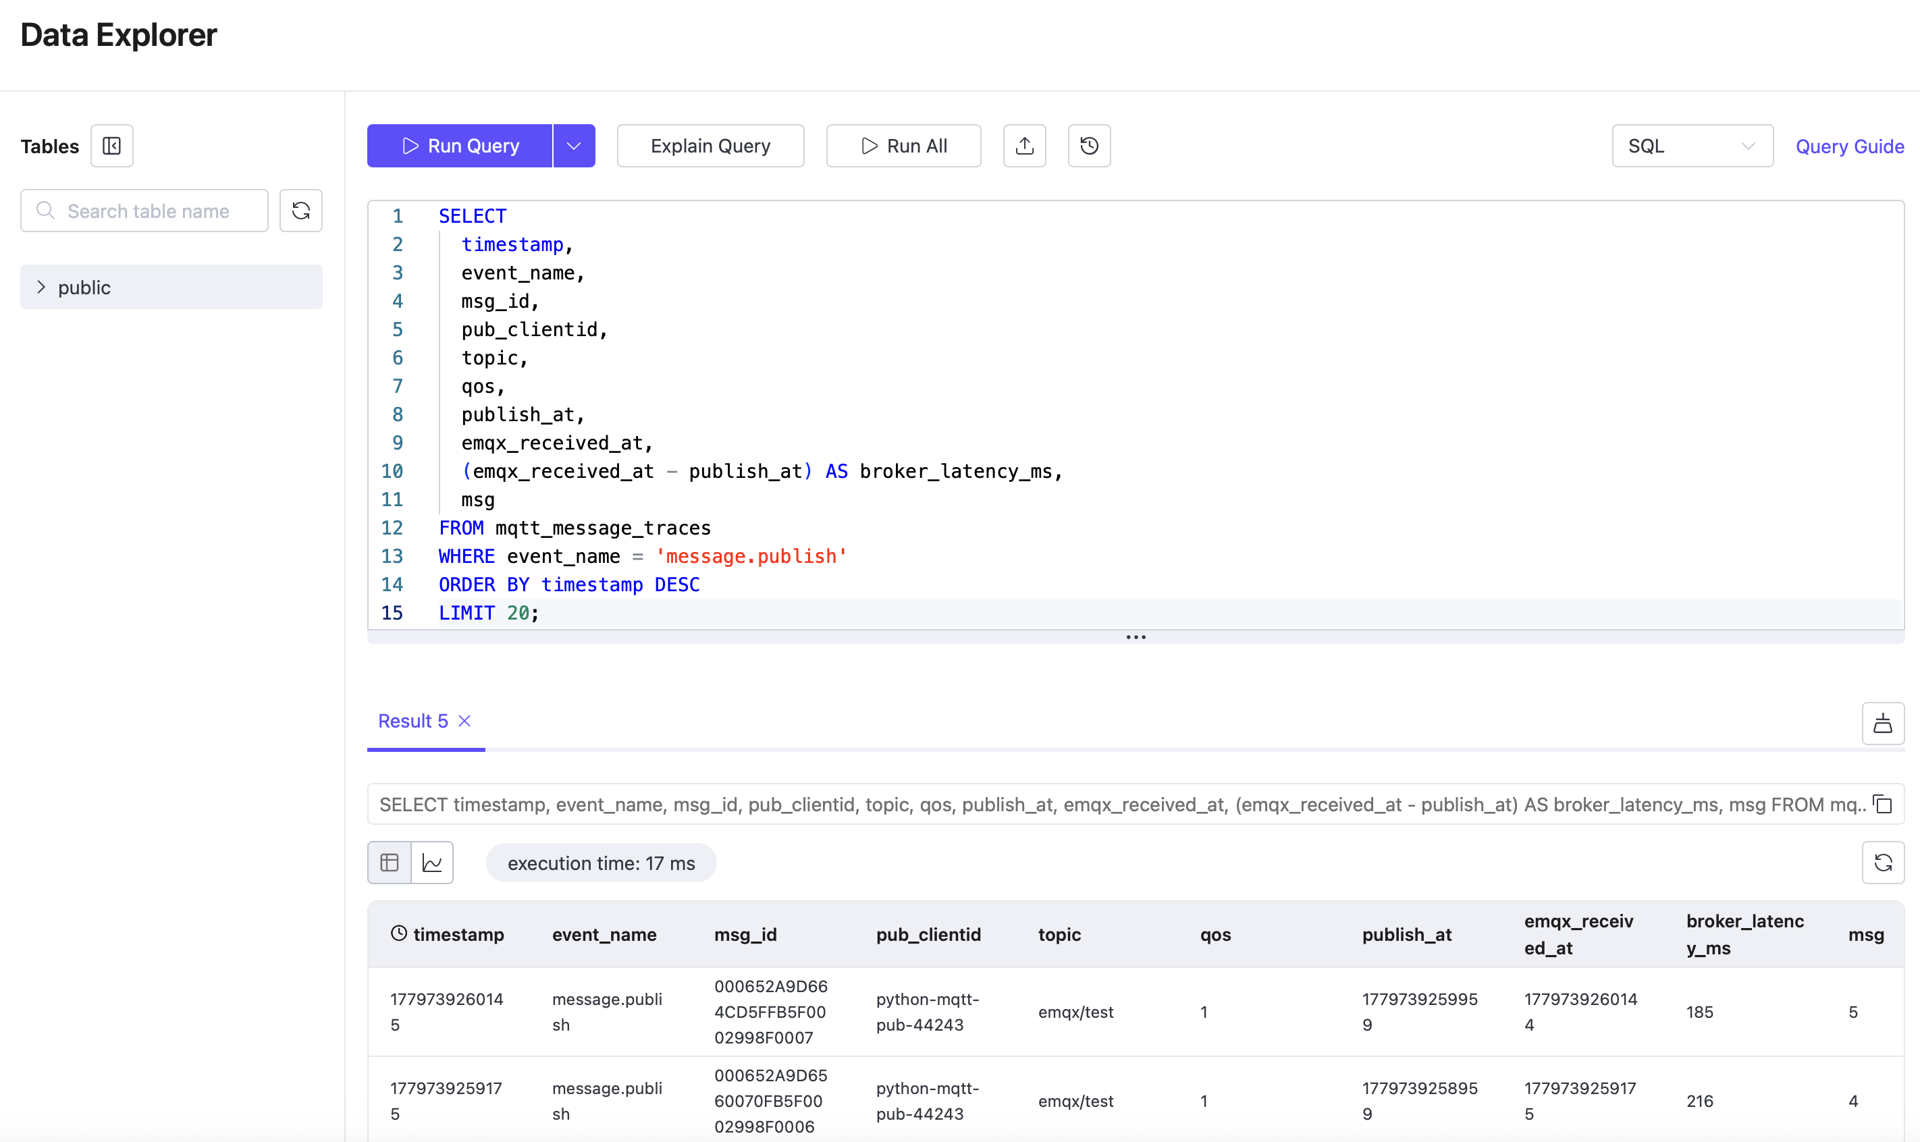
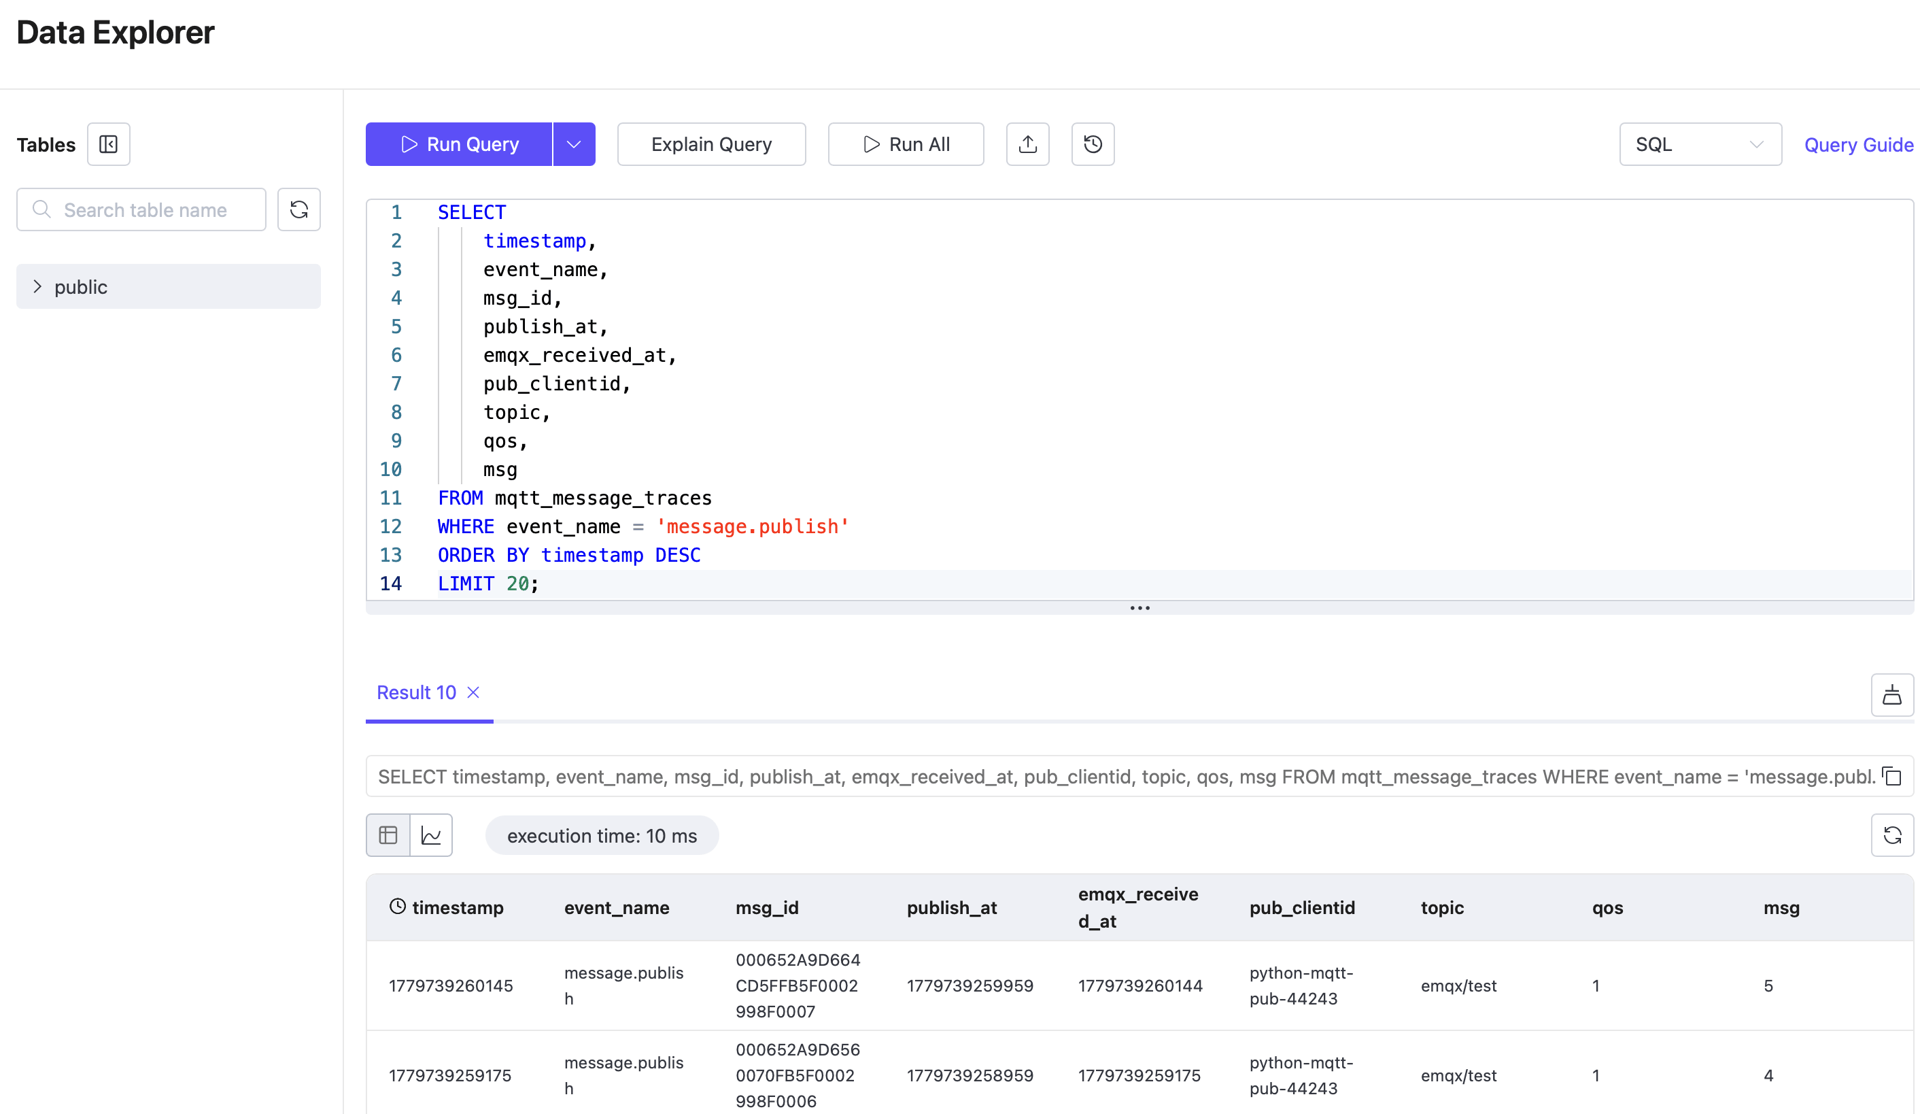
2. View Recent Publish Records
SELECT
    timestamp,
    event_name,
    msg_id,
    publish_at,
    emqx_received_at,
    pub_clientid,
    topic,
    qos,
    msg
FROM mqtt_message_traces
WHERE event_name = 'message.publish'
ORDER BY timestamp DESC
LIMIT 20;
Use this query to confirm that publisher-side timestamps and broker receive timestamps are stored correctly.
3. View Recent Delivered Records
SELECT
    "timestamp",
    event_name,
    msg_id,
    publish_at,
    emqx_received_at,
    emqx_delivered_at,
    pub_clientid,
    sub_clientid,
    topic,
    qos
FROM mqtt_message_traces
WHERE event_name = 'message.delivered'
ORDER BY "timestamp" DESC
LIMIT 20;
Use this query to confirm that delivery-stage data is present and can be used to calculate broker-to-subscriber latency.
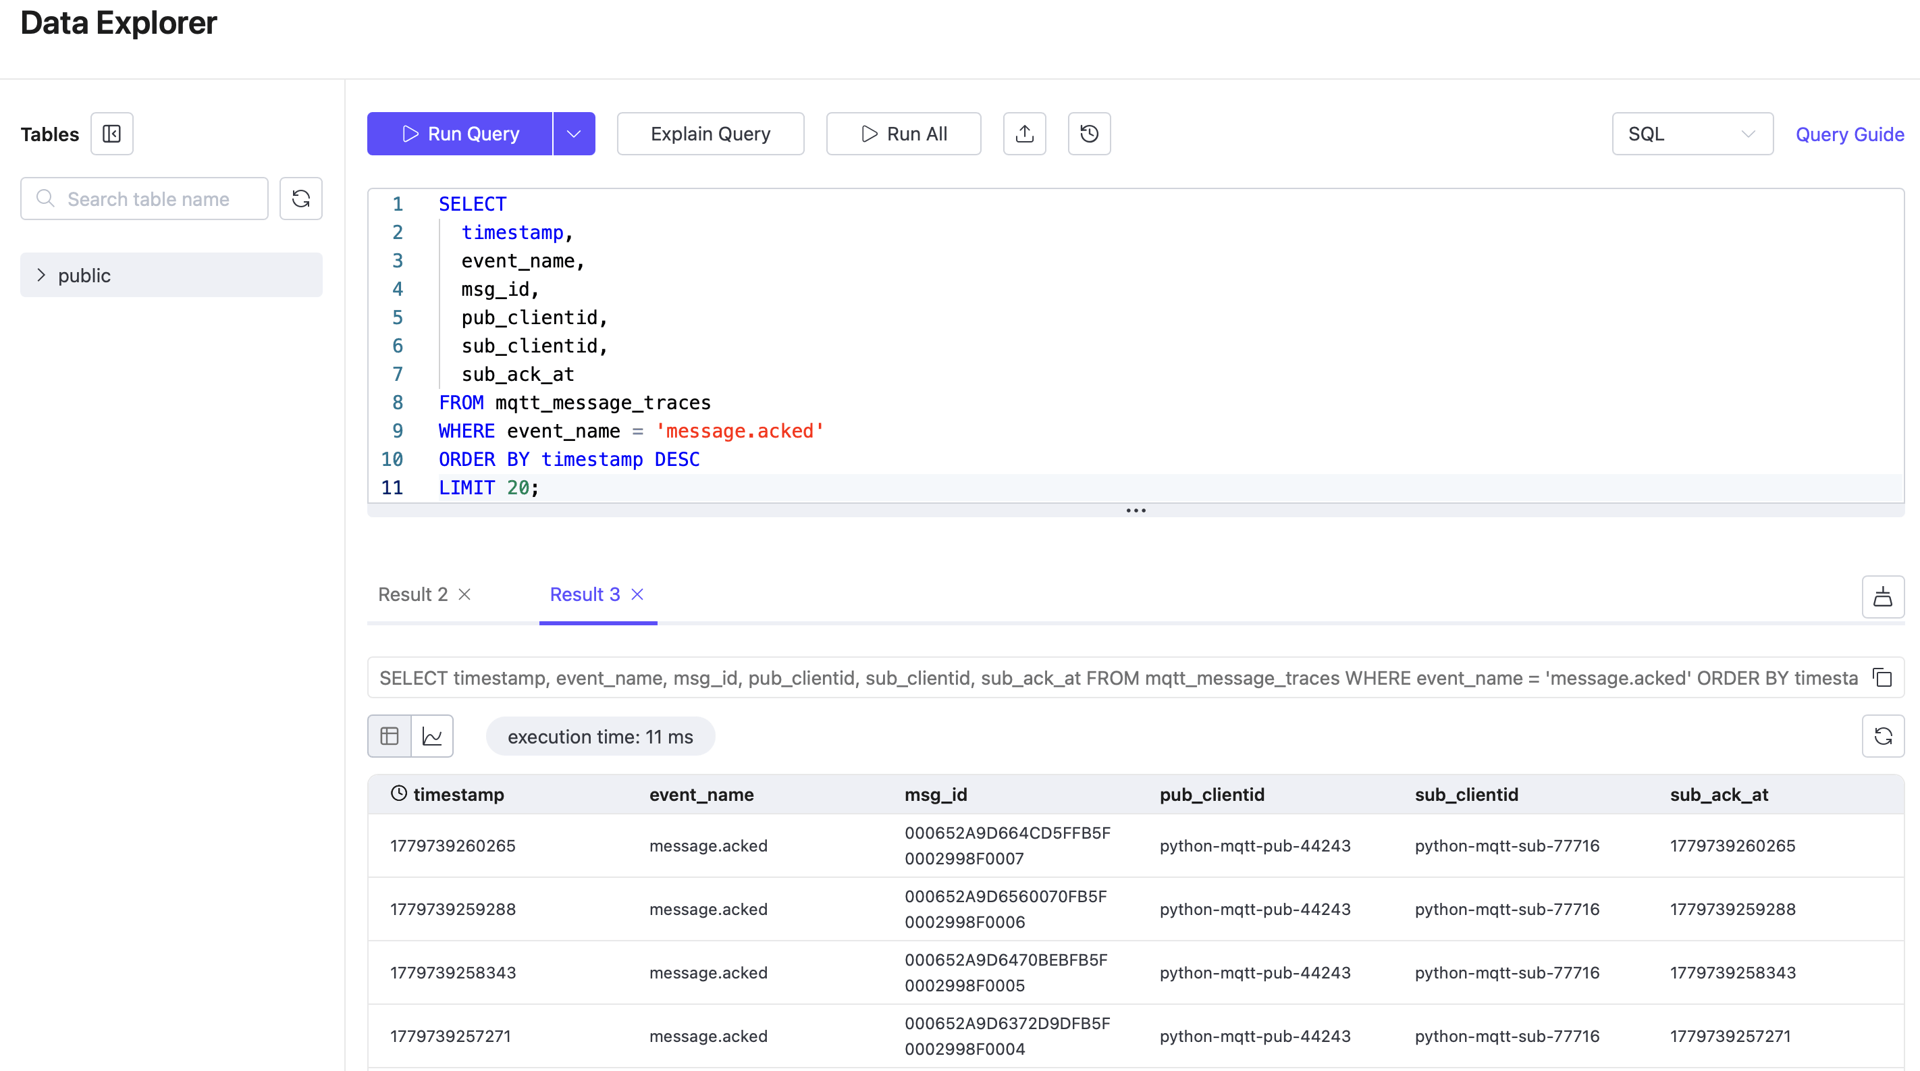
4. View Recent Acked Records
SELECT
    timestamp,
    event_name,
    msg_id,
    publish_at,
    emqx_received_at,
    sub_ack_at,
    pub_clientid,
    sub_clientid,
    topic,
    qos,
    msg
FROM mqtt_message_traces
WHERE event_name = 'message.acked'
ORDER BY timestamp DESC
LIMIT 20;
Use this query to confirm that acknowledgment-stage data is present and can be used to calculate subscriber-side latency.
5. Count Records by Event Type
SELECT
    event_name,
    COUNT(*) AS row_count
FROM mqtt_message_traces
GROUP BY event_name
ORDER BY event_name;
Use this query for a quick integrity check on the trace dataset.
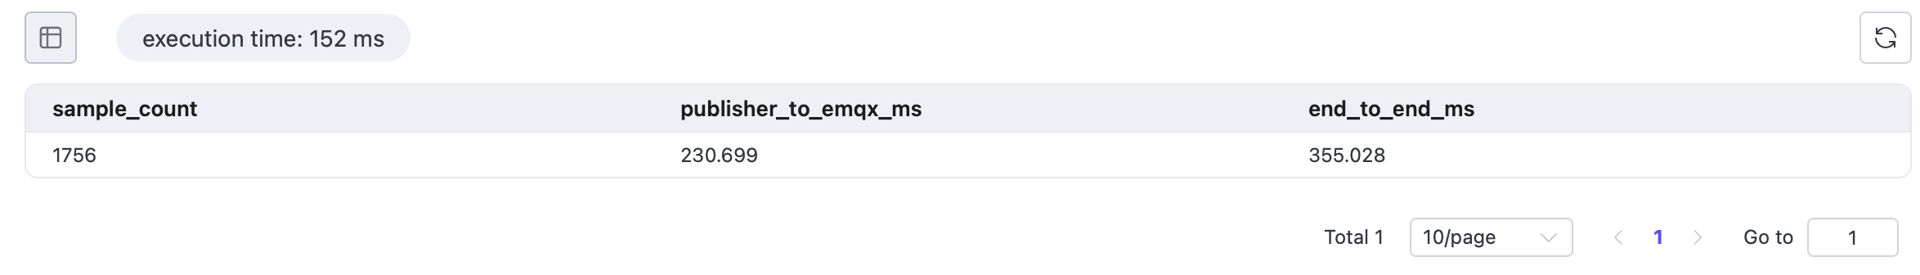
6. Calculate Average Latency per Stage for the Past Hour
WITH publish_events AS (
  SELECT
    msg_id,
    MAX(publish_at) AS publish_at,
    MAX(emqx_received_at) AS publish_received_at
  FROM mqtt_message_traces
  WHERE event_name = 'message.publish'
    AND timestamp >= now() - INTERVAL '1 hour'
  GROUP BY msg_id
),
ack_events AS (
  SELECT
    msg_id,
    MAX(sub_ack_at) AS message_acked
  FROM mqtt_message_traces
  WHERE event_name = 'message.acked'
    AND timestamp >= now() - INTERVAL '1 hour'
  GROUP BY msg_id
),
message_latency AS (
  SELECT
    p.msg_id,
    p.publish_at,
    p.publish_received_at,
    a.message_acked
  FROM publish_events p
  JOIN ack_events a
    ON p.msg_id = a.msg_id
)
SELECT
  COUNT(*) AS sample_count,
  ROUND(AVG(publish_received_at - publish_at), 3) AS publisher_to_emqx_ms,
  ROUND(AVG(message_acked - publish_at), 3) AS end_to_end_ms
FROM message_latency
WHERE publish_at IS NOT NULL
  AND publish_received_at IS NOT NULL
  AND message_acked IS NOT NULL;
In a healthy EMQX system, broker processing latency is typically very low. The more significant contributors are the publish and consume phases: publisher_to_emqx_ms and emqx_to_subscriber_ms.
Query notes:
WHERE timestamp >= now() - INTERVAL '1 hour'limits the query to a one-hour observation window, avoiding interference from historical data.publish_eventsandack_eventsnarrow the dataset before the JOIN.MAX(...)collapses the timestamps from multiple event rows into a single aggregate row.- The final
WHERE ... IS NOT NULLensures that only records with a complete publish/acked chain are used to calculate latency.
7. Validate for Negative Latency Values
Run the following query before accepting latency results. Any non-zero result indicates a timestamp issue, clock synchronization problem, or field mapping error.
WITH publish_events AS (
  SELECT
    msg_id,
    MAX(publish_at) AS publish_at,
    MAX(emqx_received_at) AS publish_received_at
  FROM mqtt_message_traces
  WHERE event_name = 'message.publish'
    AND timestamp >= now() - INTERVAL '1 hour'
  GROUP BY msg_id
),
ack_events AS (
  SELECT
    msg_id,
    MAX(sub_ack_at) AS message_acked
  FROM mqtt_message_traces
  WHERE event_name = 'message.acked'
    AND timestamp >= now() - INTERVAL '1 hour'
  GROUP BY msg_id
),
message_latency AS (
  SELECT
    p.msg_id,
    p.publish_at,
    p.publish_received_at,
    a.message_acked
  FROM publish_events p
  JOIN ack_events a
    ON p.msg_id = a.msg_id
)
SELECT
  SUM(CASE WHEN publish_received_at - publish_at < 0 THEN 1 ELSE 0 END) AS negative_publisher_to_emqx,
  SUM(CASE WHEN message_acked - publish_at < 0 THEN 1 ELSE 0 END) AS negative_end_to_end
FROM message_latency
WHERE publish_at IS NOT NULL
  AND publish_received_at IS NOT NULL
  AND message_acked IS NOT NULL;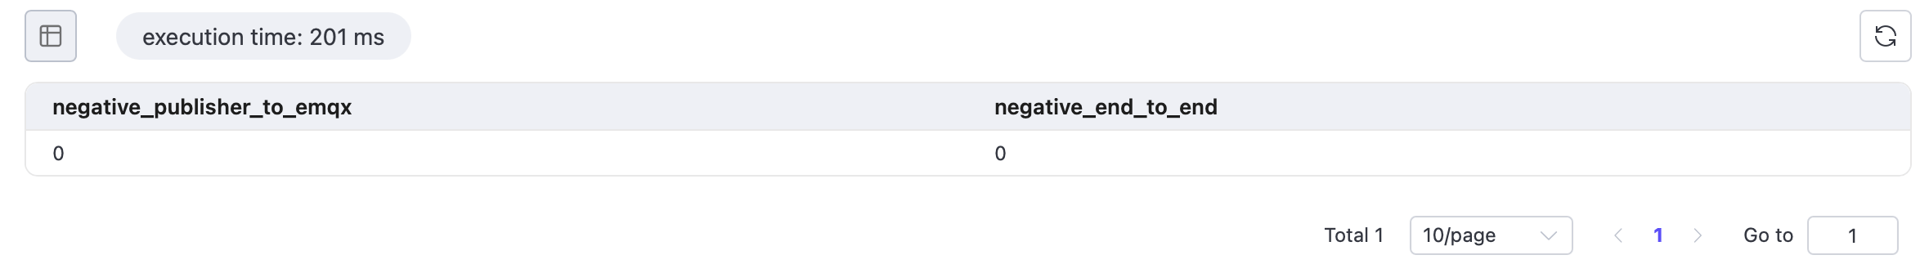
All values must be 0 before the results can be considered valid. If any count is non-zero, check the timestamp mappings and clock synchronization configuration before using the results as final conclusions.
Result Validation
Before publishing final latency results, verify all of the following:
- Trace records exist for both
message.publishandmessage.ackedevent types; - Key timestamp fields
publish_at,emqx_received_at, andsub_ack_atare correctly populated; - The average latency query returns a meaningful
sample_count; - The negative-value validation query returns 0 for all checks;
- EMQX Rule Action metrics show no abnormal failure counts.