Build and Deploy Your First Agent
This guide walks you through creating a complete event-driven agent using EMQX Agents. You will build a temperature anomaly monitor that watches MQTT messages from factory devices, evaluates each reading against a rolling average, and publishes an alert when a device's average temperature exceeds a threshold.
By the end of this guide, you will have:
- A running EMQX Agents deployment connected to your EMQX Broker
- A connector configured for your broker
- A deployed agent that reacts to live MQTT events
Prerequisites
- An EMQX Cloud account with an active project.
- An EMQX Broker deployment in the Running state. The broker must be in the same project and region as your EMQX Agents deployment.
- An MQTT client for publishing test messages (for example, MQTTX).
Step 1: Request an EMQX Agents Deployment
EMQX Agents is currently available as a Private Beta. Deployments are provisioned by the EMQX team after you submit a support ticket.
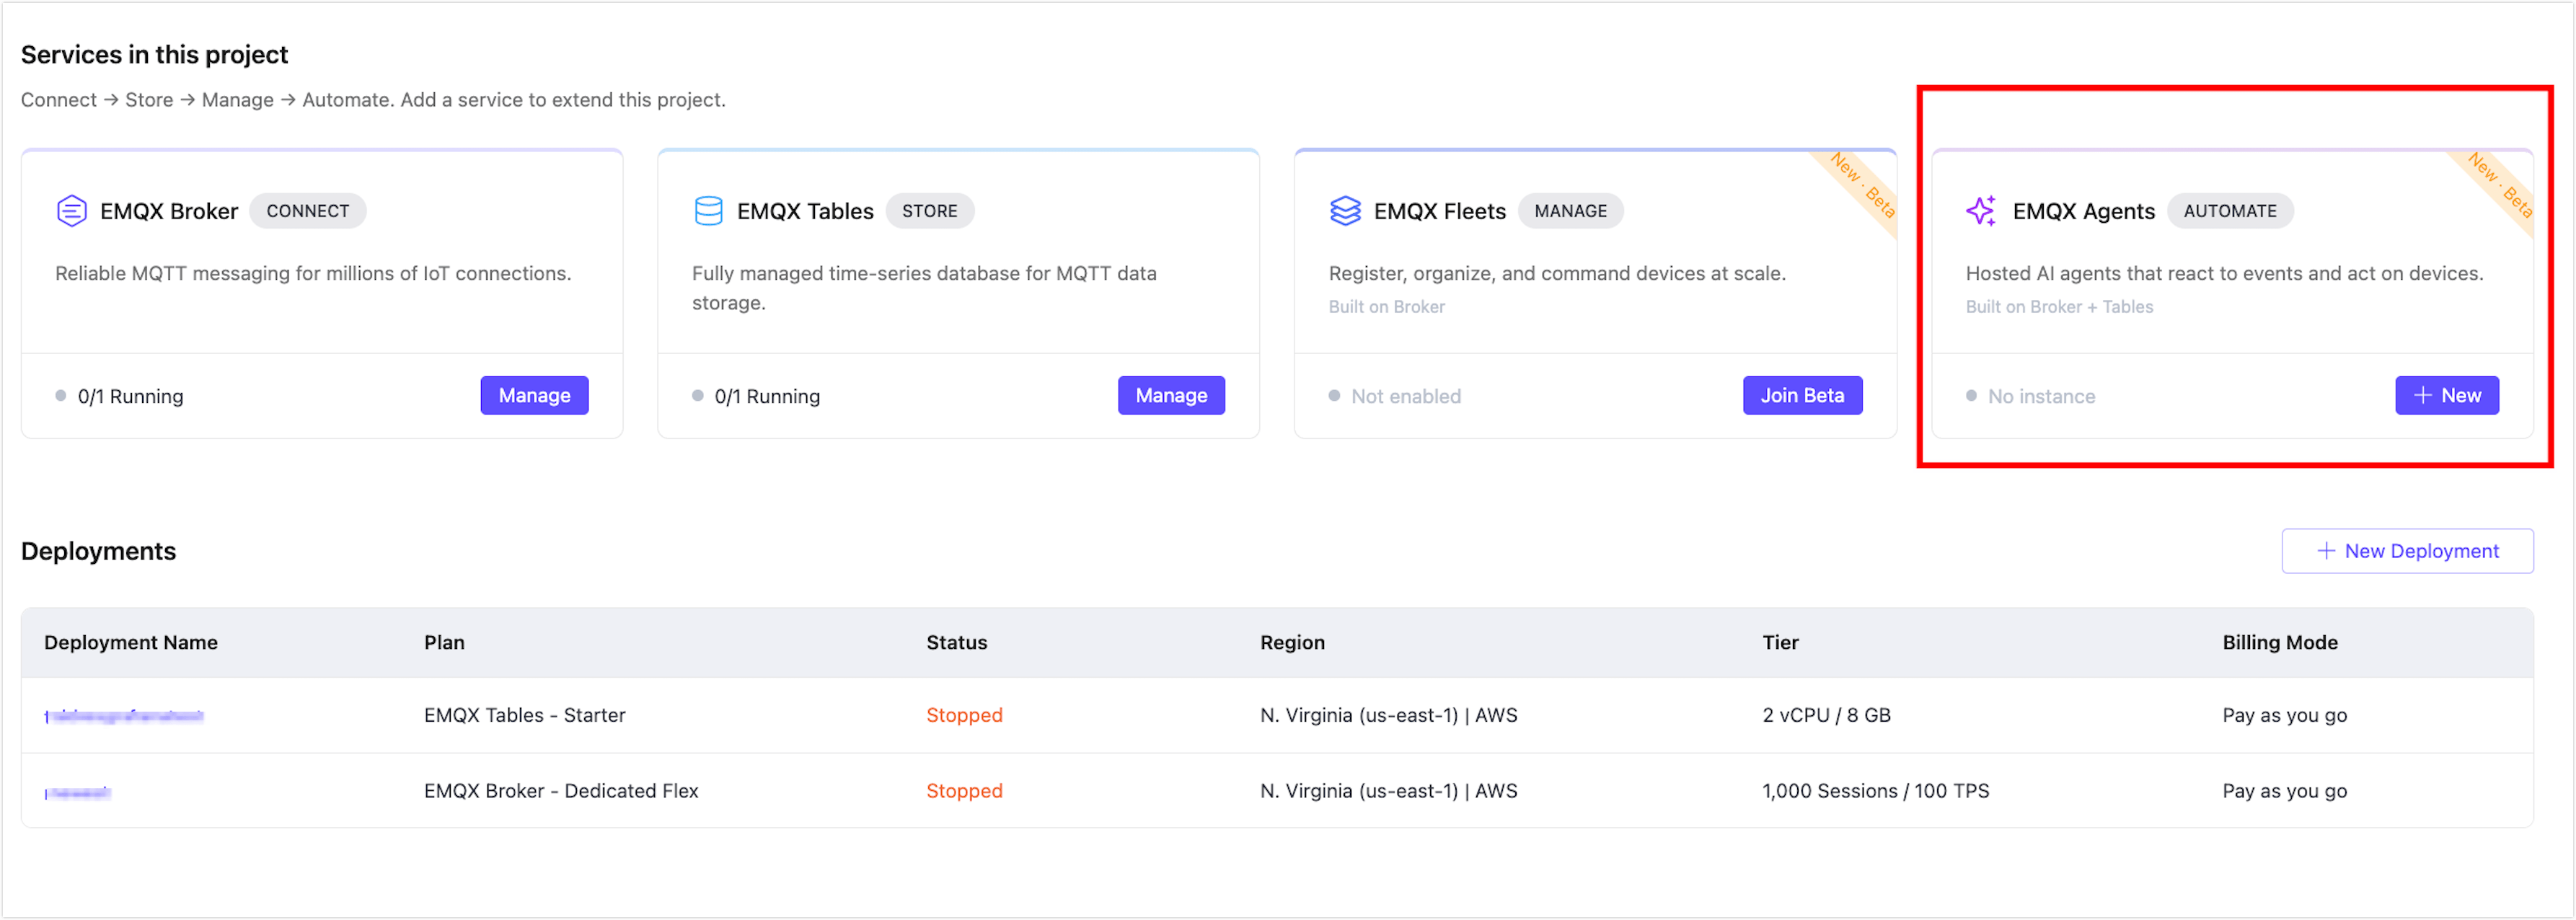
Log in to the EMQX Cloud Console and open your project.
On the EMQX Agents card, click Join Beta.
In the Support Tickets page that opens, click + New to create a ticket.
A ticket form opens with the subject and description pre-filled. Edit them if needed, then click Confirm to submit.
The EMQX team will provision a deployment for your project and notify you. Once the deployment is ready, click it to open it.
Step 2: Add a Connector
Before the agent can subscribe to MQTT topics or publish messages, you need to configure a connector that points to your EMQX Broker.
In your EMQX Agents deployment, click Connectors in the left menu.
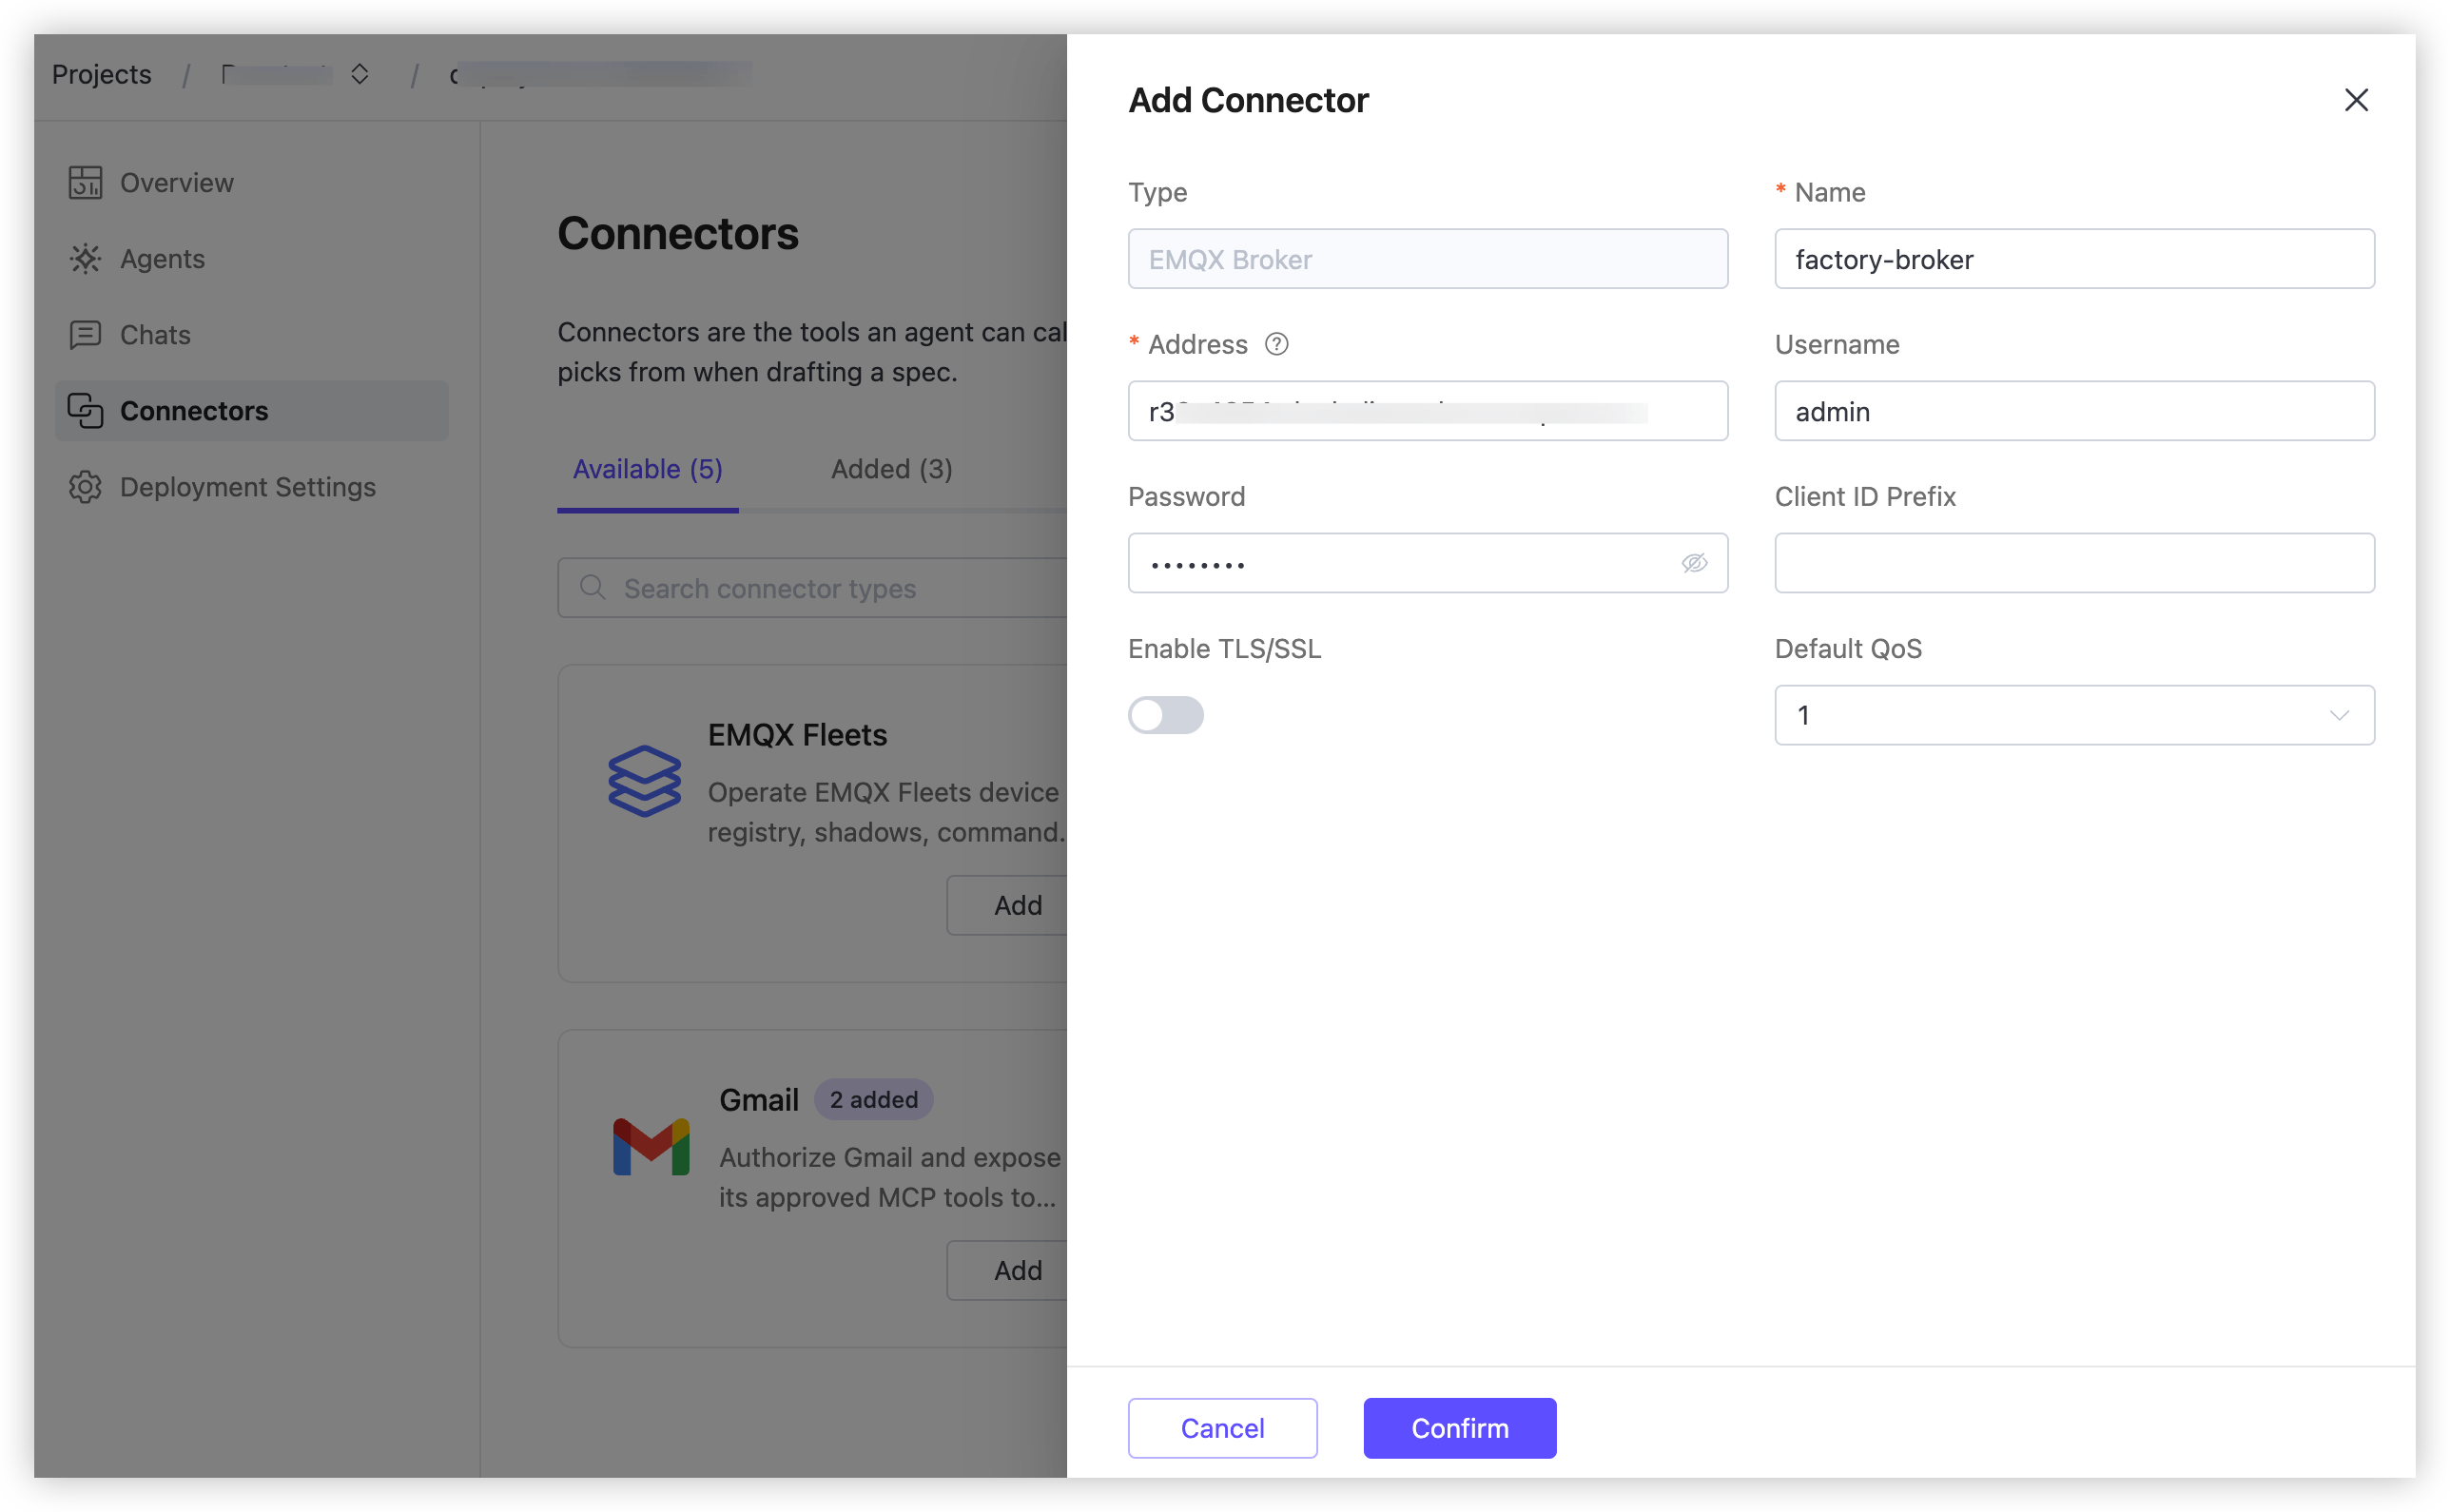
On the Available tab, find EMQX Broker and click Add.
In the Add Connector panel:
- Type: Filled with
EMQX Broker. - Name: Enter a name, for example
factory-broker. - Address: Enter your broker's address in
host:portformat, always including the port number, for examplebroker.example.com:1883for unencrypted MQTT orbroker.example.com:8883for TLS. Find the address in the MQTT Connection Information section on your EMQX Broker deployment's Overview page. - Username and Password: Enter the credentials configured in Access Control -> Authentication on your EMQX Broker deployment.
- Client ID Prefix: Leave blank. The system generates client IDs automatically.
- Leave Enable TLS/SSL off and Default QoS at
1for this guide.
- Type: Filled with
Click Confirm.
The connector appears on the Added tab with its address shown in the Description column.
Step 3: Start a Chat and Describe the Agent
Agents are built through conversation. You describe what you want, and the LLM generates the agent definition.
Click Chats in the left menu, then click + New Chat.
Click the connector icon in the lower-left corner of the input area. A Connectors panel appears listing your configured connectors. Check
factory-brokerto make it available for this session.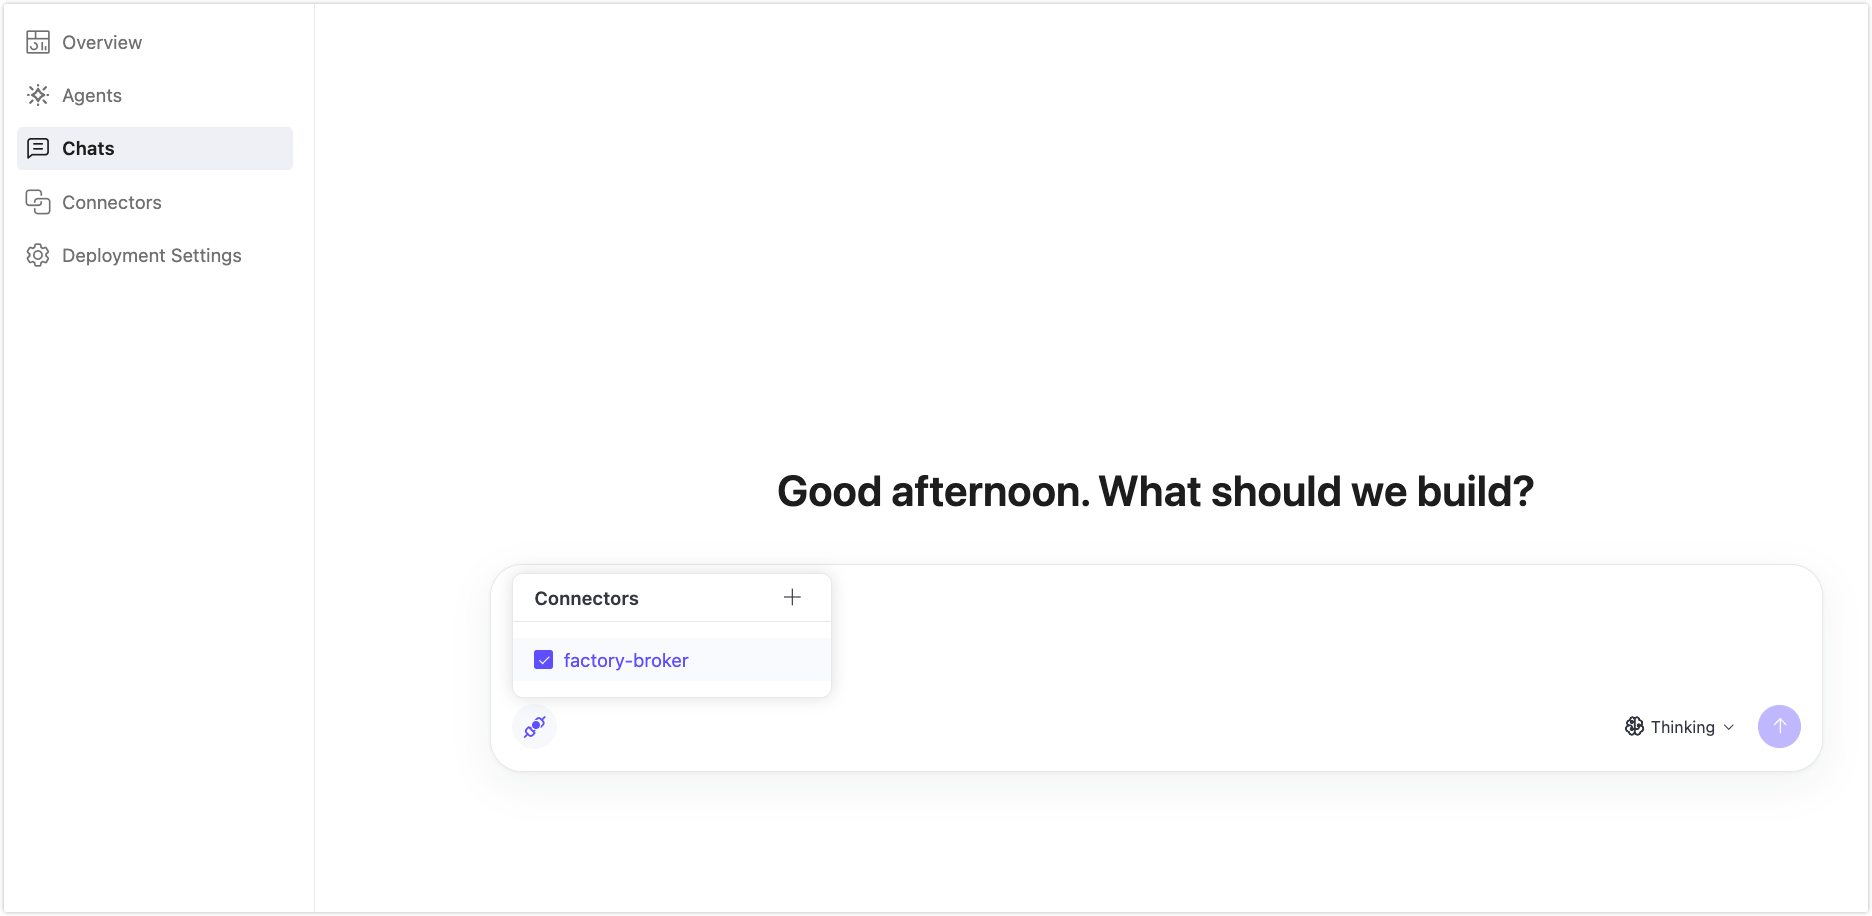
In the input field, describe what you want the agent to do. For this guide, enter:
I want to monitor MQTT temperature events on the topic factory/+/+/temperature.
Each message payload is JSON, for example: {"device_id": "dev-0042", "temp": 95.4}
The agent should track the last 3 readings per device. If the rolling average
exceeds 70, publish an alert to alerts/anomaly.
Select your preferred thinking mode from the dropdown in the lower-right corner, then click the send button.
The LLM processes your request. It generates the agent's instructions, writes a skill for maintaining the rolling temperature history, and assembles a complete agent definition with the MQTT trigger and publish tool configured.
Step 4: Deploy the Agent
Once the LLM has finished generating the agent definition, a Deploy Agent button appears at the bottom of the chat.
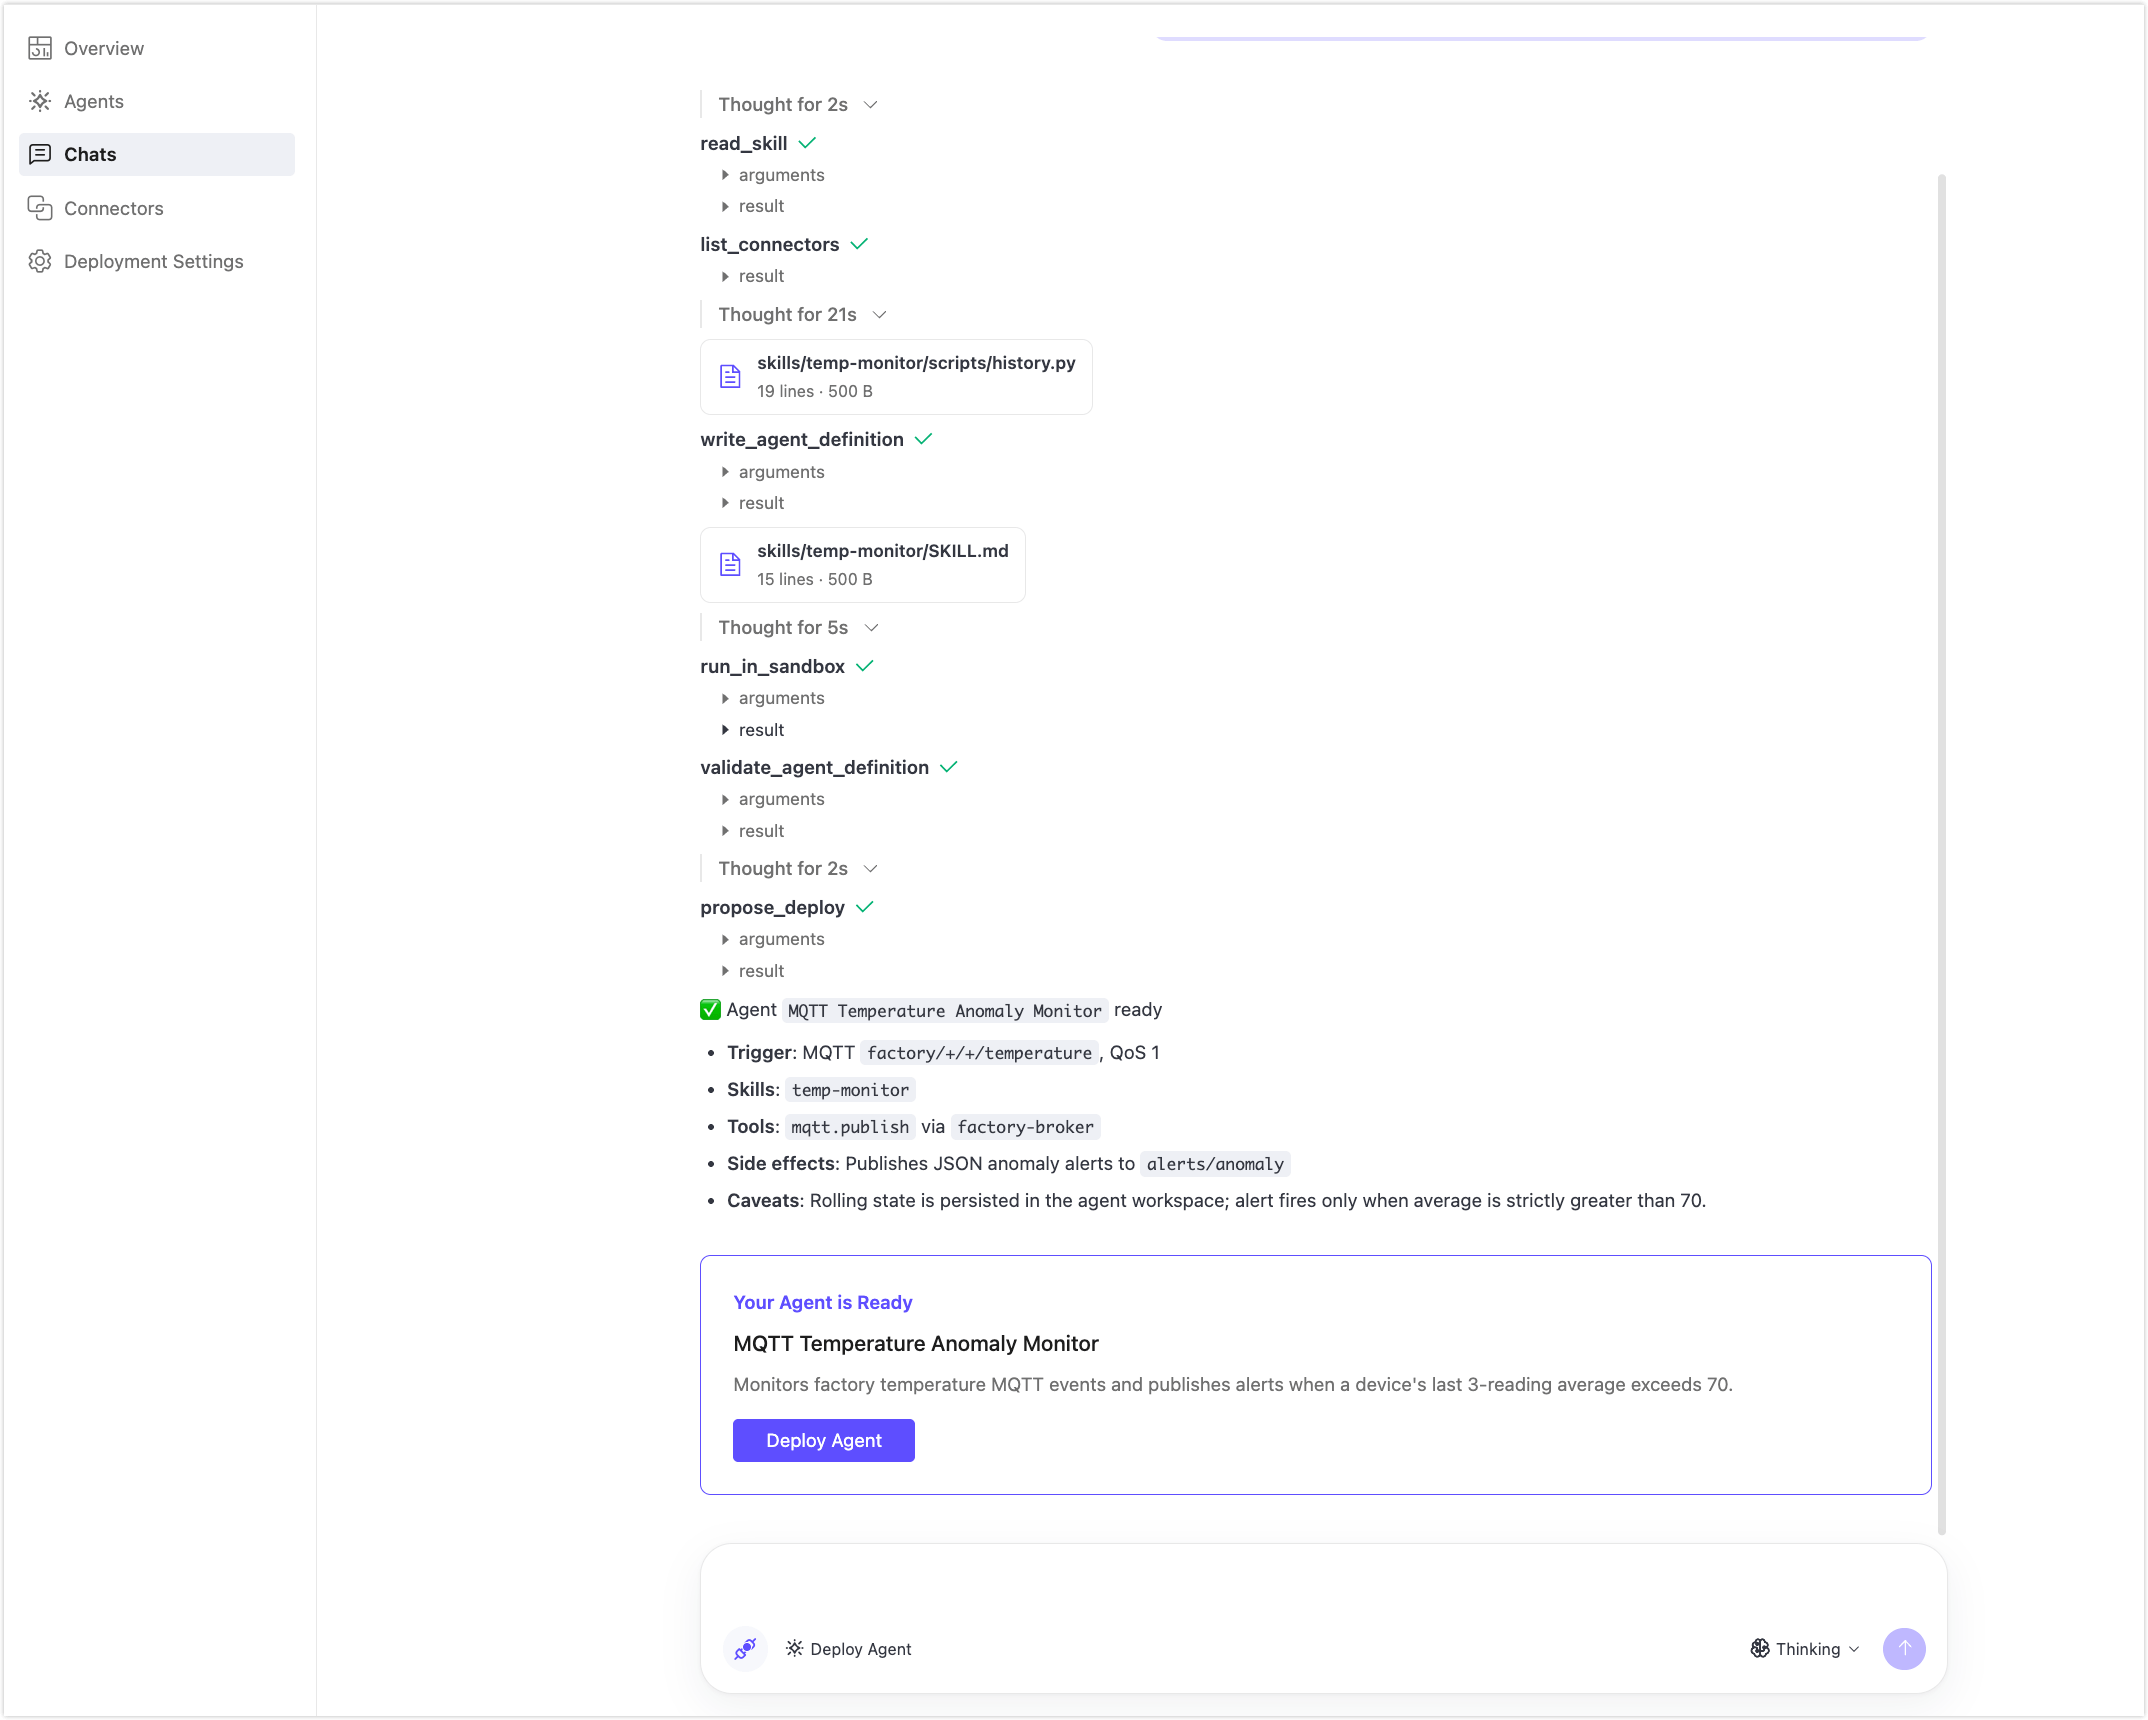
Click Deploy Agent.
A dialog appears with a pre-filled Agent Name and Description. Edit them if needed, then click Deploy Agent.
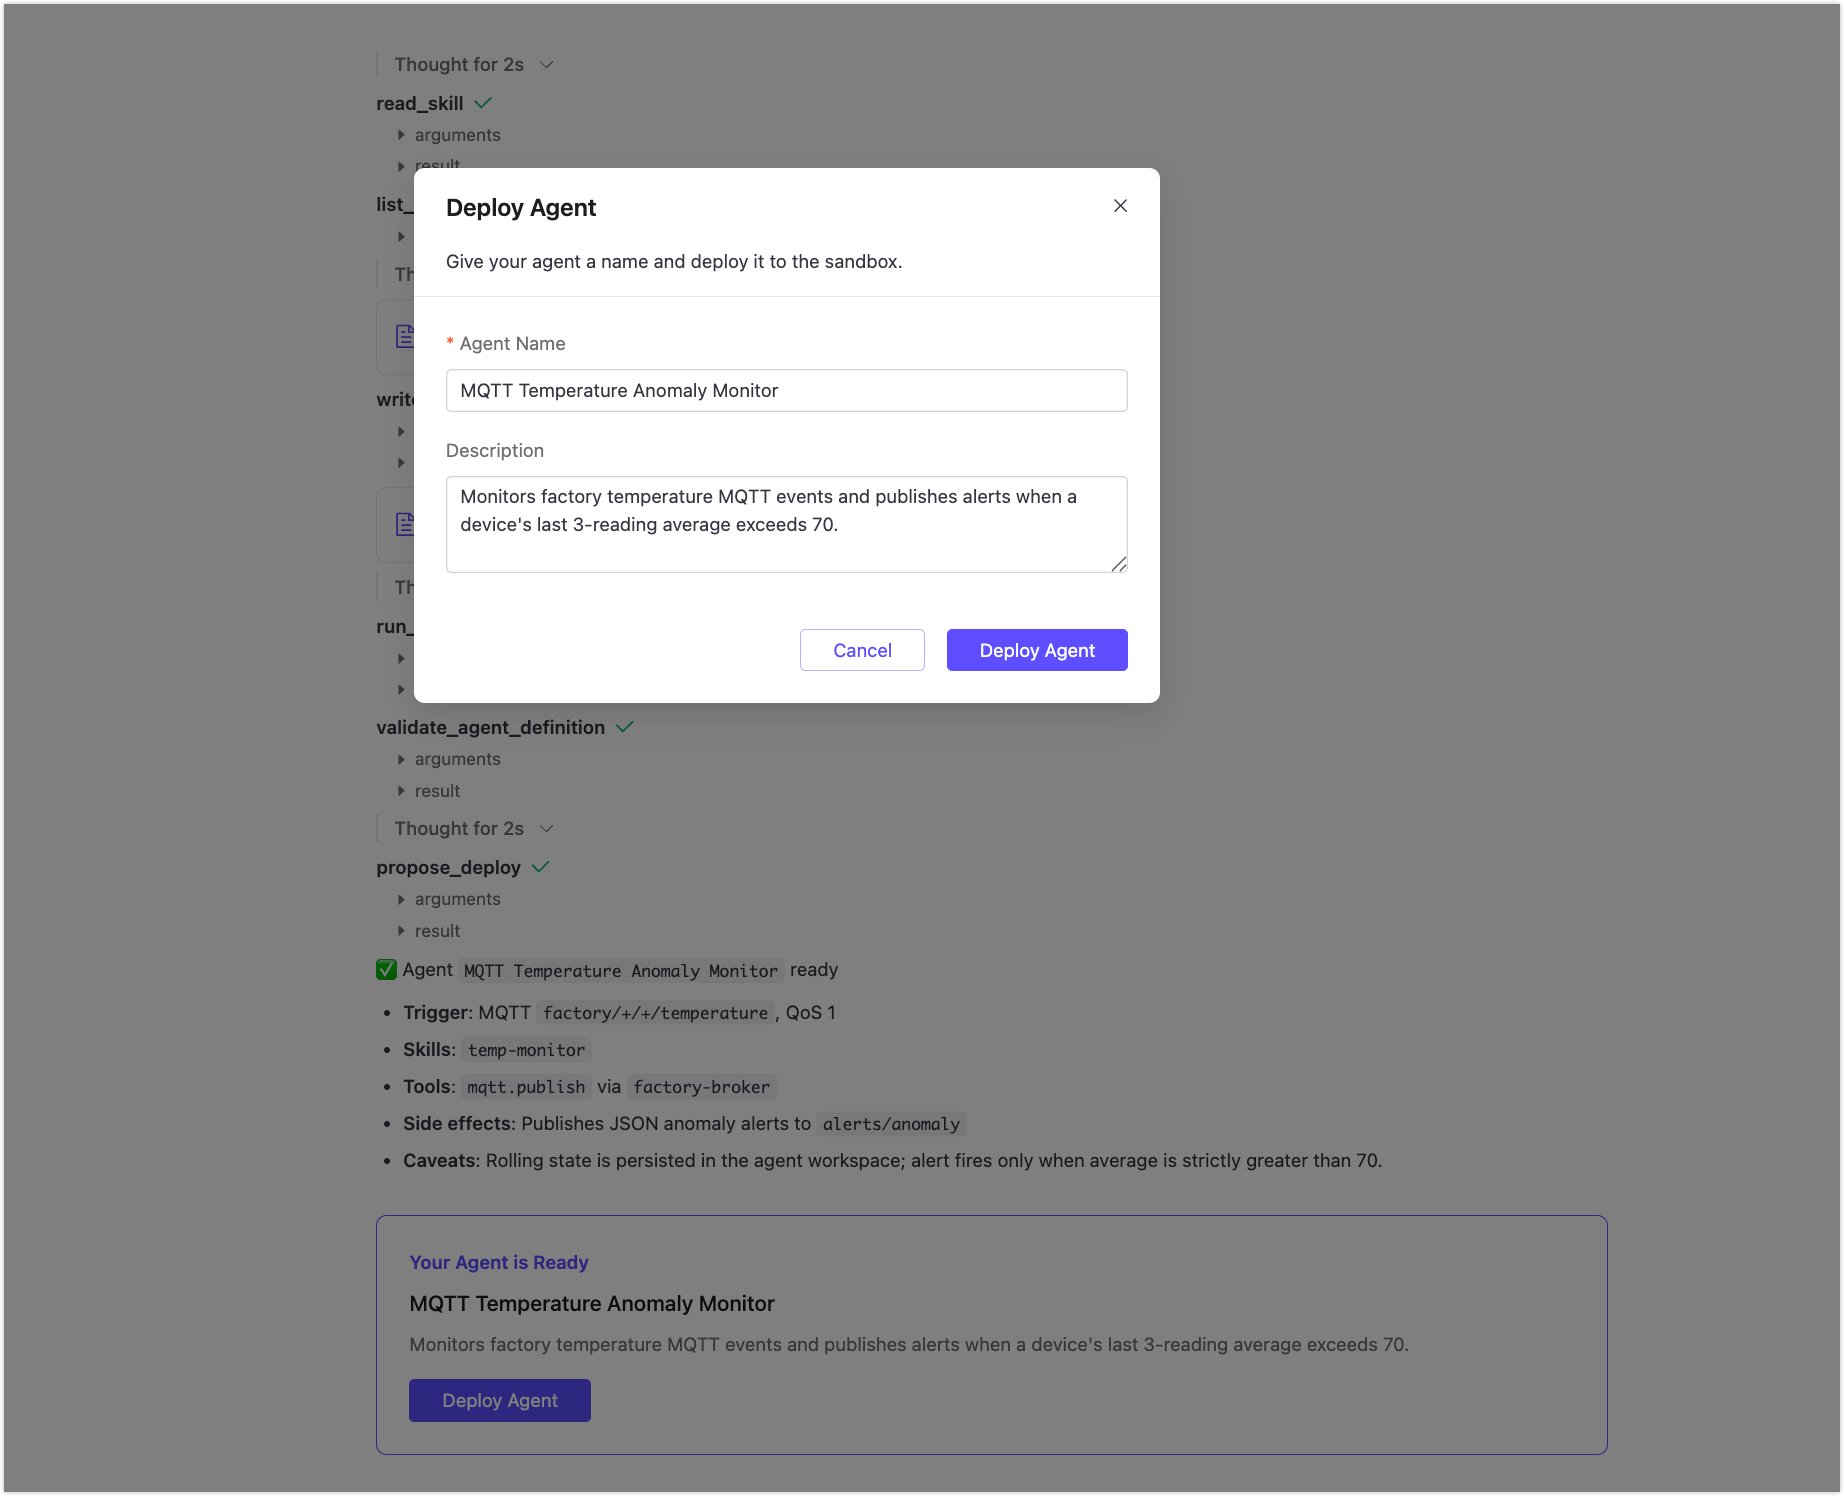
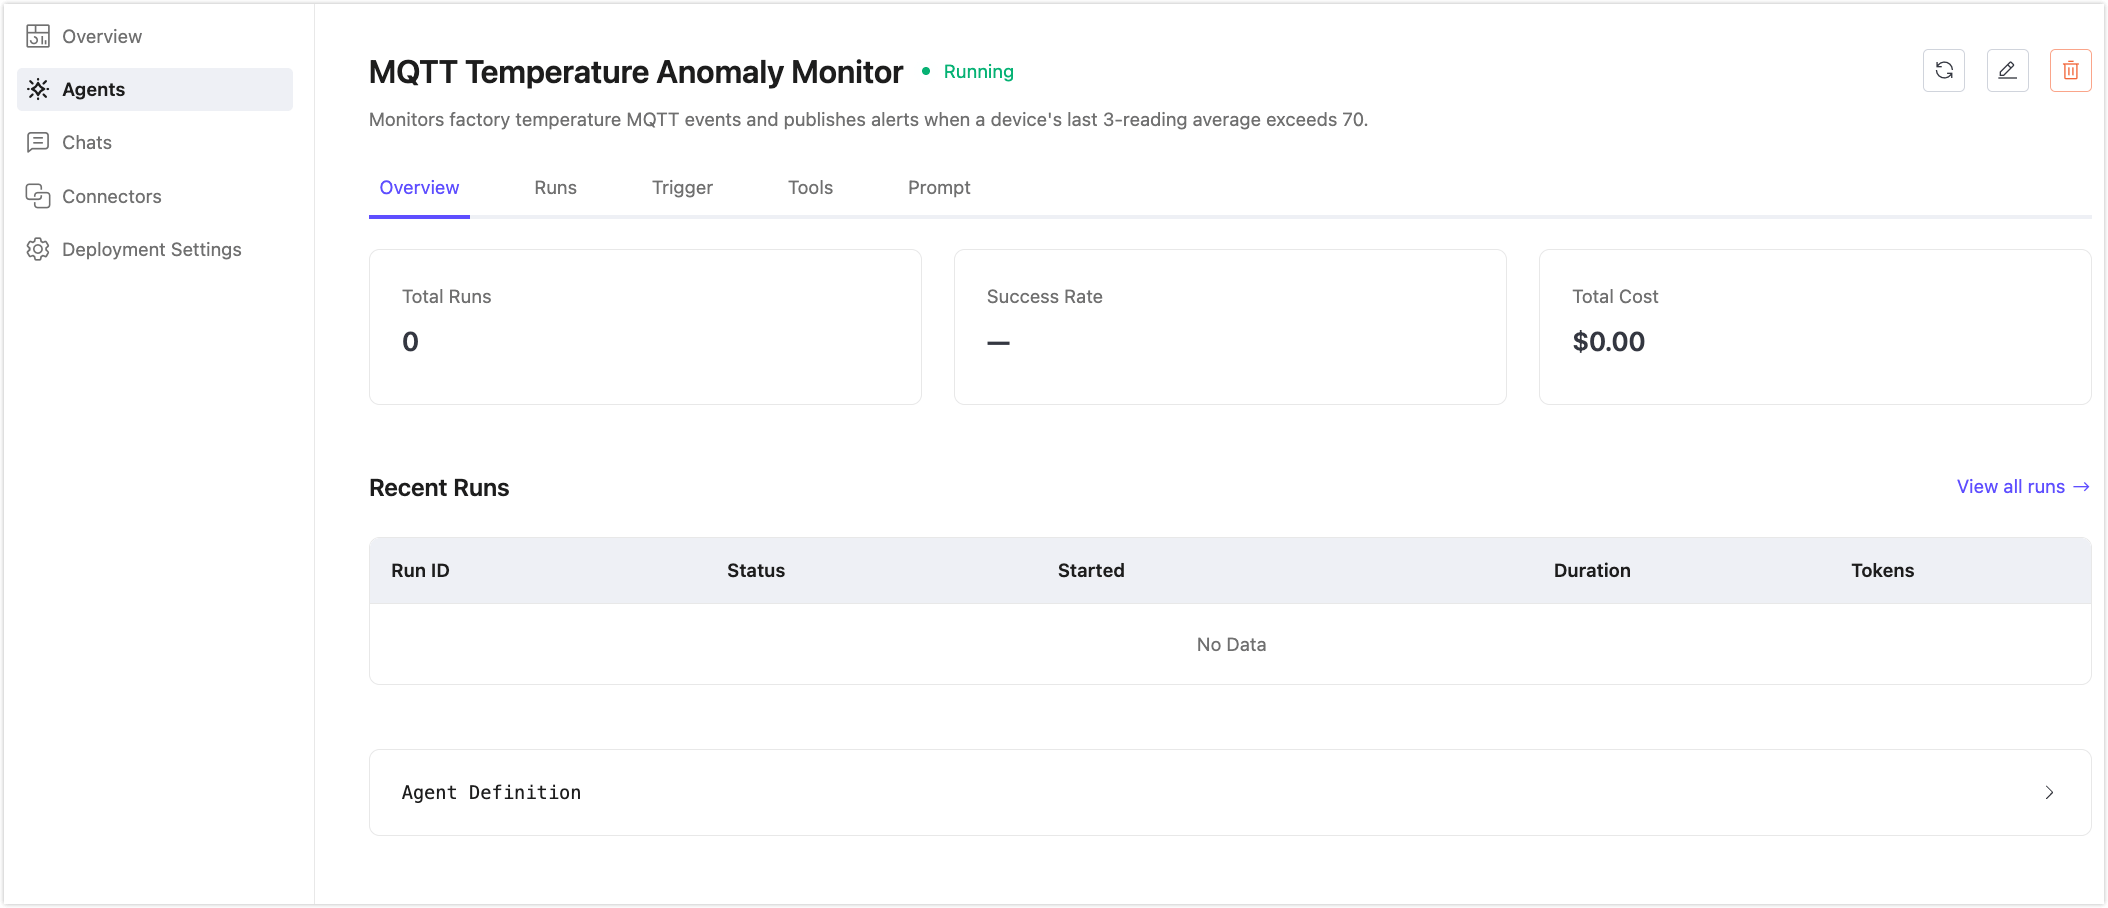
The agent creation starts immediately. You are taken to the agent detail page.
In a few minutes, you can see the agent status is Running. The five tabs (Overview, Runs, Trigger, Tools, and Prompt) show the full configuration generated from your chat:
- Trigger: Kind
mqtt, topicfactory/+/+/temperature, QoS1, connected to yourfactory-brokerconnector. - Tools:
mqtt.publish, restricted to thealerts/anomalytopic. - Prompt: The instructions the LLM wrote specifically for this agent, describing its behavior for each incoming event.
Step 5: Test the Agent
Publish a series of test messages to trigger the agent and verify it works.
Open your MQTT client and connect to the same EMQX Broker using the same credentials.
Publish several messages to a topic that matches
factory/+/+/temperature, for examplefactory/plant-a/line-3/temperature. Use a JSON payload:json{"device_id": "dev-0022", "temp": 75.1}Publish the message at least three times with temperatures above 70, for example
75.1,78.3, and80.0. This gives the agent enough readings to compute a rolling average that exceeds the threshold.Return to the EMQX Agents deployment and go to the Runs tab of your agent.
Each published message that matched the trigger topic created one run. Each run shows a success status.
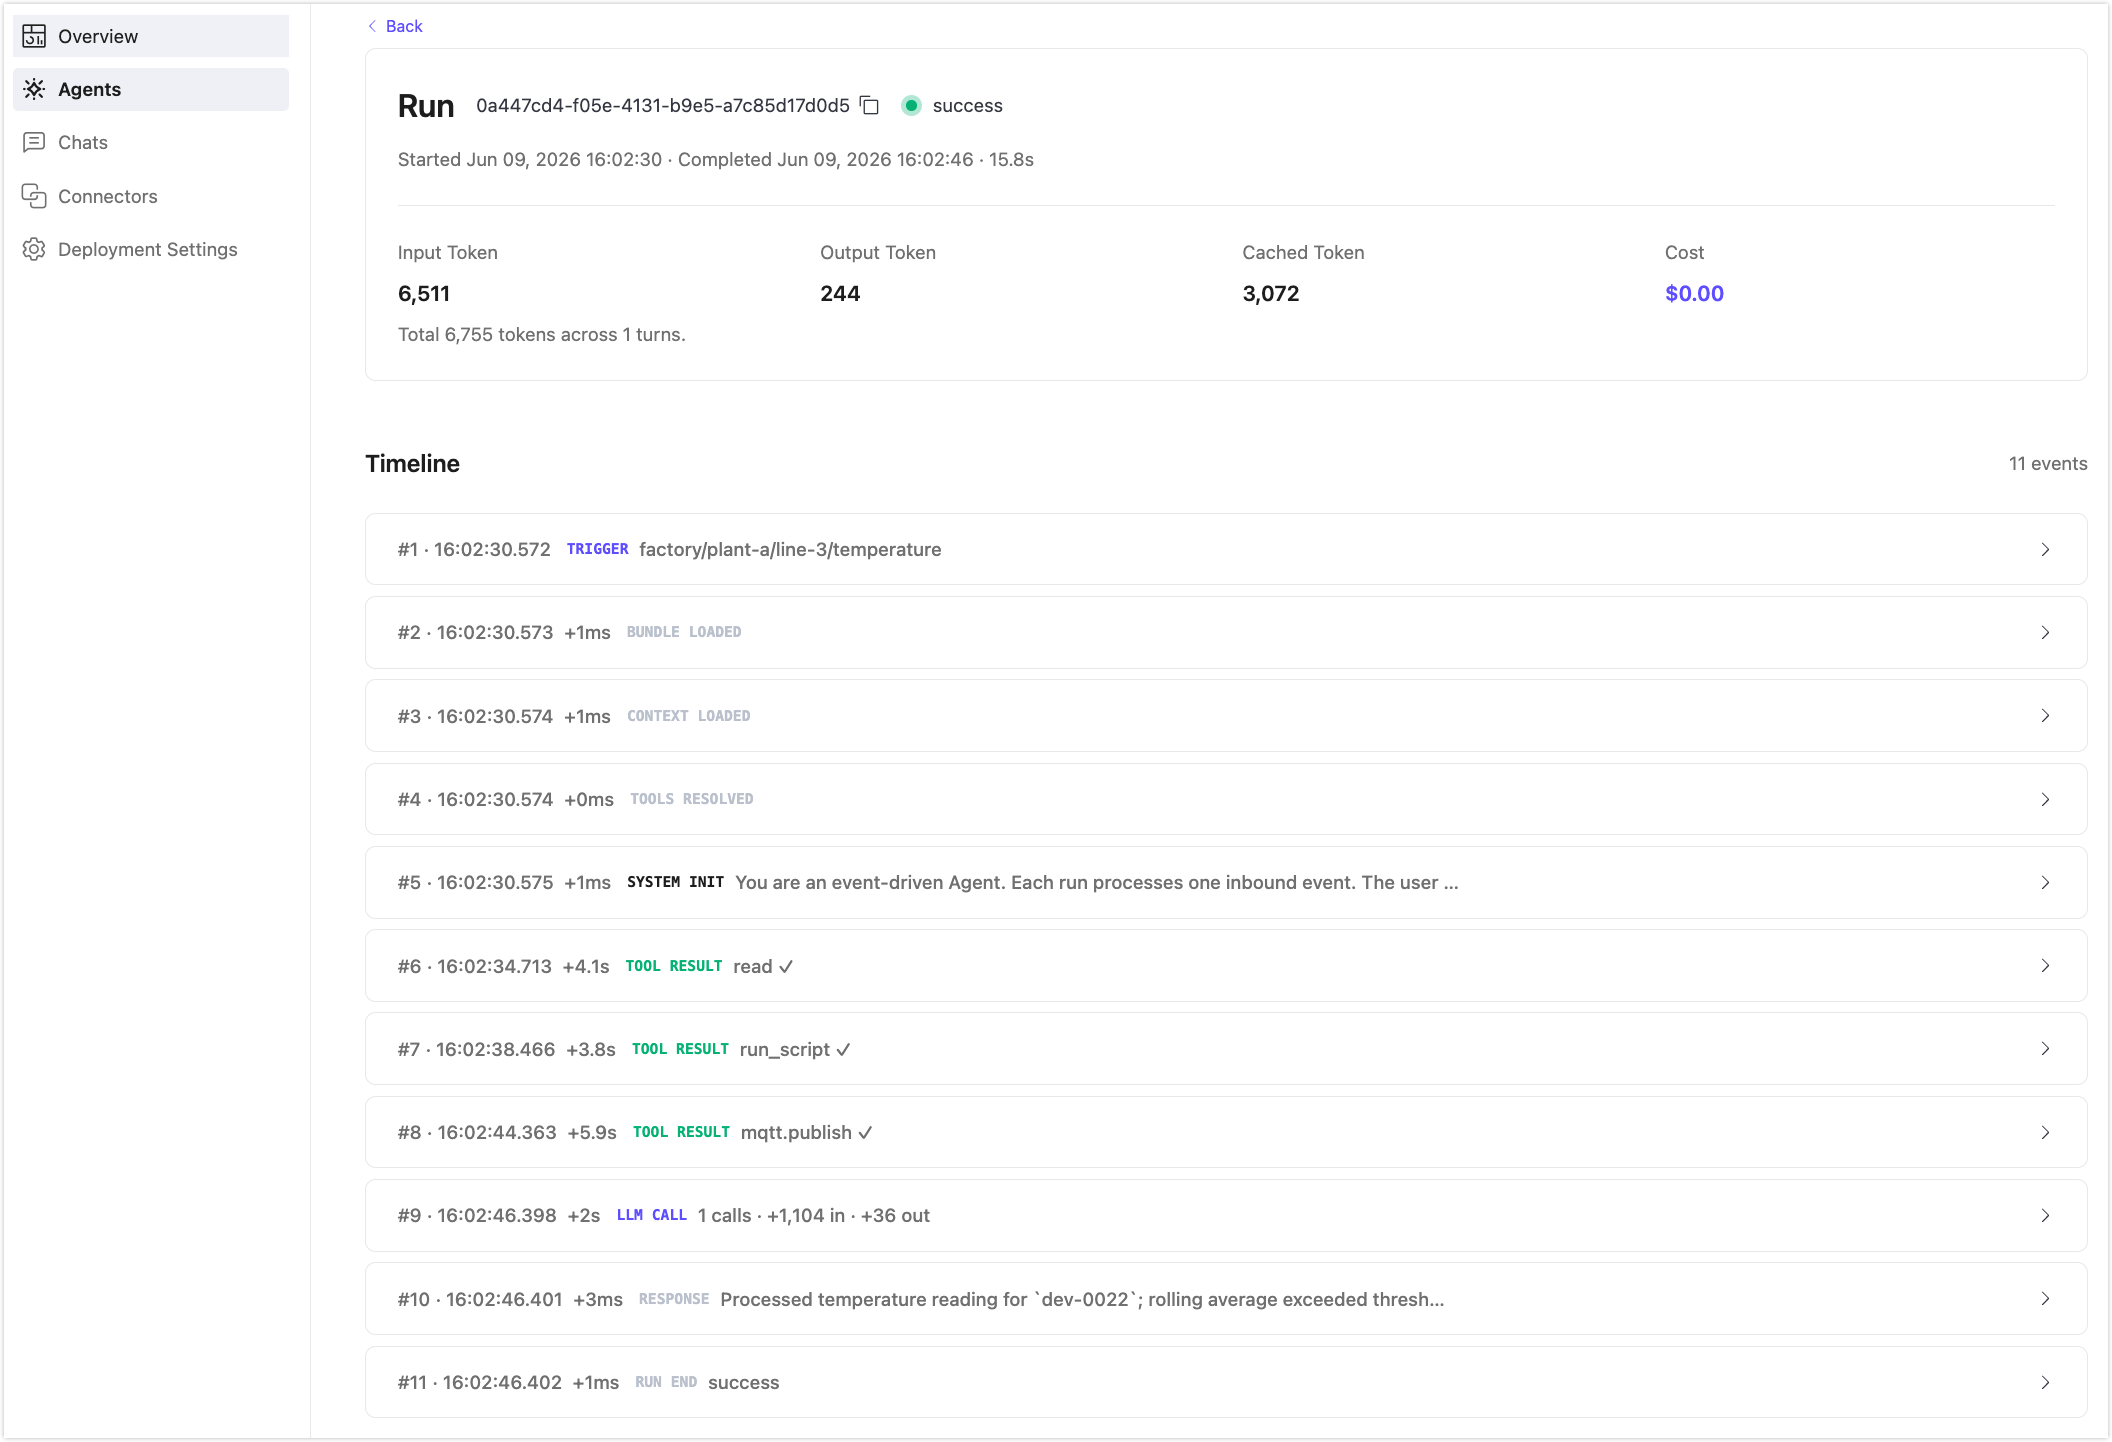
Click a run ID to open the run detail page. The Timeline shows the sequence of events for that execution:
Event Description TRIGGERThe MQTT message that started the run, including the topic. BUNDLE LOADEDThe agent's skills and configuration were loaded. CONTEXT LOADEDThe conversation context was prepared. TOOLS RESOLVEDThe tools available for this run were resolved. SYSTEM INITThe agent's prompt was applied. TOOL RESULTEach tool call the agent made, for example read,run_script, ormqtt.publish.LLM CALLThe LLM invocation, with input and output token counts. RESPONSEThe agent's final response for this run. RUN ENDThe terminal status of the run. When the rolling average threshold was exceeded, the
mqtt.publishtool result appears in the timeline, and the Response event confirms the alert was published.
Optional: Build an Agent with MCP Connectors
MCP connectors let agents and chats use external services through the Model Context Protocol (MCP).
Use this optional flow when you want to build an agent that uses an external service, such as Slack. This flow uses a separate chat because the prompt is different from the MQTT temperature monitor in the main tutorial.
Step 1: Add an MCP Connector
In your EMQX Agents deployment, click Connectors in the left menu.
On the Available tab, find Slack as an MCP connector service.
Click Add on the connector card.
In the Add Connector panel, enter a Name for the connector, for example
ops-slack. The Type field is filled with the selected service, and no other configuration fields are required.Click Confirm.
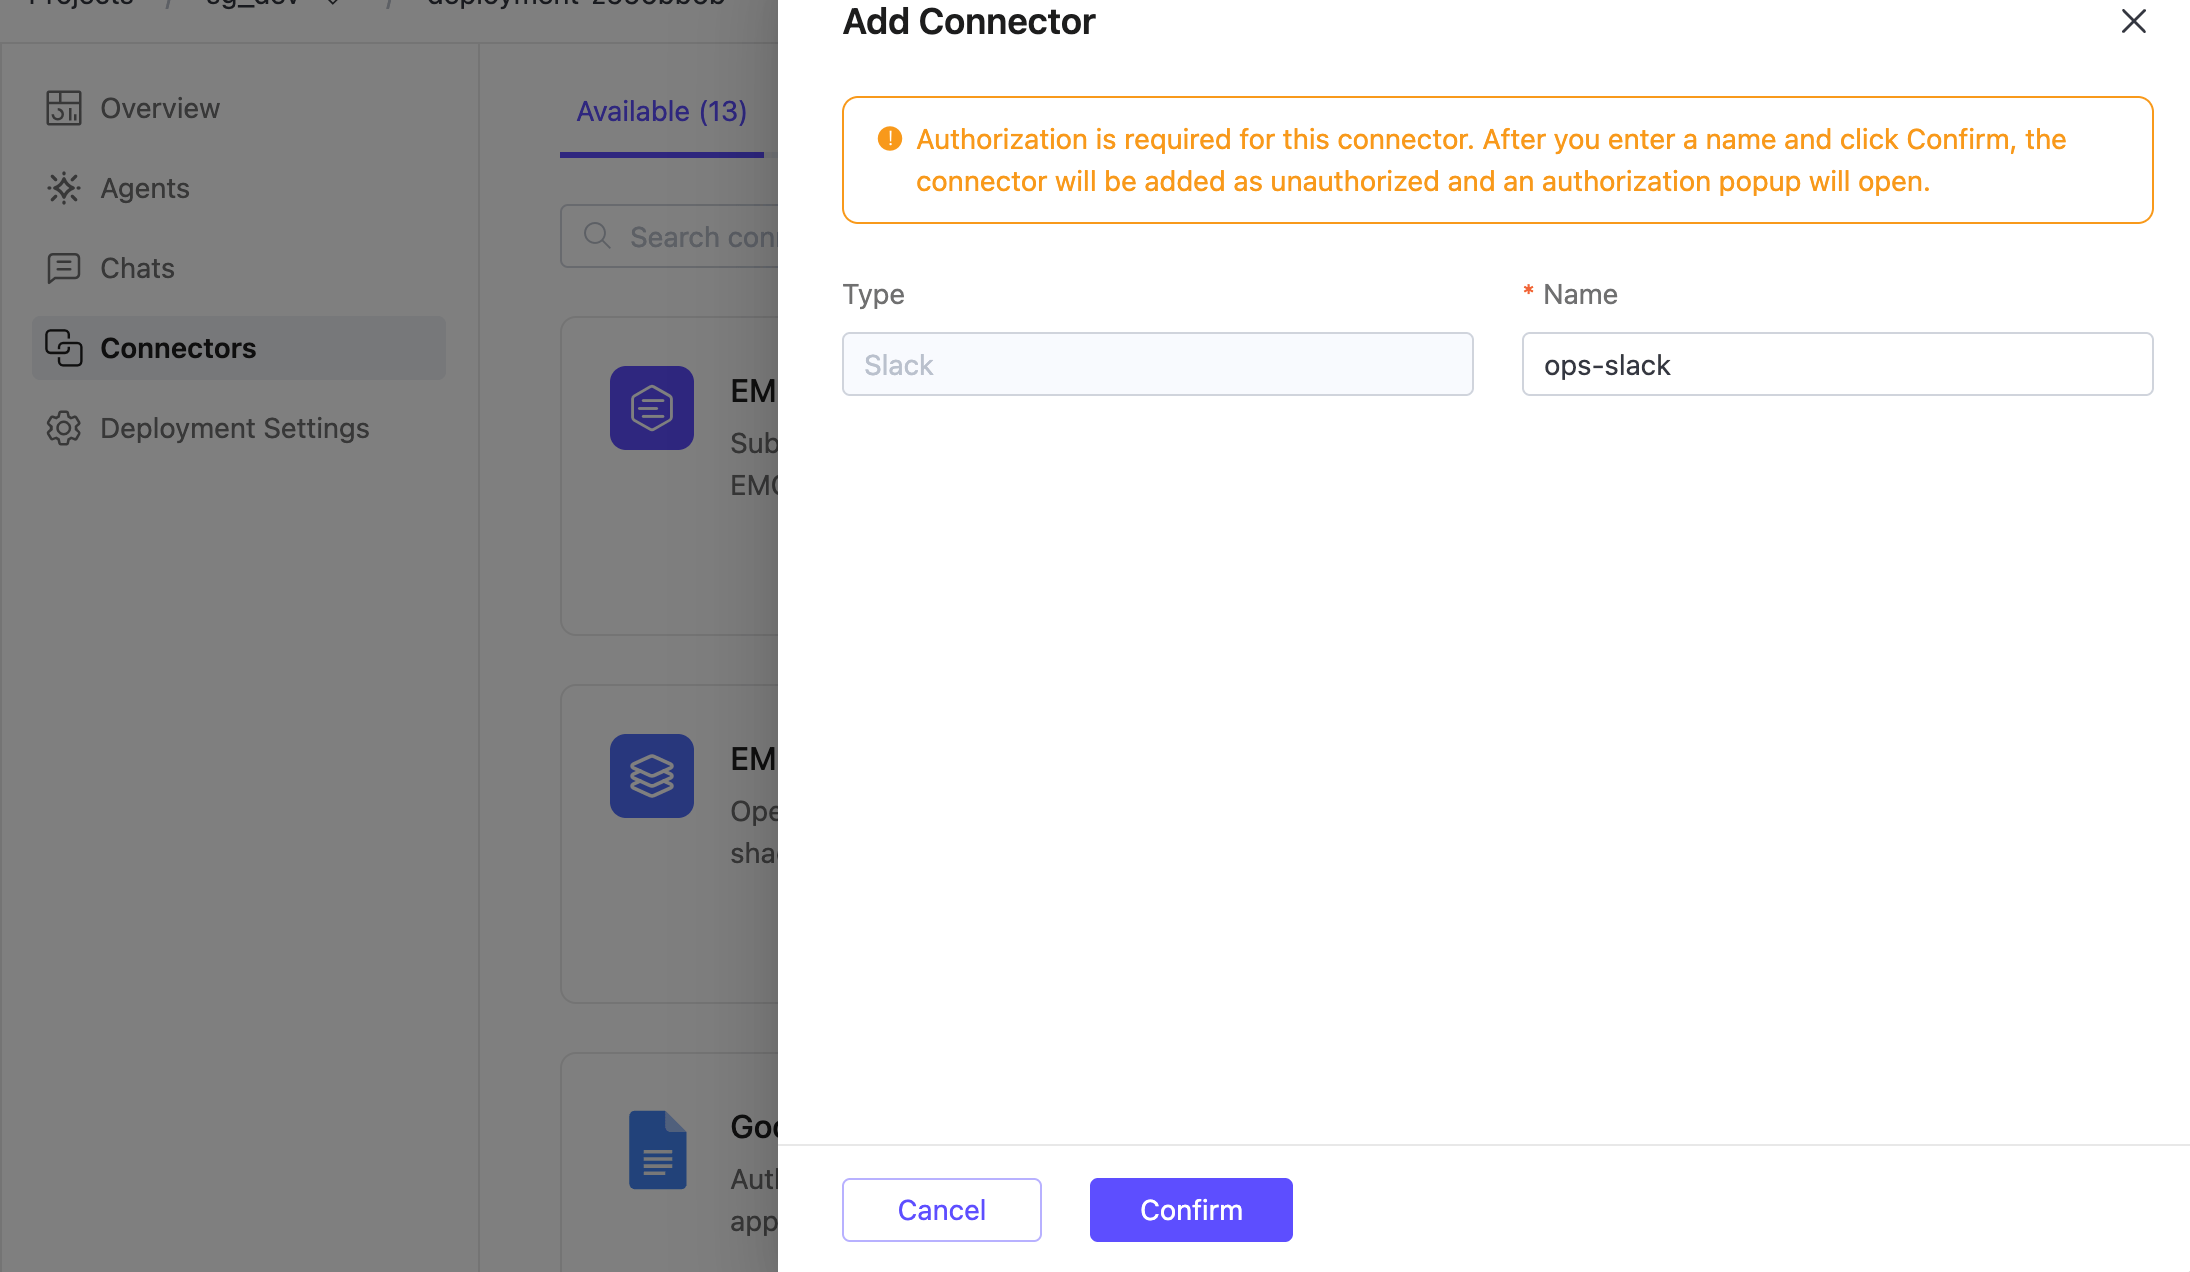
The connector is added with an Unauthorized status, and EMQX Agents opens an authorization popup for the selected service. Complete the external authorization flow. When authorization succeeds, the connector status changes to Authorized in the Added tab.
If you close the popup or authorization fails, go to the Added tab and click the retry authorization action for the connector.
Step 2: Start a Chat with the MCP Connector
Click Chats in the left menu, then click + New Chat.
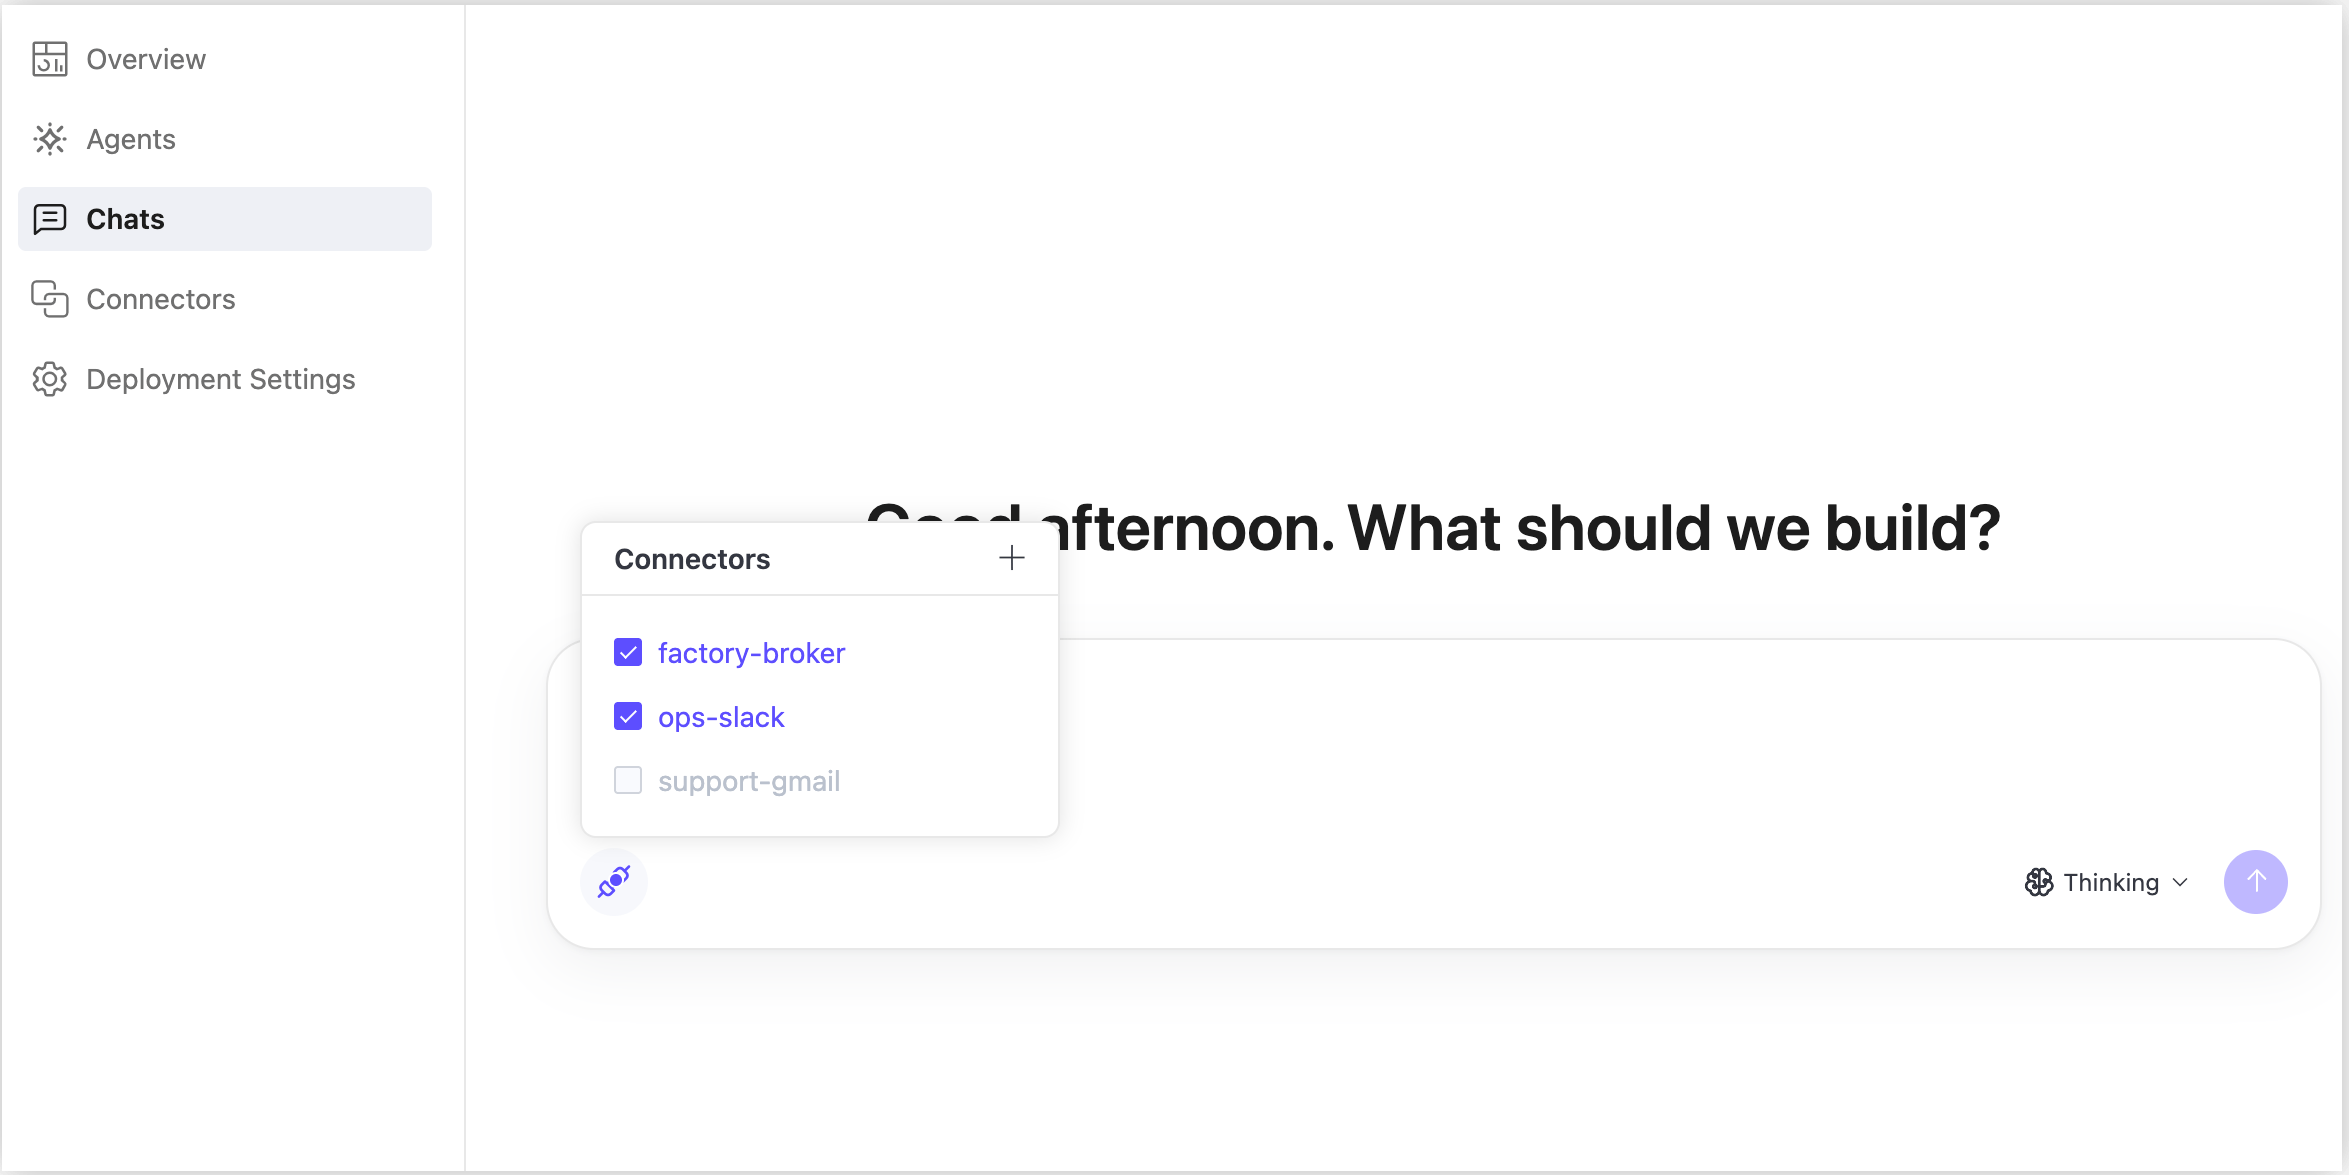
Click the connector icon in the lower-left corner of the input area.
In the Connectors panel, select the MCP connector you created.
The example below uses MQTT events and Slack notifications, so select both
factory-brokerand your authorized Slack connector.Only Authorized MCP connectors can be selected. If the connector is shown but disabled, return to the Connectors page and complete or retry authorization first.
Enter the following prompt:
Listen to MQTT topic /devices/#. If the temperature in the MQTT message
is above 30, please send a warning message to Slack. Channel: <channel-name>.
Replace
<channel-name>with the Slack channel you want to notify.Select your preferred thinking mode, then click the send button.
The LLM generates an agent definition that can include tools exposed by the selected MCP connector.
Step 3: Deploy the MCP Agent
When the generated definition is ready, click Deploy Agent.
Review the pre-filled Agent Name and Description, then click Deploy Agent.
Open the agent detail page and review the Tools and Prompt tabs to confirm that the generated agent uses the selected MCP connector.
Step 4: Test the MCP Agent
Test the MCP agent according to the MQTT topic and Slack action described in the chat prompt. This test flow is different from the temperature anomaly monitor in the main tutorial.
Use your MQTT client to publish a test message to a topic that matches
/devices/#, for example/devices/device-001.json{"device_id": "device-001", "temperature": 31}Check the Slack channel specified in the prompt for the warning message.
Return to EMQX Agents and open the run detail page. MCP connector calls appear as tool results in the run timeline, and the final Response event summarizes the result.
What's Next
- Add an EMQX Tables connector to query or write time-series data from within an agent.
- Manage MCP connectors to let agents use external services such as Gmail or Slack.
- Review and manage your agents to monitor run history, inspect timelines, and redeploy with updated behavior.
- Update your connectors to change credentials or add connections to additional brokers.